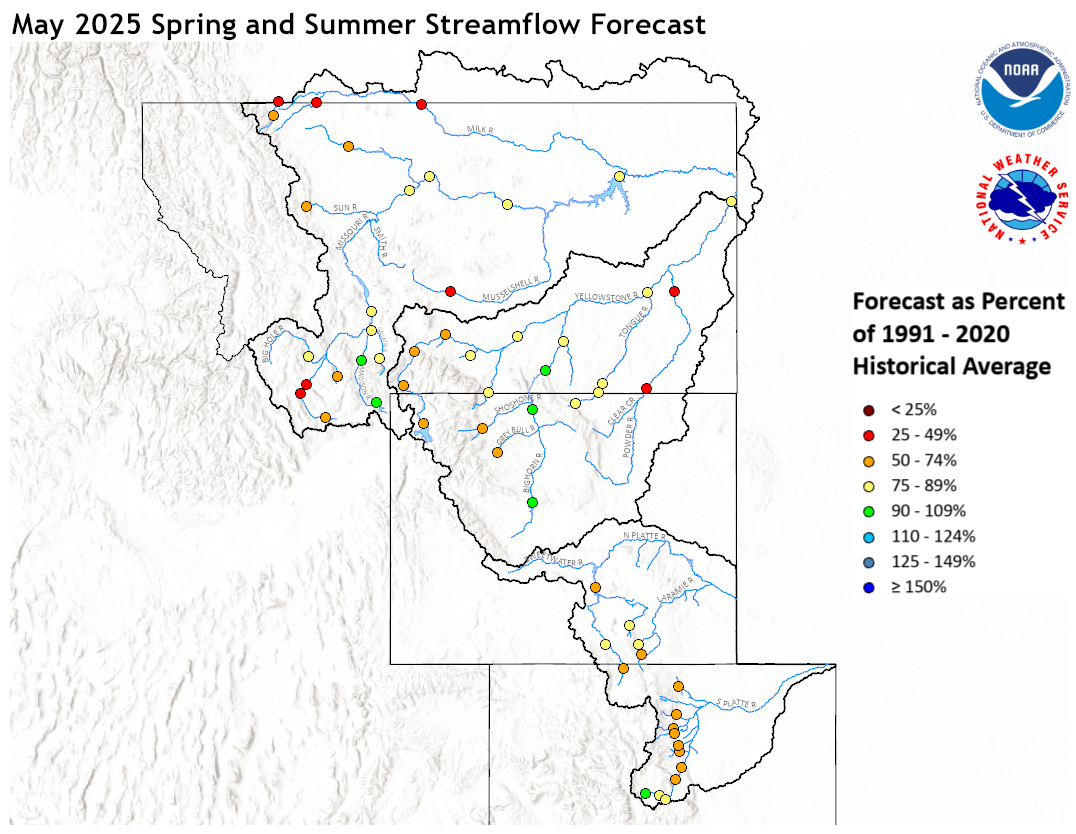
May 1, 2025 Spring and Summer Streamflow Forecasts
Upper Missouri Basin
The high elevation snow pack in the Upper Missouri Basin as of May 1
was below average. The snow pack in the St. Mary Basin was 89 percent,
and the Milk River Basin was 87 percent.
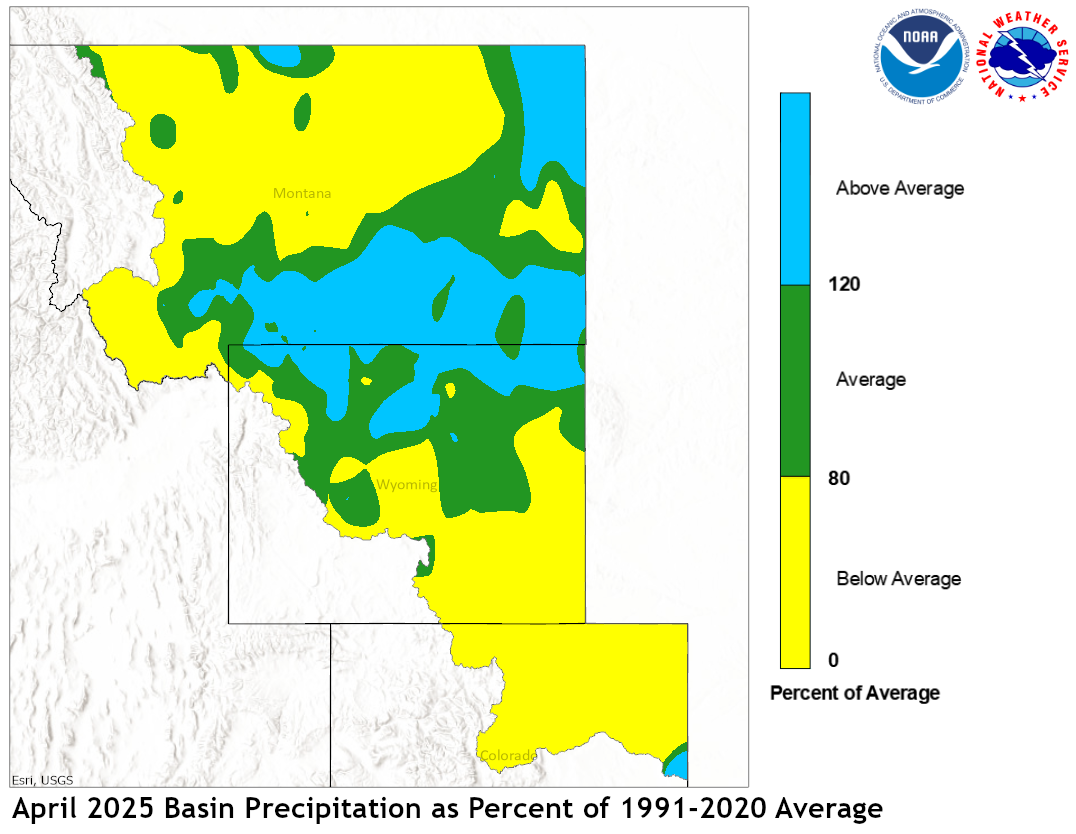
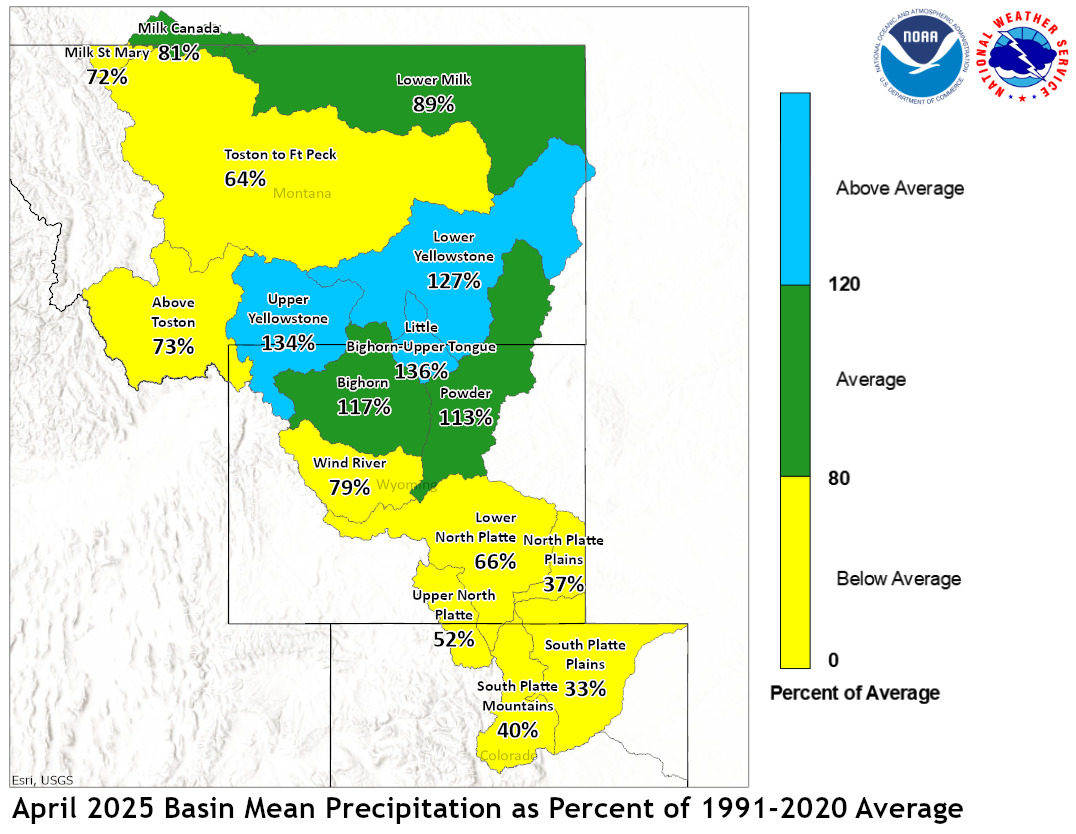
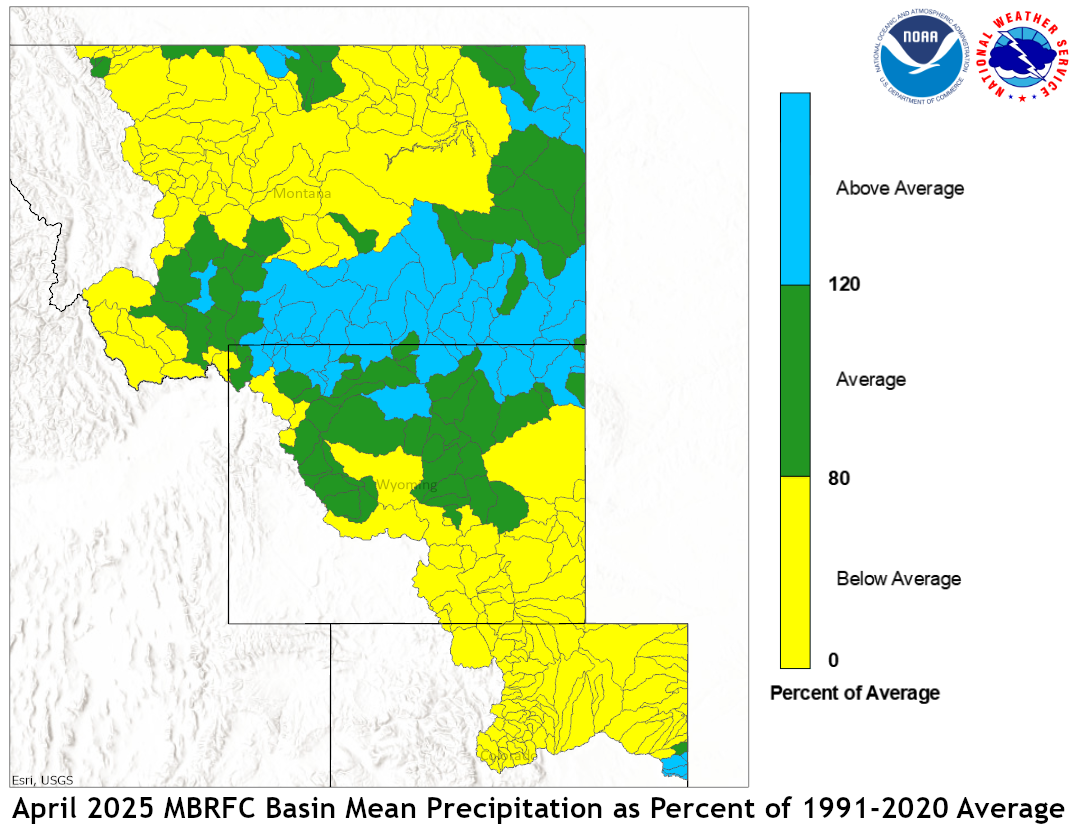
April precipitation across the Upper Missouri Basin was below average.
Basin precipitation summaries for the Missouri Basin include: Milk St. Mary,
72 percent; Milk Canada, 81 percent; Lower Milk, 89 percent; above Toston,
73 percent; Toston to Ft. Peck, 64 percent.
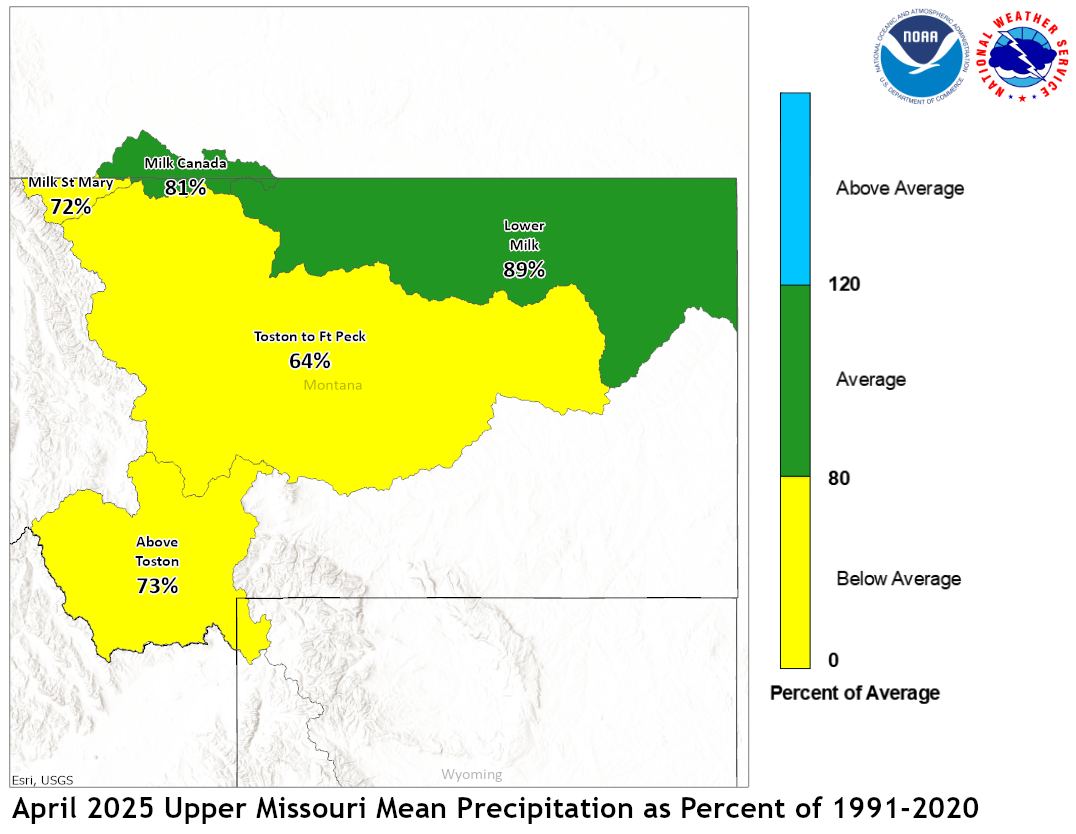
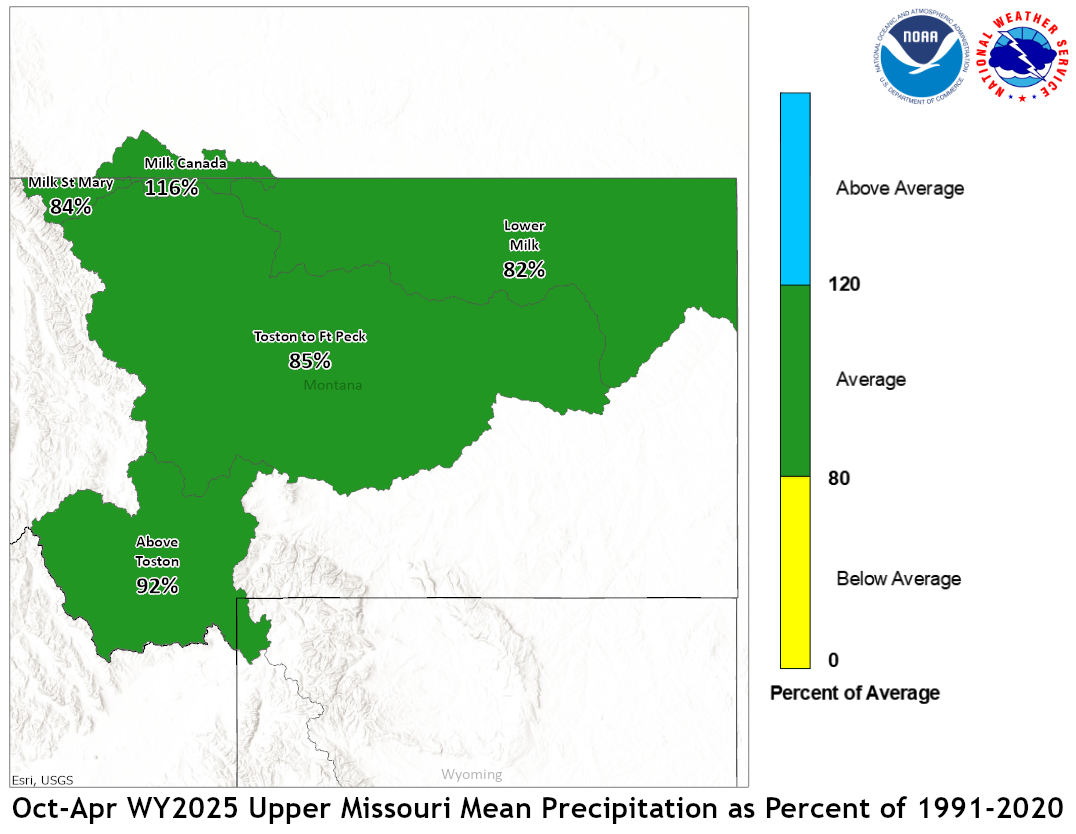
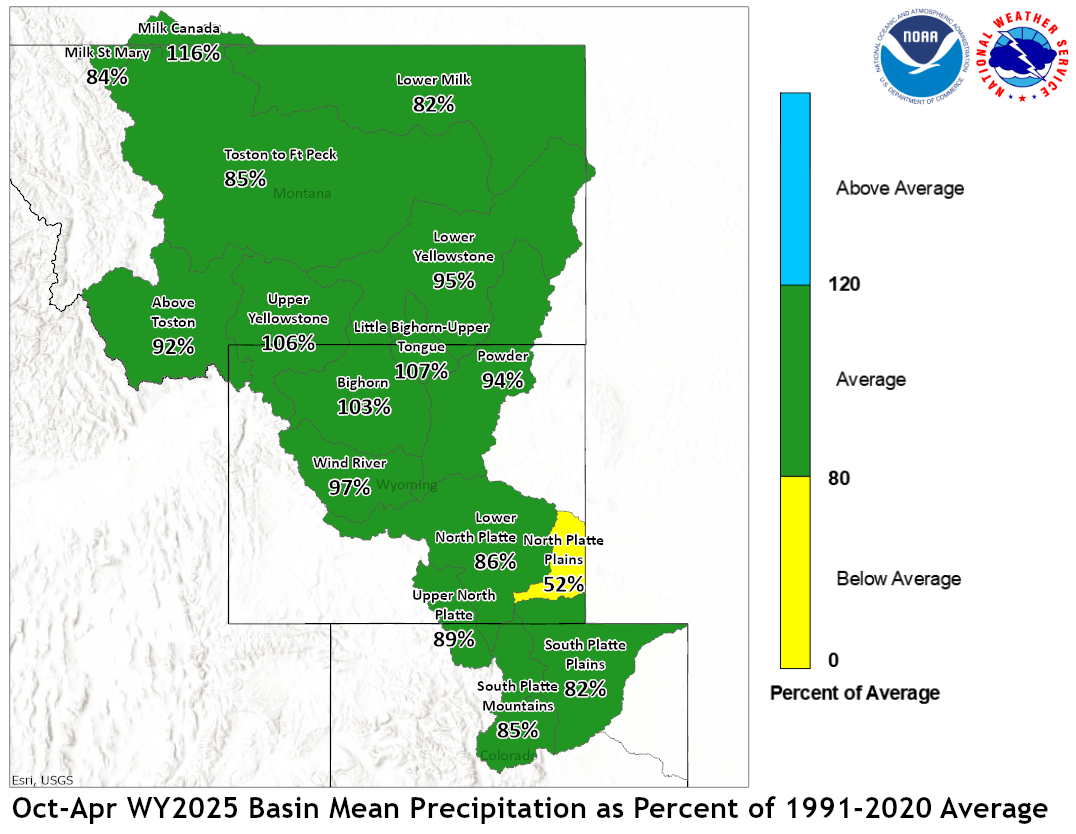
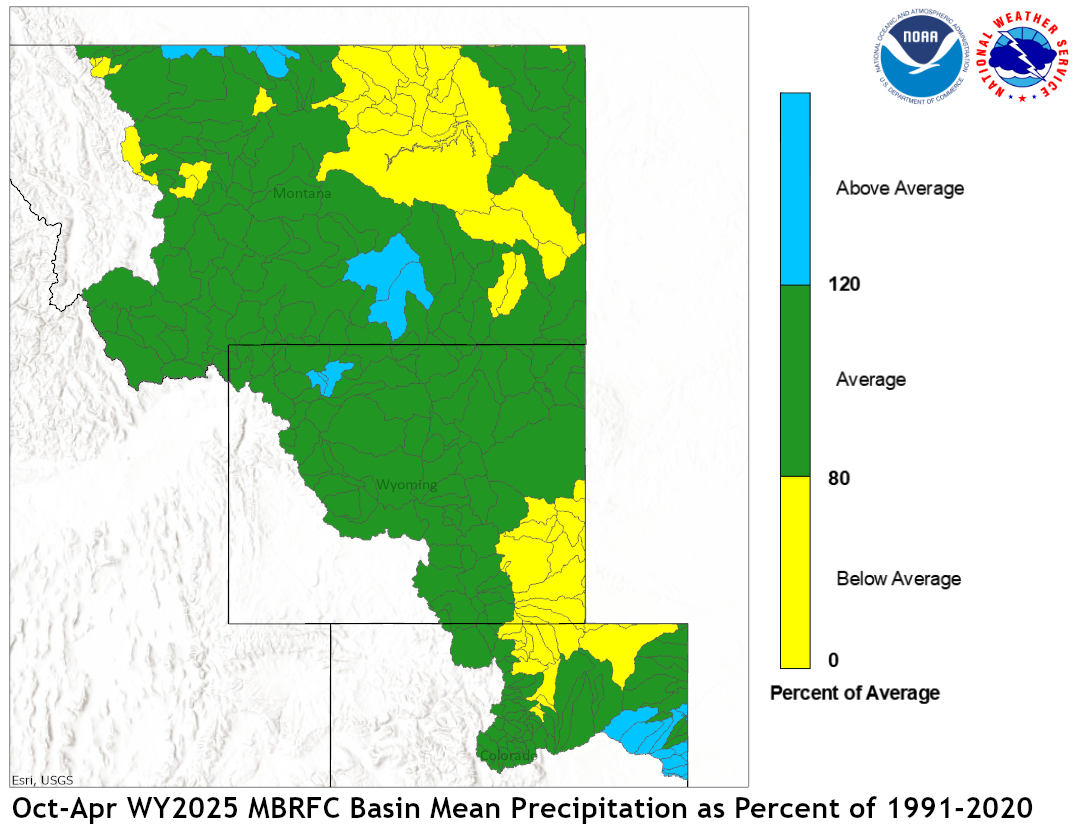
April 2025 Upper Missouri Mean Precip Oct-Apr WY2025 Upper Missouri Mean Precip
Stream flow in the Upper Missouri Basin is forecast to be
below average during the upcoming Spring and Summer.
The St. Mary River is forecast to have 50 percent of average
April-September flows. Runoff is expected to range around
82 percent of average for the Missouri Basin above Fort Peck,
Montana.

Upper Missouri May 1, 2025 Spring and Summer Streamflow Forecasts
Of the four major irrigation reservoirs in Montana; Lima
Reservoir had 105 percent average storage, Clark Canyon was
holding 106 percent of average water, Gibson Reservoir had 55
percent of average stored water, and Fresno Reservoir had
49 percent of average stored water.
Yellowstone Basin
The high elevation snow pack in the Yellowstone Basin was near average
on May 1. The snow pack in the Upper Yellowstone Basin was 101 percent
of average. The snow packs in the Wind, Bighorn, and Shoshone Basins were 100,
97, and 92 percent of average, respectively. The snow packs in the Tongue
and Powder basins were 112 and 75 percent of average, respectively.
Precipitation during April was above average. The upper Yellowstone River
Basin received 134 percent of average precipitation while the Lower
Yellowstone River Basin reported 127 percent of average. The Bighorn
Basin received 117 percent of average precipitation while the
Wind River Basin received 79 percent of average. The Little Bighorn -
Upper Tongue Basin received 136 percent of average and the Powder River
had 113 percent of average precipitation.
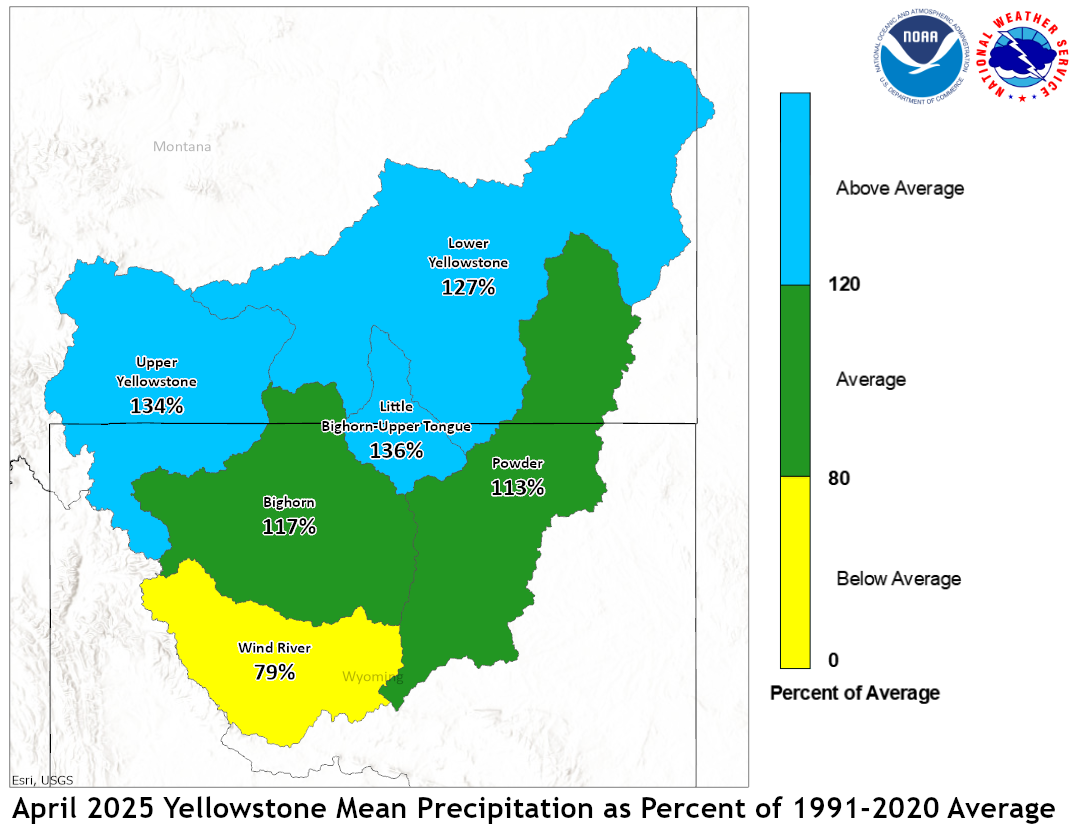
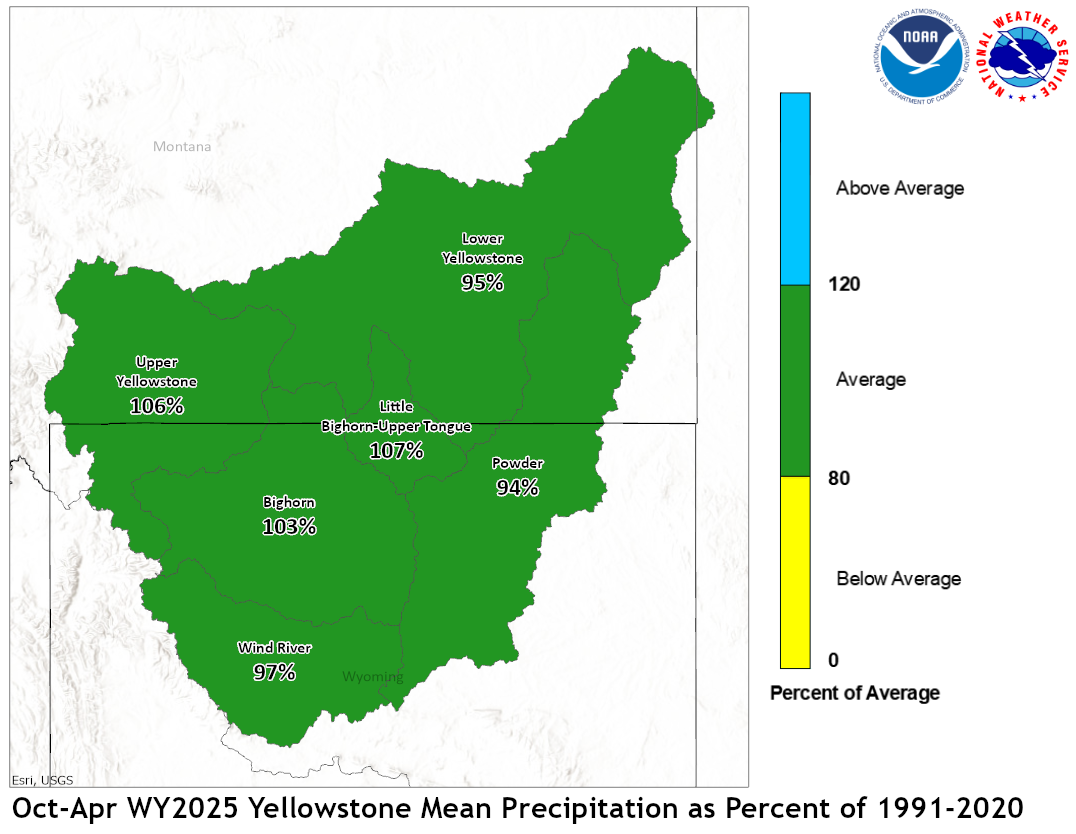
April 2025 Yellowstone Mean Precip Oct-Apr WY2025 Yellowstone Mean Precip
Forecast stream flow in the Yellowstone Basin is below average
for the upcoming Spring and Summer. Stream flow for the
Yellowstone River above Sidney, Montana is forecast to be about
79 percent of average. Flow in the Tongue Basin is expected to be
78 percent of average. Flows in the Powder River are expected
to be about 45 percent of average.
Monthend storage at Boysen Reservoir was 93 percent of average.
Stored water in Buffalo Bill Reservoir was 97 percent of average.
Monthend storage was 103 percent of average at Bighorn Reservoir.
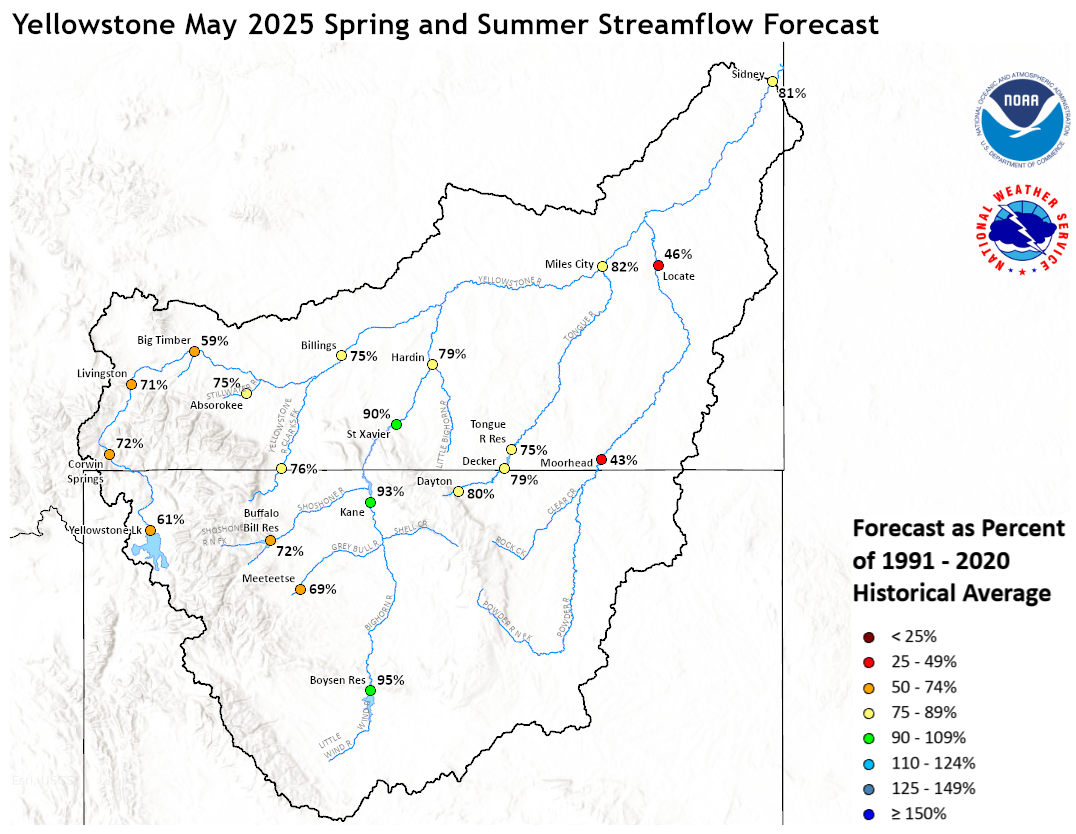
Yellowstone May 1, 2025 Spring and Summer Streamflow Forecasts
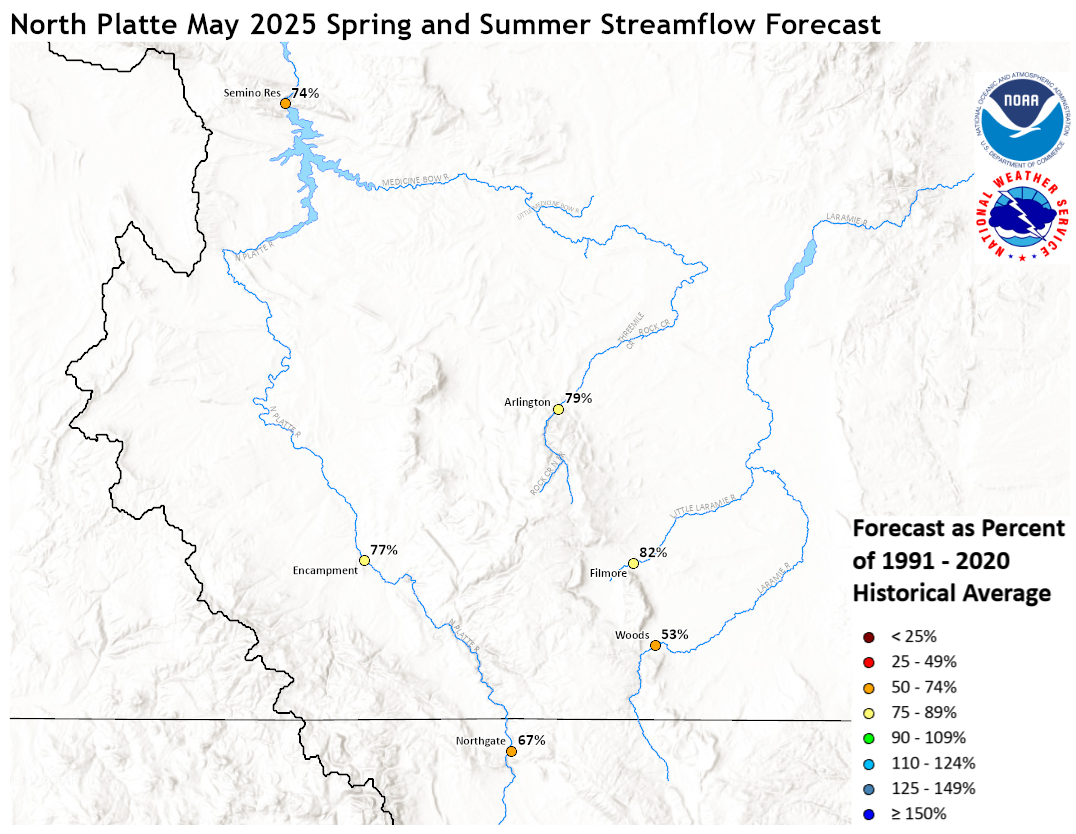
Platte Basin
The high elevation snow pack in the Upper North Platte Basin was
79 percent of average on May 1. The snow pack in the North Platte
Basin below Seminoe Reservoir was 74 percent of average. The snow
pack in the South Platte Basin was 73 percent of average.
Precipitation during April in the Upper North Platte Basin was 52
percent of average. In the Lower North Platte Basin, precipitation
was 66 percent of average. The North Platte Plains below Guernsy
Reservoir had 37 percent. The South Platte Mountains had 40
percent whereas the Plains had 33 percent of average April
precipitation.
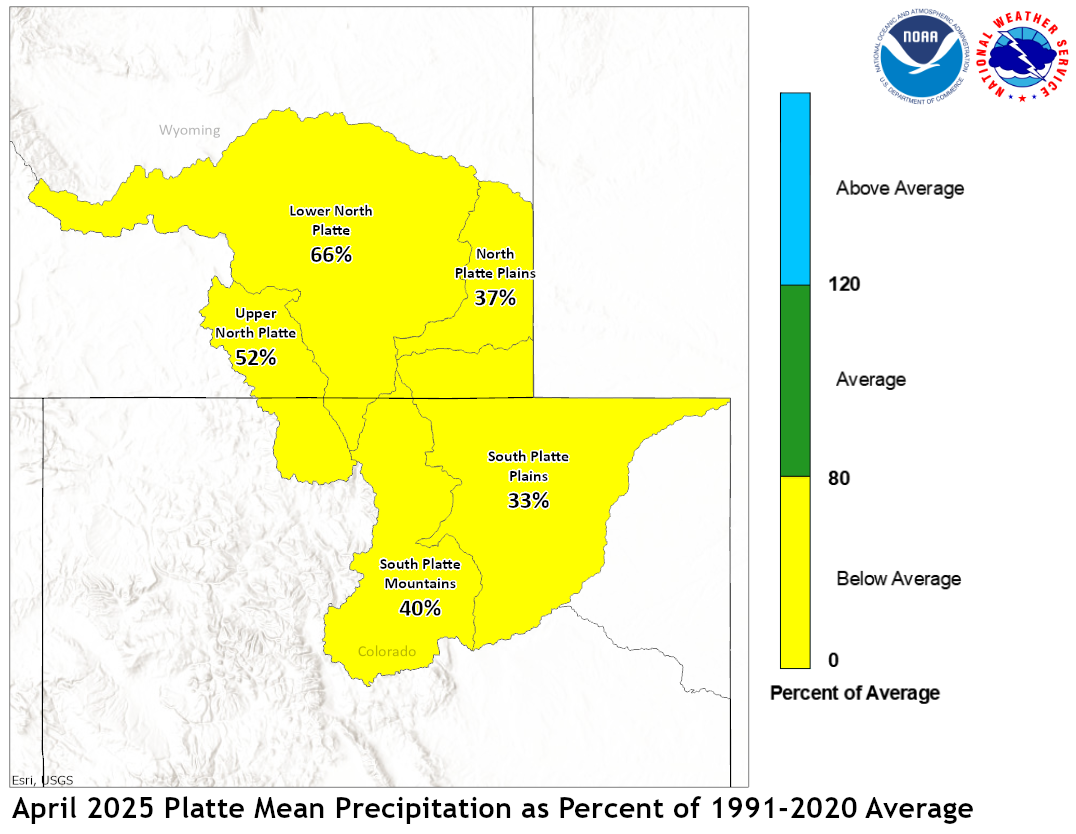
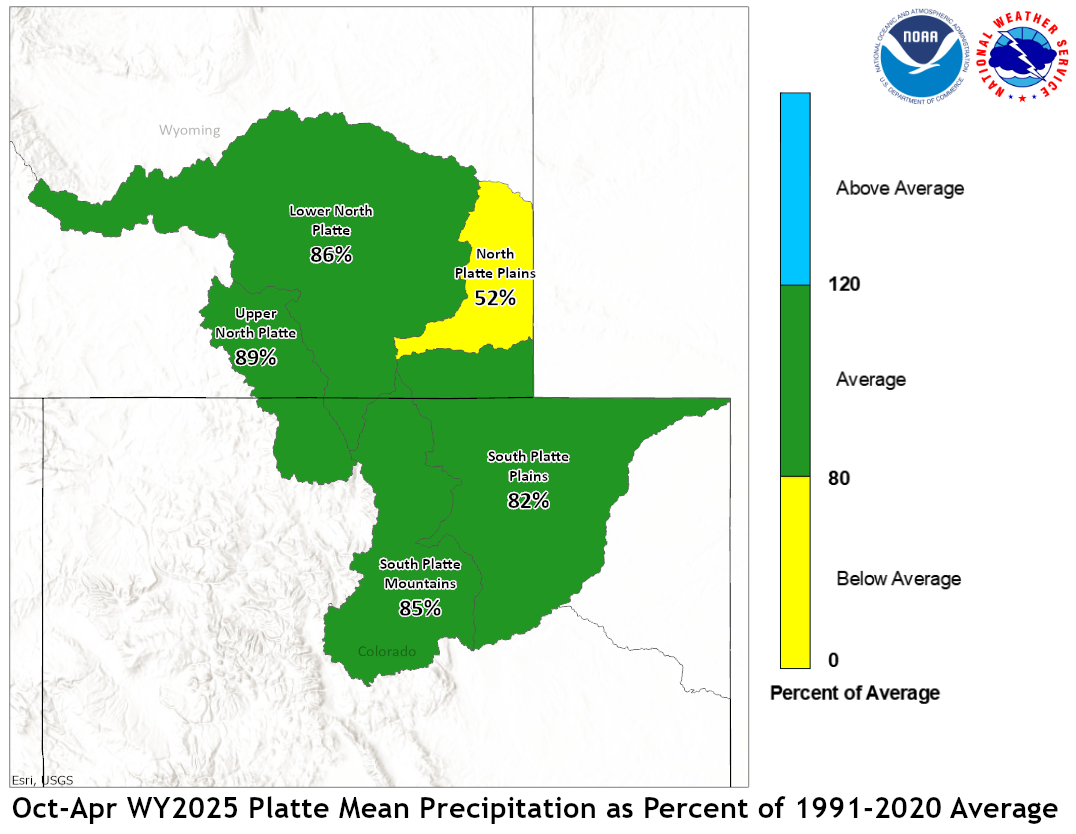
April 2025 Platte Mean Precip Oct-Apr WY2025 Platte Mean Precip
Stream flow in the Platte Basin is forecast to be below
average during the upcoming Spring and Summer. Runoff
for streams above Seminoe Reservoir are expected to be
about 78 percent of average. Streams in the South Platte
Basin above South Platte, Colorado can expect 68 percent
of average flow. For the remainder of the South Platte
basin, flows are expected near 82 percent.
Stored water in the South Platte Basin was 99 percent of average
on May 1.
North Platte Streamflow Fcst South Platte Streamflow Fcst
WATER SUPPLY FORECAST
NWS MISSOURI BASIN RIVER FORECAST CENTER
PLEASANT HILL MISSOURI

1027 CDT WEDNESDAY MAY 07, 2025

DATA CURRENT AS OF: MAY 01, 2025

MISSOURI/YELLOWSTONE/PLATTE RIVER BASIN FORECASTS


                                          50%   %   10%   90%   AVG
FORECAST POINT                   PERIOD  (KAF) AVG (KAF) (KAF) (KAF)
--------------------------------------------------------------------

Boysen Resvr Inflow              Apr-Sep  388   54   694  233    720
 SBDW4

Boysen Resvr Inflow              Apr-Sep  843   95  1208  630    890
 SBDW4N

Bighorn R at Kane                Apr-Sep  644   65  1110  502    985
 LVEW4

Bighorn R at Kane                Apr-Sep 1340   93  1996 1023   1440
 LVEW4N

Greybull R at Meeteetse          Apr-Sep  142   72   233  107    196
 MEEW4

Greybull R at Meeteetse          Apr-Sep  142   69   233  107    205
 MEEW4N

Buffalo Bill Resvr Inflow        Apr-Sep  564   69   734  476    815
 CDYW4

Buffalo Bill Resvr Inflow        Apr-Sep  652   72   815  569    910
 CDYW4N

Keyhole Resvr Inflow             Apr-Sep   10  250    34    4      4
 KEYW4

St. Mary R nr Babb               Apr-Sep  328   71   392  291    460
 SMYM8

St. Mary R nr Babb               Apr-Sep  303   57   367  264    535
 SMYM8N

St. Mary R at Intl Boundary      Apr-Sep  342   88   425  294    390
 SMBM8

St. Mary R at Intl Boundary      Apr-Sep  316   48   400  269    660
 SMBM8N

Milk R nr Western Crossing       Apr-Sep   11   10    33    8    113
 PDBM8

Milk R nr Western Crossing       Apr-Sep   18   44    47   12     41
 PDBM8N

Milk R nr Eastern Crossing       Apr-Sep   16    7   106    8    215
 ERNM8

Milk R nr Eastern Crossing       Apr-Sep   48   43   166   28    112
 ERNM8N

North Platte R nr Northgate      Apr-Sep  145   59   235   85    245
 NGTC2

North Platte R nr Northgate      Apr-Sep  199   67   288  137    295
 NGTC2N

Encampment R nr Encampment       Apr-Sep  119   76   140   94    156
 ECRW4

Encampment R nr Encampment       Apr-Sep  128   77   148  103    166
 ECRW4N

Rock Cr nr Arlington             Apr-Sep   42   79    49   35     53
 KCRW4

Rock Cr nr Arlington             Apr-Sep   42   79    49   35     53
 KCRW4N

Seminoe Resvr Inflow             Apr-Sep  533   70   694  353    765
 SETW4

Seminoe Resvr Inflow             Apr-Sep  685   74   840  513    920
 SETW4N

Laramie R nr Woods Landing       Apr-Sep   38   35    69   20    108
 WODW4

Laramie R nr Woods Landing       Apr-Sep   75   53   106   55    142
 WODW4N

Little Laramie R nr Filmore      Apr-Sep   44   80    56   35     55
 SMTW4

Little Laramie R nr Filmore      Apr-Sep   47   82    58   37     57
 SMTW4N

Antero Resvr Inflow              Apr-Sep   13   93    17   10     14
 ANRC2

Antero Resvr Inflow              Apr-Sep   13   93    17   10     14
 ANRC2N

Spinney Mountain Resvr Inflow    Apr-Sep   40   70    58   33     57
 SPYC2

Spinney Mountain Resvr Inflow    Apr-Sep   35   78    52   27     45
 SPYC2N

Elevenmile Canyon Resvr Inflow   Apr-Sep   40   68    52   35     59
 EVNC2

Elevenmile Canyon Resvr Inflow   Apr-Sep   38   76    57   28     50
 EVNC2N

Cheesman Lk Inflow               Apr-Sep   48   48    64   37    100
 CHEC2

Cheesman Lk Inflow               Apr-Sep   63   68    98   43     93
 CHEC2N

S Platte R at S Platte           Apr-Sep  288  120   321  271    240
 SPTC2

S Platte R at S Platte           Apr-Sep  124   60   178   88    205
 SPTC2N

Bear Cr at Morrison              Apr-Sep   13   50    23    8     26
 MRRC2

Bear Cr at Morrison              Apr-Sep   13   50    23    8     26
 MRRC2N

Clear Cr at Golden               Apr-Sep   80   68   103   65    118
 GLDC2

Clear Cr at Golden               Apr-Sep   91   69   114   75    131
 GLDC2N

St. Vrain Cr at Lyons            Apr-Sep   48   61    70   38     79
 LNSC2

St. Vrain Cr at Lyons            Apr-Sep   72   66    99   59    109
 LNSC2N

Boulder Cr nr Orodell            Apr-Sep   16   34    26   14     47
 OROC2

Boulder Cr nr Orodell            Apr-Sep   29   56    43   25     52
 OROC2N

S Boulder Cr nr Eldorado Sprgs   Apr-Sep   20   57    25   15     35
 BELC2

S Boulder Cr nr Eldorado Sprgs   Apr-Sep   20   50    30   15     40
 BELC2N

Cache La Poudre at Canyon Mouth  Apr-Sep  115  106   170   90    108
 FTDC2

Cache La Poudre at Canyon Mouth  Apr-Sep  146   70   208  106    210
 FTDC2N

Lima Resvr Inflow                Apr-Sep   58   76    76   52     76
 LRRM8

Lima Resvr Inflow                Apr-Sep   58   73    76   52     79
 LRRM8N

Clark Canyon Resvr Inflow        Apr-Sep   45   41    53   43    110
 CLKM8

Clark Canyon Resvr Inflow        Apr-Sep   98   49   129   87    198
 CLKM8N

Beaverhead R at Barretts         Apr-Sep  109   55   122  105    199
 BARM8

Beaverhead R at Barretts         Apr-Sep  123   44   156  110    280
 BARM8N

Ruby R Resvr Inflow              Apr-Sep   50   57    63   41     88
 ALRM8

Ruby R Resvr Inflow              Apr-Sep   51   53    64   42     97
 ALRM8N

Big Hole R nr Melrose            Apr-Sep  477   80   663  413    595
 MLRM8

Big Hole R nr Melrose            Apr-Sep  546   83   731  480    660
 MLRM8N

Hebgen Resvr Inflow              Apr-Sep  432   93   491  387    465
 HBDM8

Hebgen Resvr Inflow              Apr-Sep  432   93   491  387    465
 HBDM8N

Ennis Resvr Inflow               Apr-Sep  609   85   708  568    715
 ELMM8

Ennis Resvr Inflow               Apr-Sep  717   98   825  652    730
 ELMM8N

Gallatin R nr Gateway            Apr-Sep  366   77   451  309    475
 GLGM8

Gallatin R nr Gateway            Apr-Sep  366   77   451  309    475
 GLGM8N

Gallatin R at Logan              Apr-Sep  417   83   543  350    505
 LOGM8

Gallatin R at Logan              Apr-Sep  570   88   685  511    650
 LOGM8N

Missouri R at Toston             Apr-Sep 1535   75  1980 1379   2060
 TOSM8

Missouri R at Toston             Apr-Sep 2315   82  2726 2150   2830
 TOSM8N

Missouri R at Fort Benton        Apr-Sep 1622   53  1856 1529   3060
 FBNM8

Missouri R at Fort Benton        Apr-Sep 3294   80  3891 2994   4100
 FBNM8N

Missouri R nr Virgelle           Apr-Sep 1775   52  2024 1653   3420
 VRGM8

Missouri R nr Virgelle           Apr-Sep 3657   80  4438 3350   4560
 VRGM8N

Missouri R nr Landusky           Apr-Sep 2086   57  2359 1892   3680
 LDKM8

Missouri R nr Landusky           Apr-Sep 4040   83  4823 3709   4890
 LDKM8N

Missouri R below Fort Peck Dam   Apr-Sep 2380   62  2705 2106   3840
 FPKM8

Missouri R below Fort Peck Dam   Apr-Sep 4366   84  5151 3992   5180
 FPKM8N

Gibson Resvr Inflow              Apr-Sep  328   73   448  280    450
 AGSM8

Gibson Resvr Inflow              Apr-Sep  328   73   448  279    450
 AGSM8N

Marias R nr Shelby               Apr-Sep  237   54   365  178    435
 SHLM8

Marias R nr Shelby               Apr-Sep  292   60   420  228    490
 SHLM8N

Musselshell R at Harlowton       Apr-Sep   31   39    58   22     80
 HLWM8

Musselshell R at Harlowton       Apr-Sep   42   44    67   31     95
 HLWM8N

Yellowstone R at Yellowstone Lk  Apr-Sep  389   48   429  334    815
 YLOW4

Yellowstone R at Yellowstone Lk  Apr-Sep  509   61   585  438    840
 YLOW4N

Yellowstone R at Corwin Sprgs    Apr-Sep 1300   66  1487 1136   1980
 CORM8

Yellowstone R at Corwin Sprgs    Apr-Sep 1482   72  1692 1294   2070
 CORM8N

Yellowstone R at Livingston      Apr-Sep 1310   57  1557 1184   2290
 LIVM8

Yellowstone R at Livingston      Apr-Sep 1738   71  2021 1534   2440
 LIVM8N

Yellowstone R at Billings        Apr-Sep 2509   62  3105 2251   4070
 BILM8

Yellowstone R at Billings        Apr-Sep 3595   75  4237 3273   4790
 BILM8N

Yellowstone R at Miles City      Apr-Sep 3590   61  4555 3139   5850
 MILM8

Yellowstone R at Miles City      Apr-Sep 6289   82  7601 5531   7690
 MILM8N

Yellowstone R at Sidney          Apr-Sep 3424   60  4365 2881   5710
 SIDM8

Yellowstone R at Sidney          Apr-Sep 6498   81  7877 5652   8060
 SIDM8N

Boulder R at Big Timber          Apr-Sep  181   54   220  151    335
 BTMM8

Boulder R at Big Timber          Apr-Sep  223   59   261  193    375
 BTMM8N

Stillwater R nr Absarokee        Apr-Sep  387   72   475  339    540
 SRAM8

Stillwater R nr Absarokee        Apr-Sep  447   75   533  399    595
 SRAM8N

Clks Fk Yellowstone R nr Belfry  Apr-Sep  457   74   564  397    620
 BFYM8

Clks Fk Yellowstone R nr Belfry  Apr-Sep  530   76   635  470    695
 BFYM8N

Bighorn R nr St. Xavier          Apr-Sep  960   67  1414  852   1430
 STXM8

Bighorn R nr St. Xavier          Apr-Sep 2223   90  2970 1767   2460
 STXM8N

Little Bighorn R nr Hardin       Apr-Sep  100   79   153   86    127
 HRDM8

Little Bighorn R nr Hardin       Apr-Sep  100   79   153   86    127
 HRDM8N

Tongue R nr Dayton               Apr-Sep   75   78   103   59     96
 DAYW4

Tongue R nr Dayton               Apr-Sep   81   80   108   64    101
 DAYW4N

Tongue R nr Decker               Apr-Sep  143   61   231  108    235
 DSLM8

Tongue R nr Decker               Apr-Sep  189   79   276  153    240
 DSLM8N

Tongue R Resvr Inflow            Apr-Sep  137   58   227  101    235
 DKRM8

Tongue R Resvr Inflow            Apr-Sep  183   75   273  147    245
 DKRM8N

Powder R at Moorhead             Apr-Sep   78   35   232   59    225
 MHDM8

Powder R at Moorhead             Apr-Sep  116   43   275   94    270
 MHDM8N

Powder R nr Locate               Apr-Sep   84   32   257   61    260
 LOCM8

Powder R nr Locate               Apr-Sep  141   46   331  106    305
 LOCM8N


Locations with an `N` suffix indicate natural flows excluding
stream augmentations.

KAF: Thousands of Acre-feet

%AVG: Current 50%/AVG

AVG: Average(50%) seasonal runoff voulme as simulated by the river
forecast model considering acontinuous simulation of the basin
response to historic climate data (observed precipitation and
temperatures) over the period of 1991-2020.

The 50%, 10% and 90% columns indicate the probability that the
actual volume will exceed the forecast for the valid time period.

Beginning April 1, May and June official forecasts include observed
runoff volume up to official forecast date.

For more information, please visit: www.weather.gov/mbrfc/water


