
Flash flooding threatens areas from the Tennessee Valley to the Carolinas as storms repeat along a stalled front. Monsoonal storms may trigger flooding in the Southwest. Dangerous heat expands across the Desert Southwest, Plains, mid-Mississippi Valley and Southern Tier. Critical fire weather for interior Pacific Northwest. Cooler, drier air brings brief relief to the Great Lakes and Northeast. Read More >
Lightning impacts Southern Oregon and Northern California in many ways. First, it can have significant impacts on the landscape of Southern Oregon and Northern California, including the start of wildfires. Additionally, thunderstorms can bring damaging winds, hail, flooding rainfall, and impacts to roadways via downed trees and other hazards. Last but not least, lightning alone poses a safety risk as humans are killed each year due to lightning.
We at the National Weather Service Office in Medford have been mapping and studying lightning over Southern Oregon and Northern California since about 2015. We'll share some of the imagery we've created here, and hopefully it provides some actionable information for people in terms of where and when lightning is most/least common for Southern Oregon and Northern California.
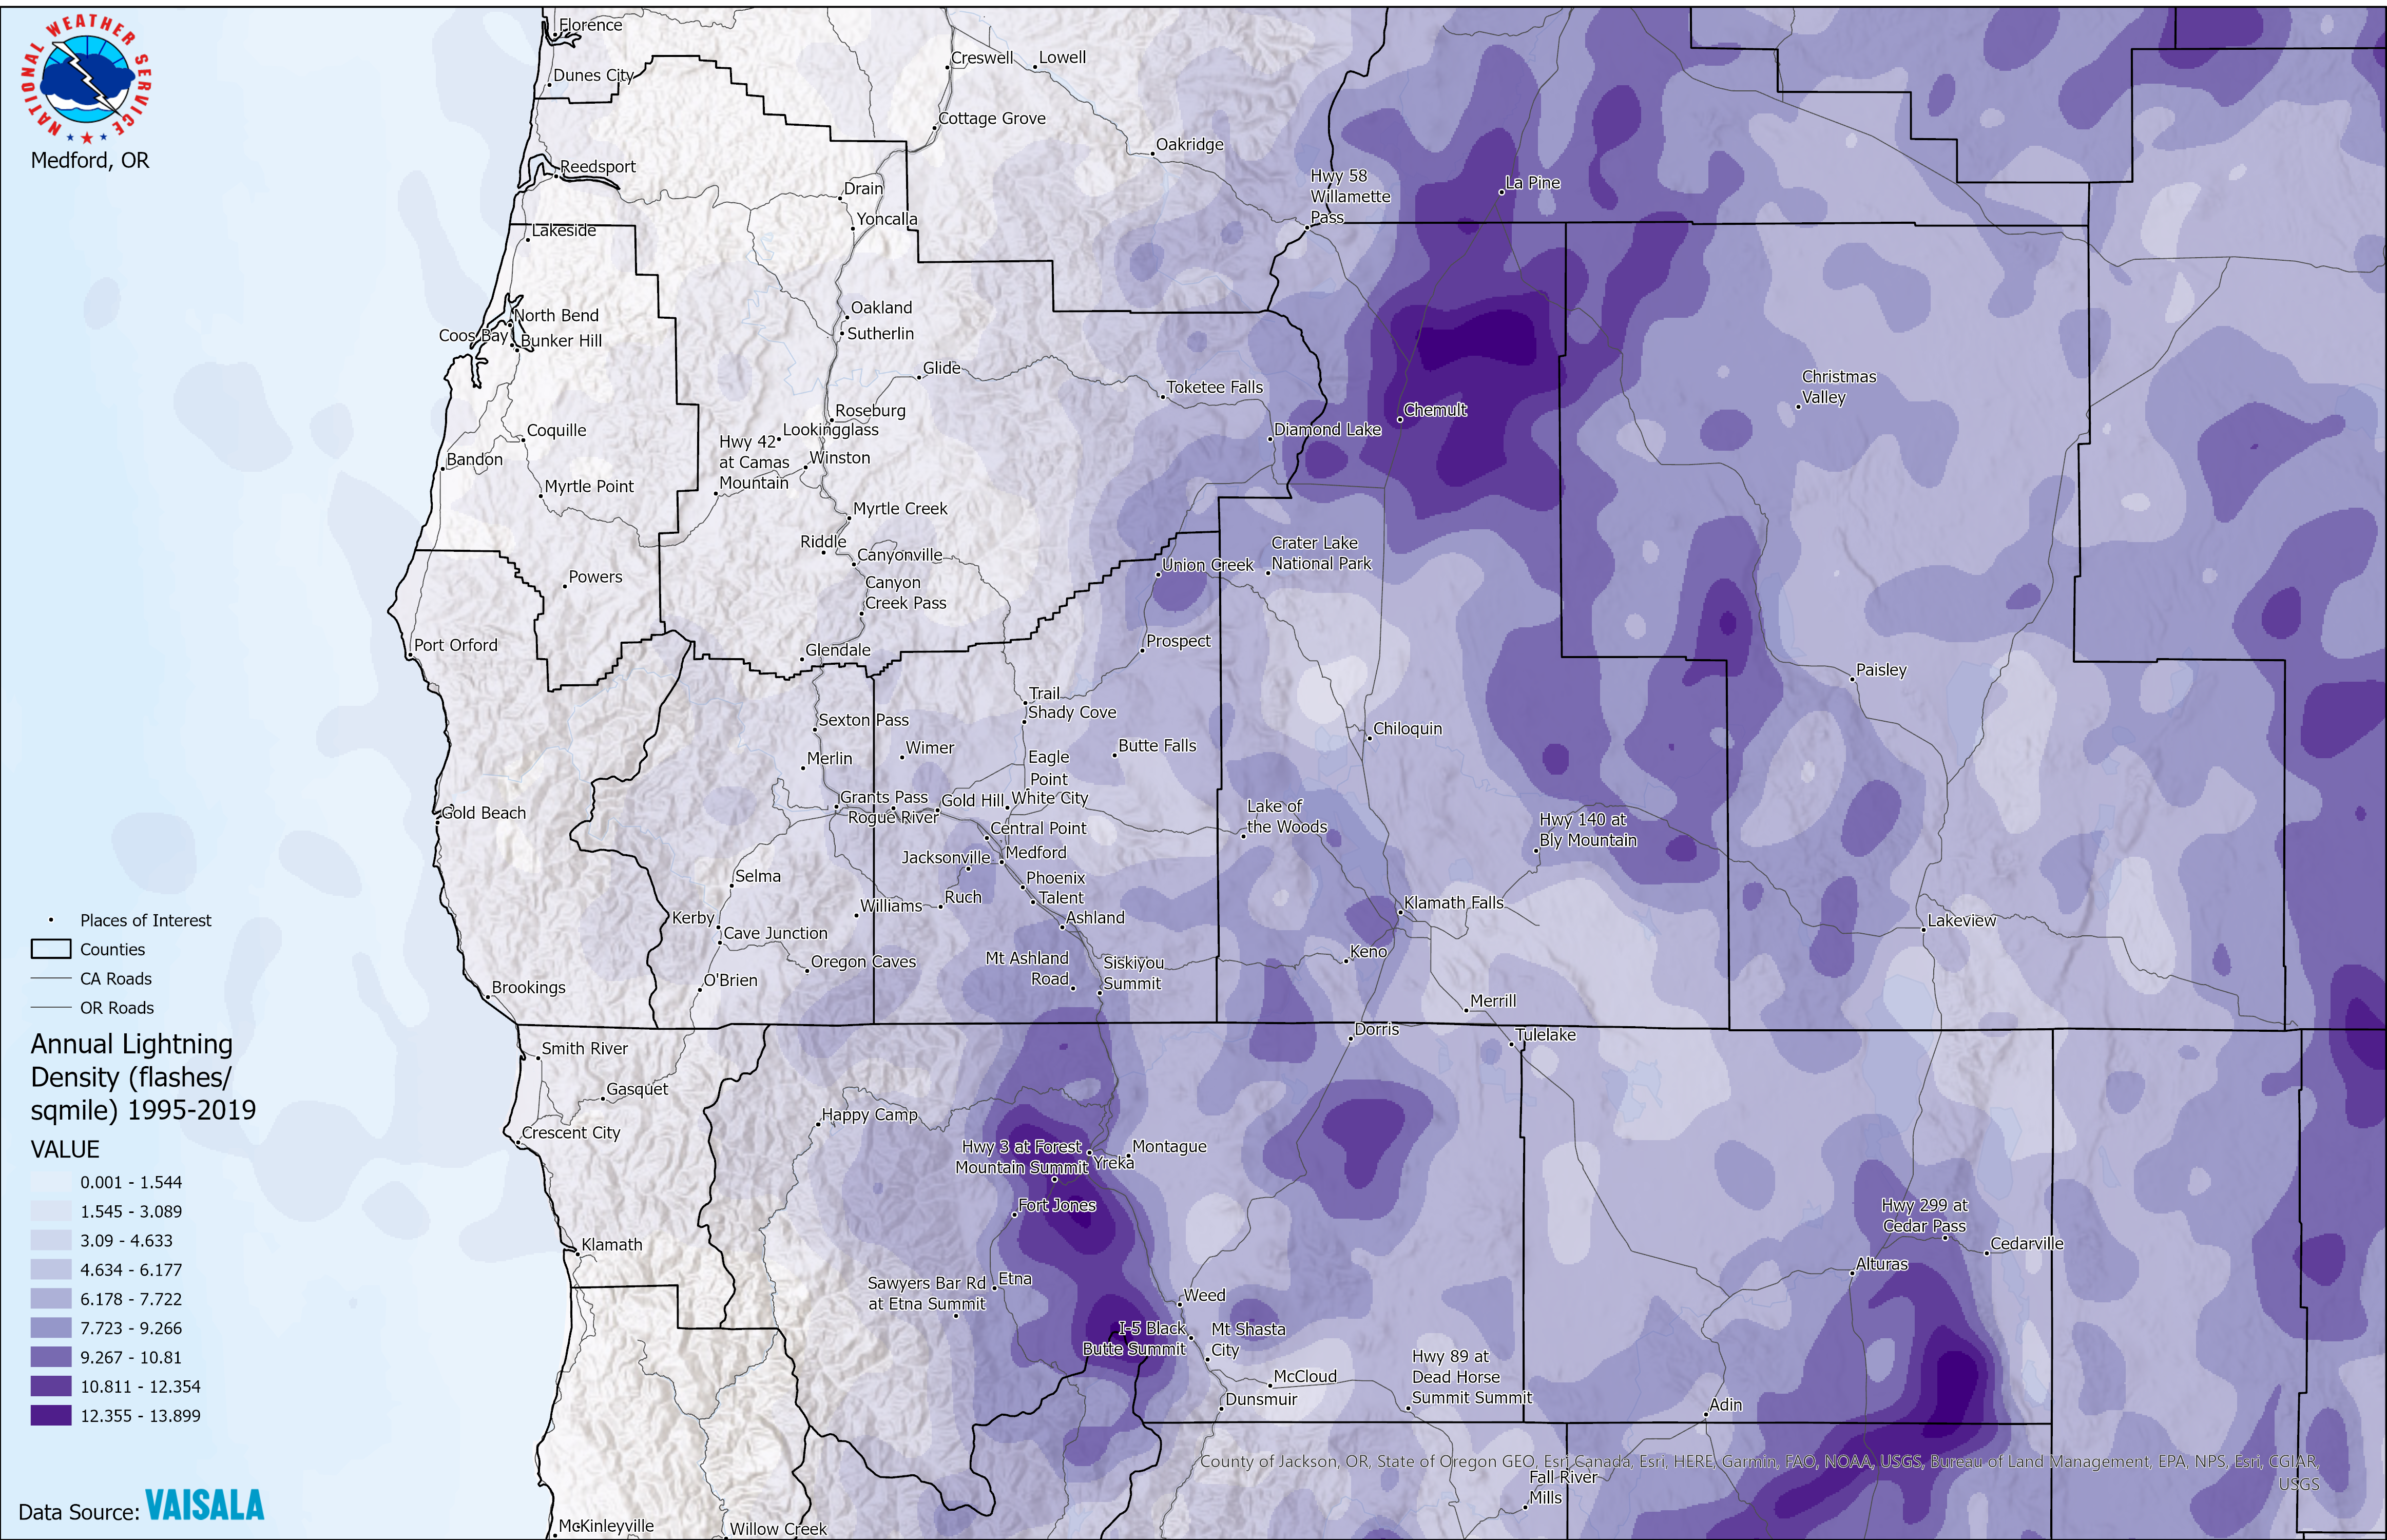
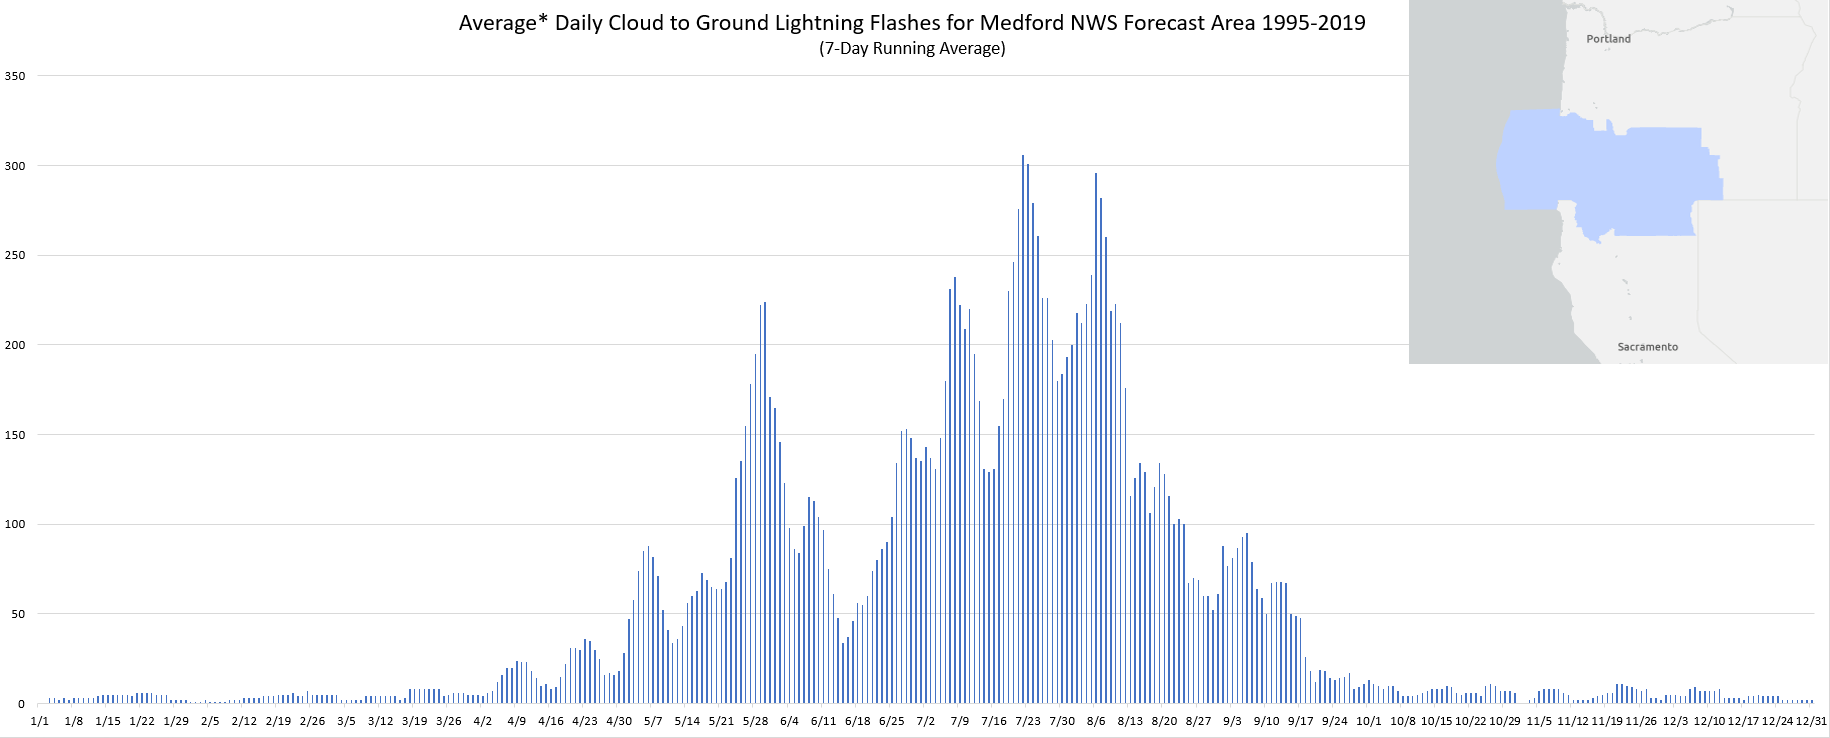
Below is a flash density map, showing where cloud to ground lightning flashes are most common across the forecast area. Additionally, the bar chart shows how cloud to ground lightning flashes vary throughout the year across the forecast area. There is a "spring spike" followed by multiple peaks in the summer.
The Storm Prediction Center has analyzed lightning across the United States and offers lightning climatology maps and heatmaps at their website. Explore these maps and data for your area.


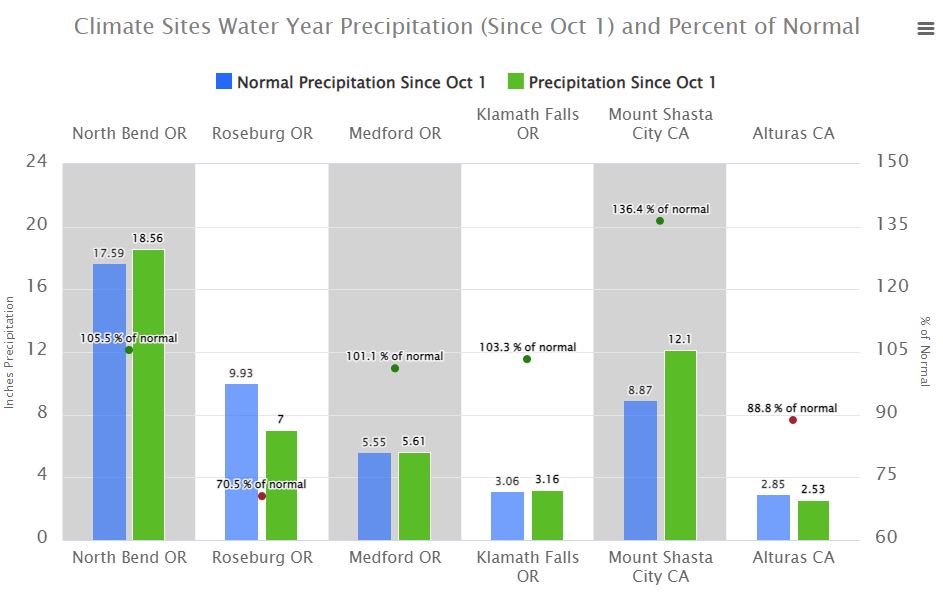 Precipitation Tracker
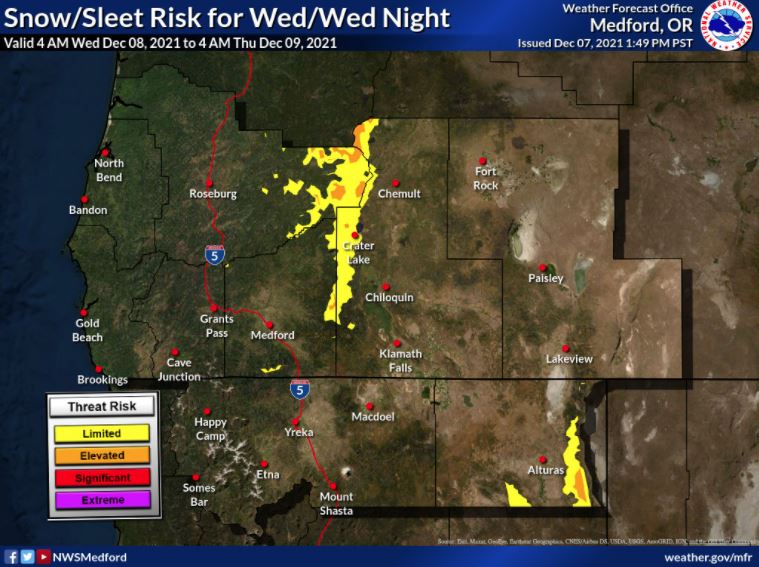 Graphical Hazards Outlook
 RADAR and Satellite
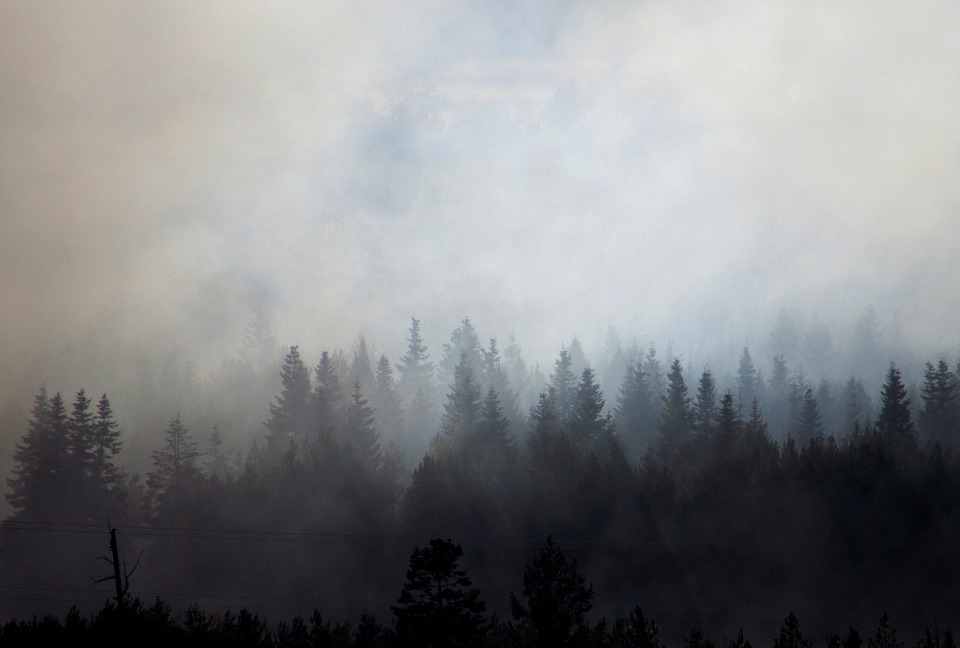 Wildfire Safety
 Forecast Discussion
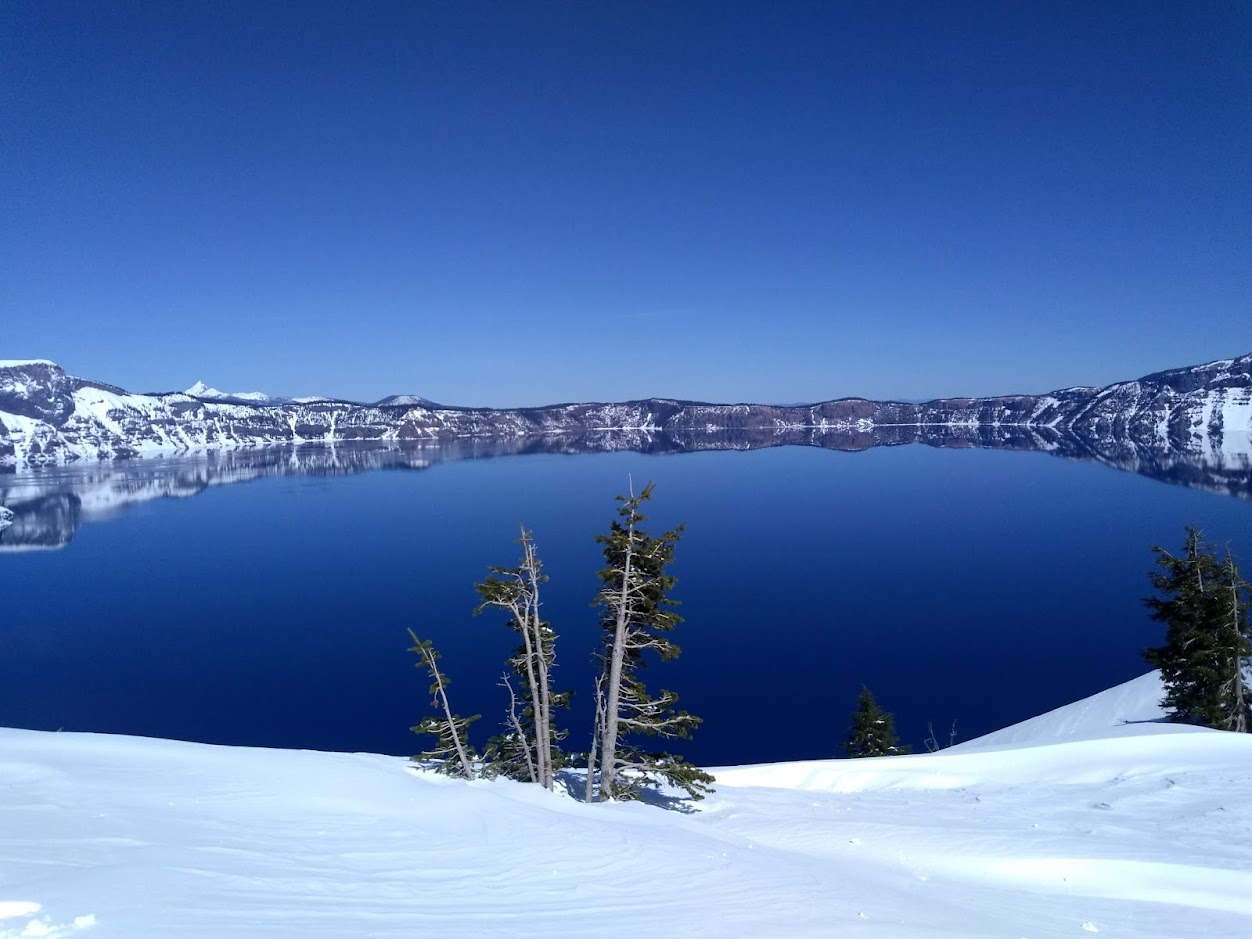 Snowfall and Depth With Crater Lake Details
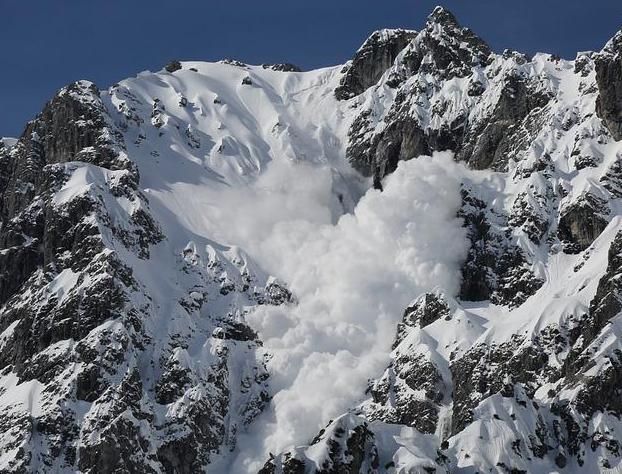 Avalanche Guidance
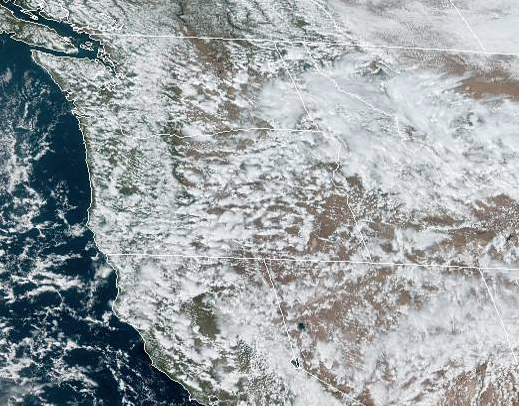 NESDIS Geocolor
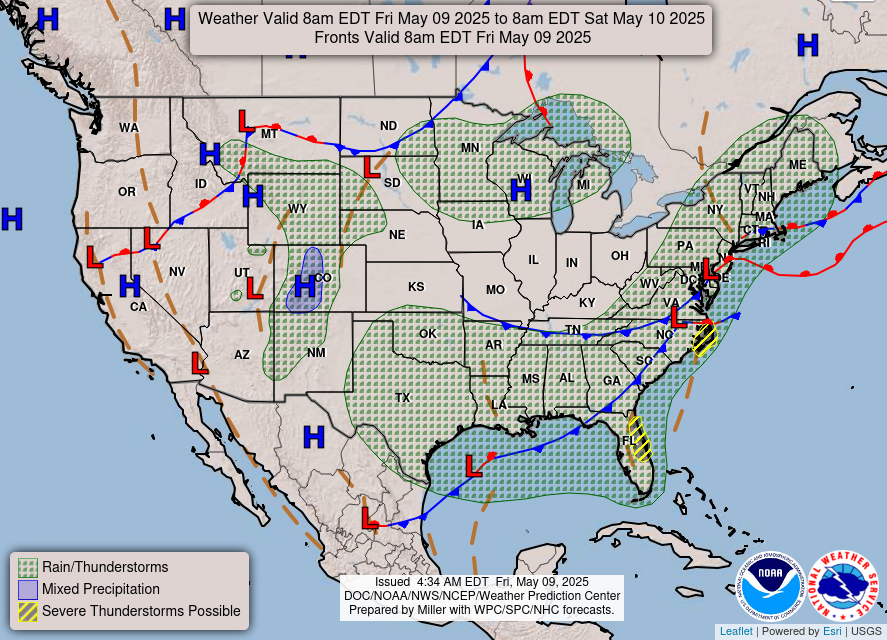 Weather Map
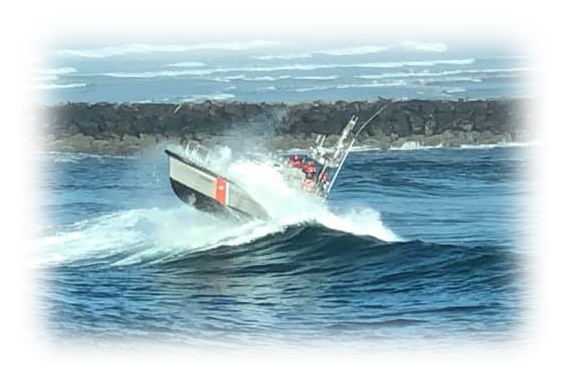 Marine
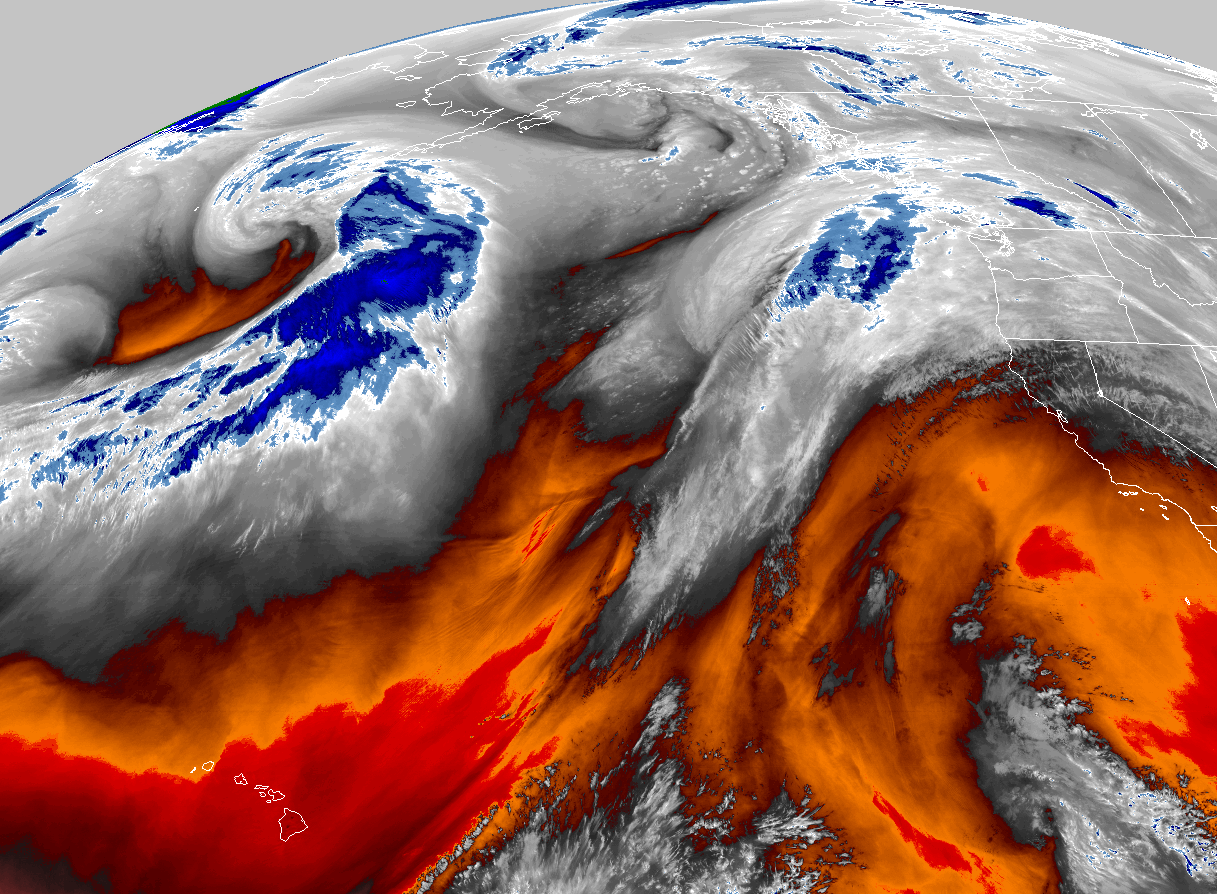 GOES 18 Water Vapor Imagery
 Local Climate Data
 Alternate Point Forecast
 Smoke Forecast
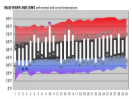 Weather Stats
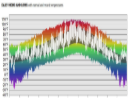 Year Charts
 Fire Weather