June 2026 Climate Summaries
Mobile Alabama and Pensacola Florida Area
National Weather Service Mobile Alabama
July 3, 2026
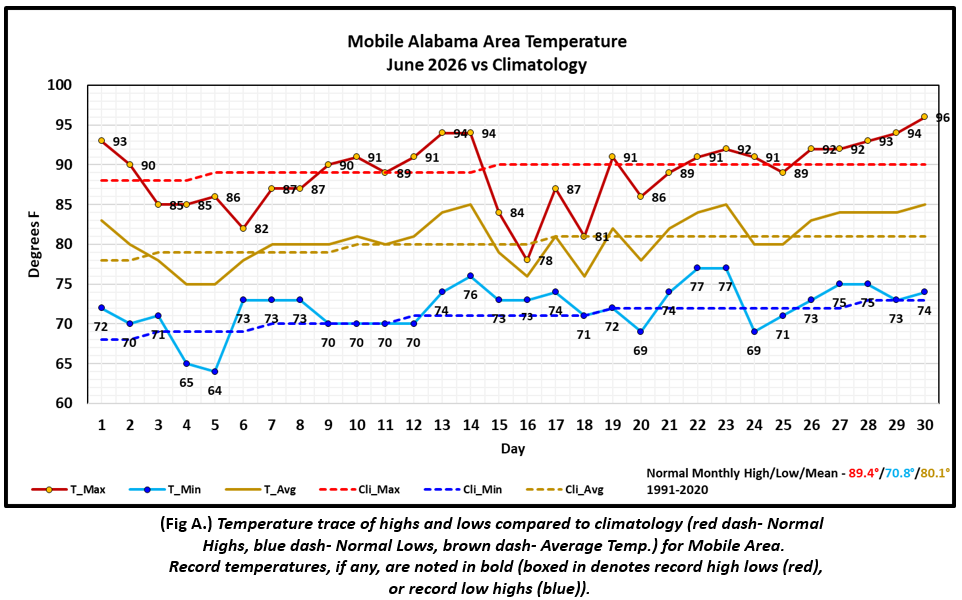
June 2026 in Review - June started off and ended a few degrees above normal in high temperatures at Mobile. The most notable drop off was mid month from the 15th to 18th when a cloudy and rainy period resulted in highs averaging 7.5° below normal through this period. There were no record temperatures reached at Mobile, but a high of 78° on the 16th was just shy of matching the daily record low high of 77°. Highs trended back above normal to close out the month. Average monthly highs closed out very close to normal. Night-time lows were mostly at, to above normal most of the month with average lows coming in a little over a degree above June normal. Pensacola also started and ended a few degrees above normal in the high temperature department. There was a more lengthy period of below normal highs beginning the 3rd and lasting through the 12th when highs averaged 4.3° below normal through this period. Another "cool" but shorter period, also the result of more cloud cover and rainy conditions, was the 16th to the 18th when highs averaged 6.3° below normal for the period. Night-time lows were either very close to, or above normal most of the month with average lows coming in a little over a half degree above June normal. No record temperatures were reached at Pensacola.
The rain gauge at Mobile collected nearly eight inches of rain for the month and above normal for June. Over half the monthly rains at Mobile occurred on the 18th with nearly 4.50" recorded and setting a new one day record rainfall for the day. Pensacola captured well over a half foot of rain, but was short of normal by over a half inch. Nearly a third of the monthly rainfall amount at Pensacola occurred on the 2nd when a bit over two inches was recorded and setting a new daily record rainfall for the day. Considering the rainfall since May, the good news is high intensity drought lost its grip by the close of June.
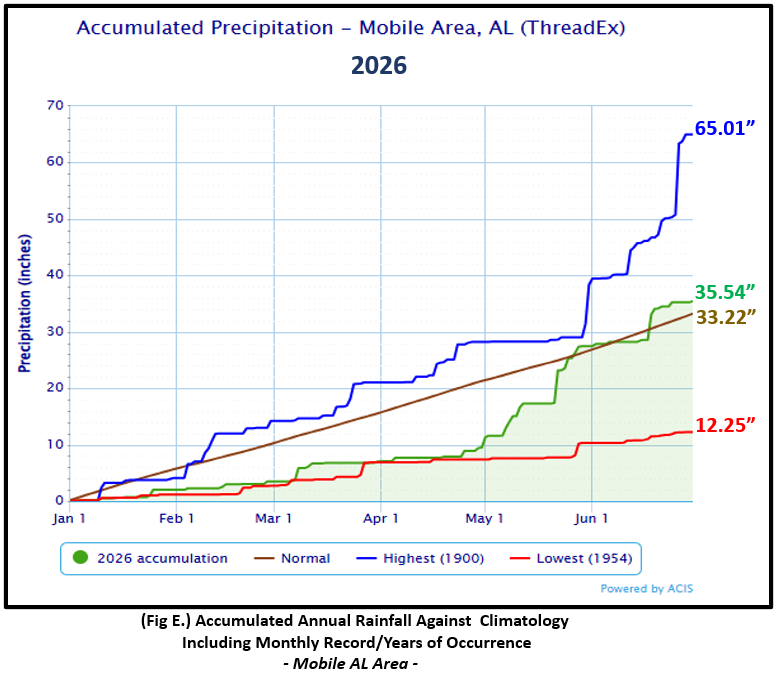
Mobile Alabama Area [Climate Normal Period 1991-2020, Climate Record Period 1872 to Present]- The average monthly high of 89.0° was 0.4° below normal. The average monthly low was 72.0° or 1.2° above normal. The average monthly temperature of 80.5° was 0.4° above normal. The highest temperature for the month was 96° occurring on the 30th which was 6° above the normal for the date. The coolest low temperature, 64°, occurred on the 5th and 5° below normal for the date. No record temperatures were reached. (Fig. A) shows a graphical representation of how the Mobile area temperatures compared to the seasonal normal daily highs and lows, which are shown by the colored dashed lines. Bar graphs reflecting the daily high/low temperature departures from normal are provided in the table below (Figs. B and C). The rain gauge collected 7.96" for the month (Fig. D), 1.41" above normal for June. 56.4% of the monthly rains occurred on the 18th when an excessive rainfall event dropped 4.49" and setting a new one day record rainfall for the day. This smashes the previous record for the date at 2.34" set back in 2004. The annual rainfall total ending June 30th, 35.54", is in surplus at 2.32" above normal to date (Fig. E).
June top records for the month during the Period of Record for the Mobile Area:
Click on the Mobile Alabama area climate graphics below to expand:
|

|

|

|
|
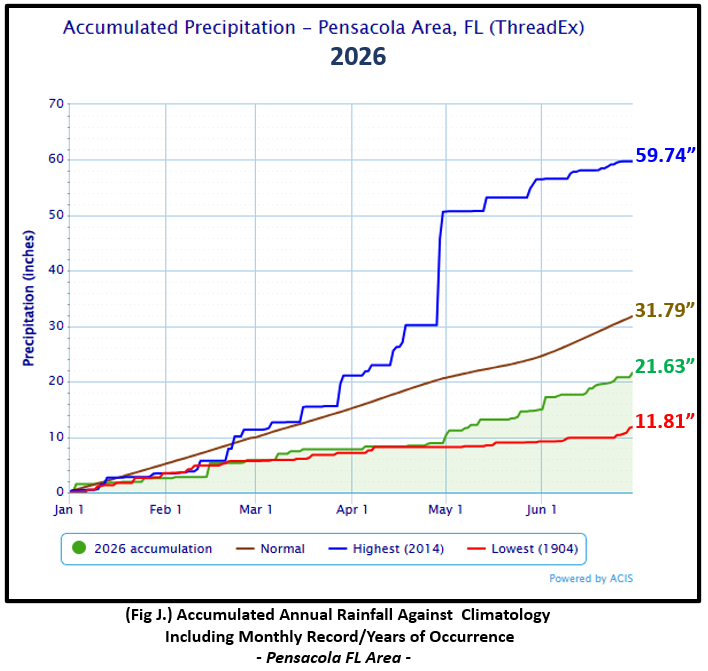
Pensacola Florida Area [Climate Normal Period 1991-2020, Climate Record Period 1879 to Present] - The average monthly high of 88.4° was 1.6° below normal. The average monthly low was 74.1° or 0.6° above normal. The average monthly temperature of 81.2° was 0.5° below normal. The highest temperature for the month was 96° on the 30th and 5° above the normal for the date. The coolest low temperature on the morning of the 5th, 69° was 3° below the normal for the date. No record temperatures were reached. (Fig. F) shows a graphical representation of how the Pensacola area temperatures compared to the seasonal normal daily highs and lows, which are shown by the colored dashed lines. Bar graphs reflecting the daily high/low temperature departures from normal are provided in the table below (Figs. G and H). The rain gauge collected 6.70" for the month or 0.62" below normal. (Fig. I). 32.5% of the monthly rains occurred on the 2nd when heavy rains of 2.18" collected in the gauge and set a new one day record rainfall for the day. This slipped past the previous record for the date, 1.93" set back in 1967.The annual rainfall total ending June 30th stands at a well below normal 21.63", an annual deficit to date at 10.16" (Fig. J).
June top records for the month during the Period of Record for the Pensacola Area:
Click on the Pensacola Florida area climate graphics below to expand:

|

|

|

|
|
Additional June 2026 Climatology and Topics
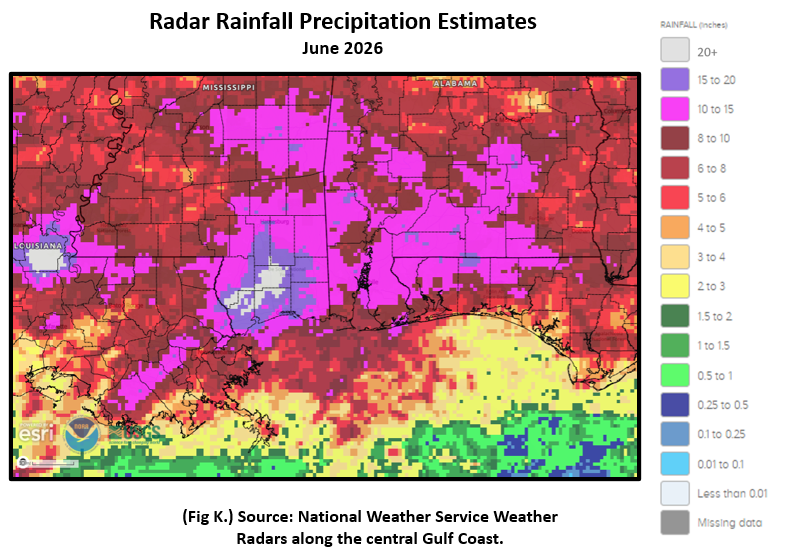
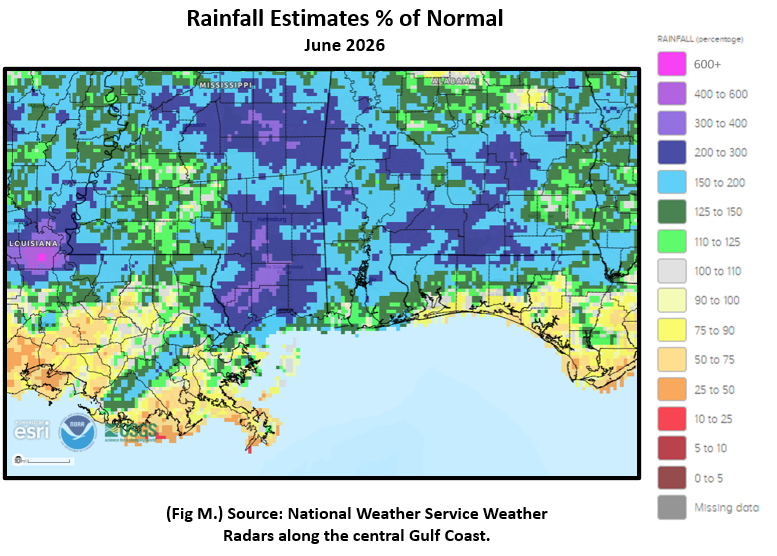
For the second straight month, the Central Gulf Coast was impacted by periods of excessive rain. The area that saw the heaviest of rains was southern MS with Stone Co. MS seeing the gauge swelling to over 20" of rainfall accumulation for the month. Almost a carbon copy of what happened that way in May. The overall surplus of rains was positioned north of the I-10 corridor of three to eight inches above monthly normal. The more widespread hot spot of surplus, well over eight inches, was over southern MS. Within this area, there was a large pocket of 300-400% of normal rains. Much of the remainder of the area north of I-10 at 150-300% of normal June rainfall. It was the northwest Florida Panhandle coast that missed out where monthly deficits against the means were shown. (Fig. K) shows the areal monthly rainfall total, (Fig. L) shows the areal rainfall departures from normal and (Fig. M), the areal percent of normal rainfall. Considering the recent excessive monthly rains since May, high intensity drought that has been with the NWS Mobile's area of responsibility since the Spring months began to lose it's grip by the end of June. (Fig. N)
|

|
|

|
July 2026 Climatology, Seasonal Climatology and Outlooks:
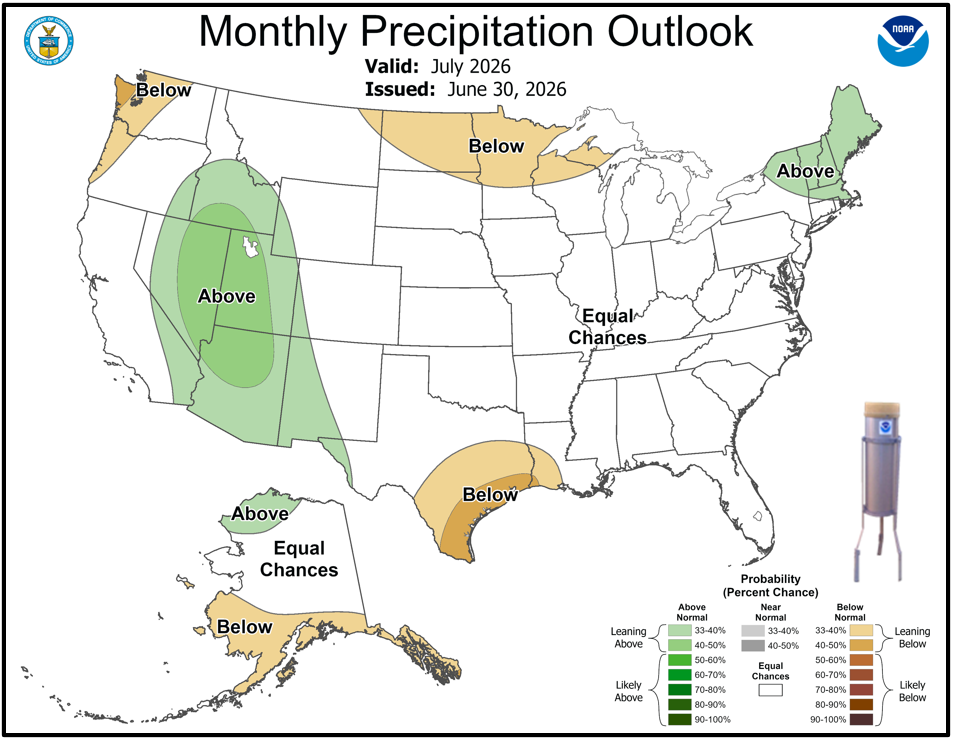
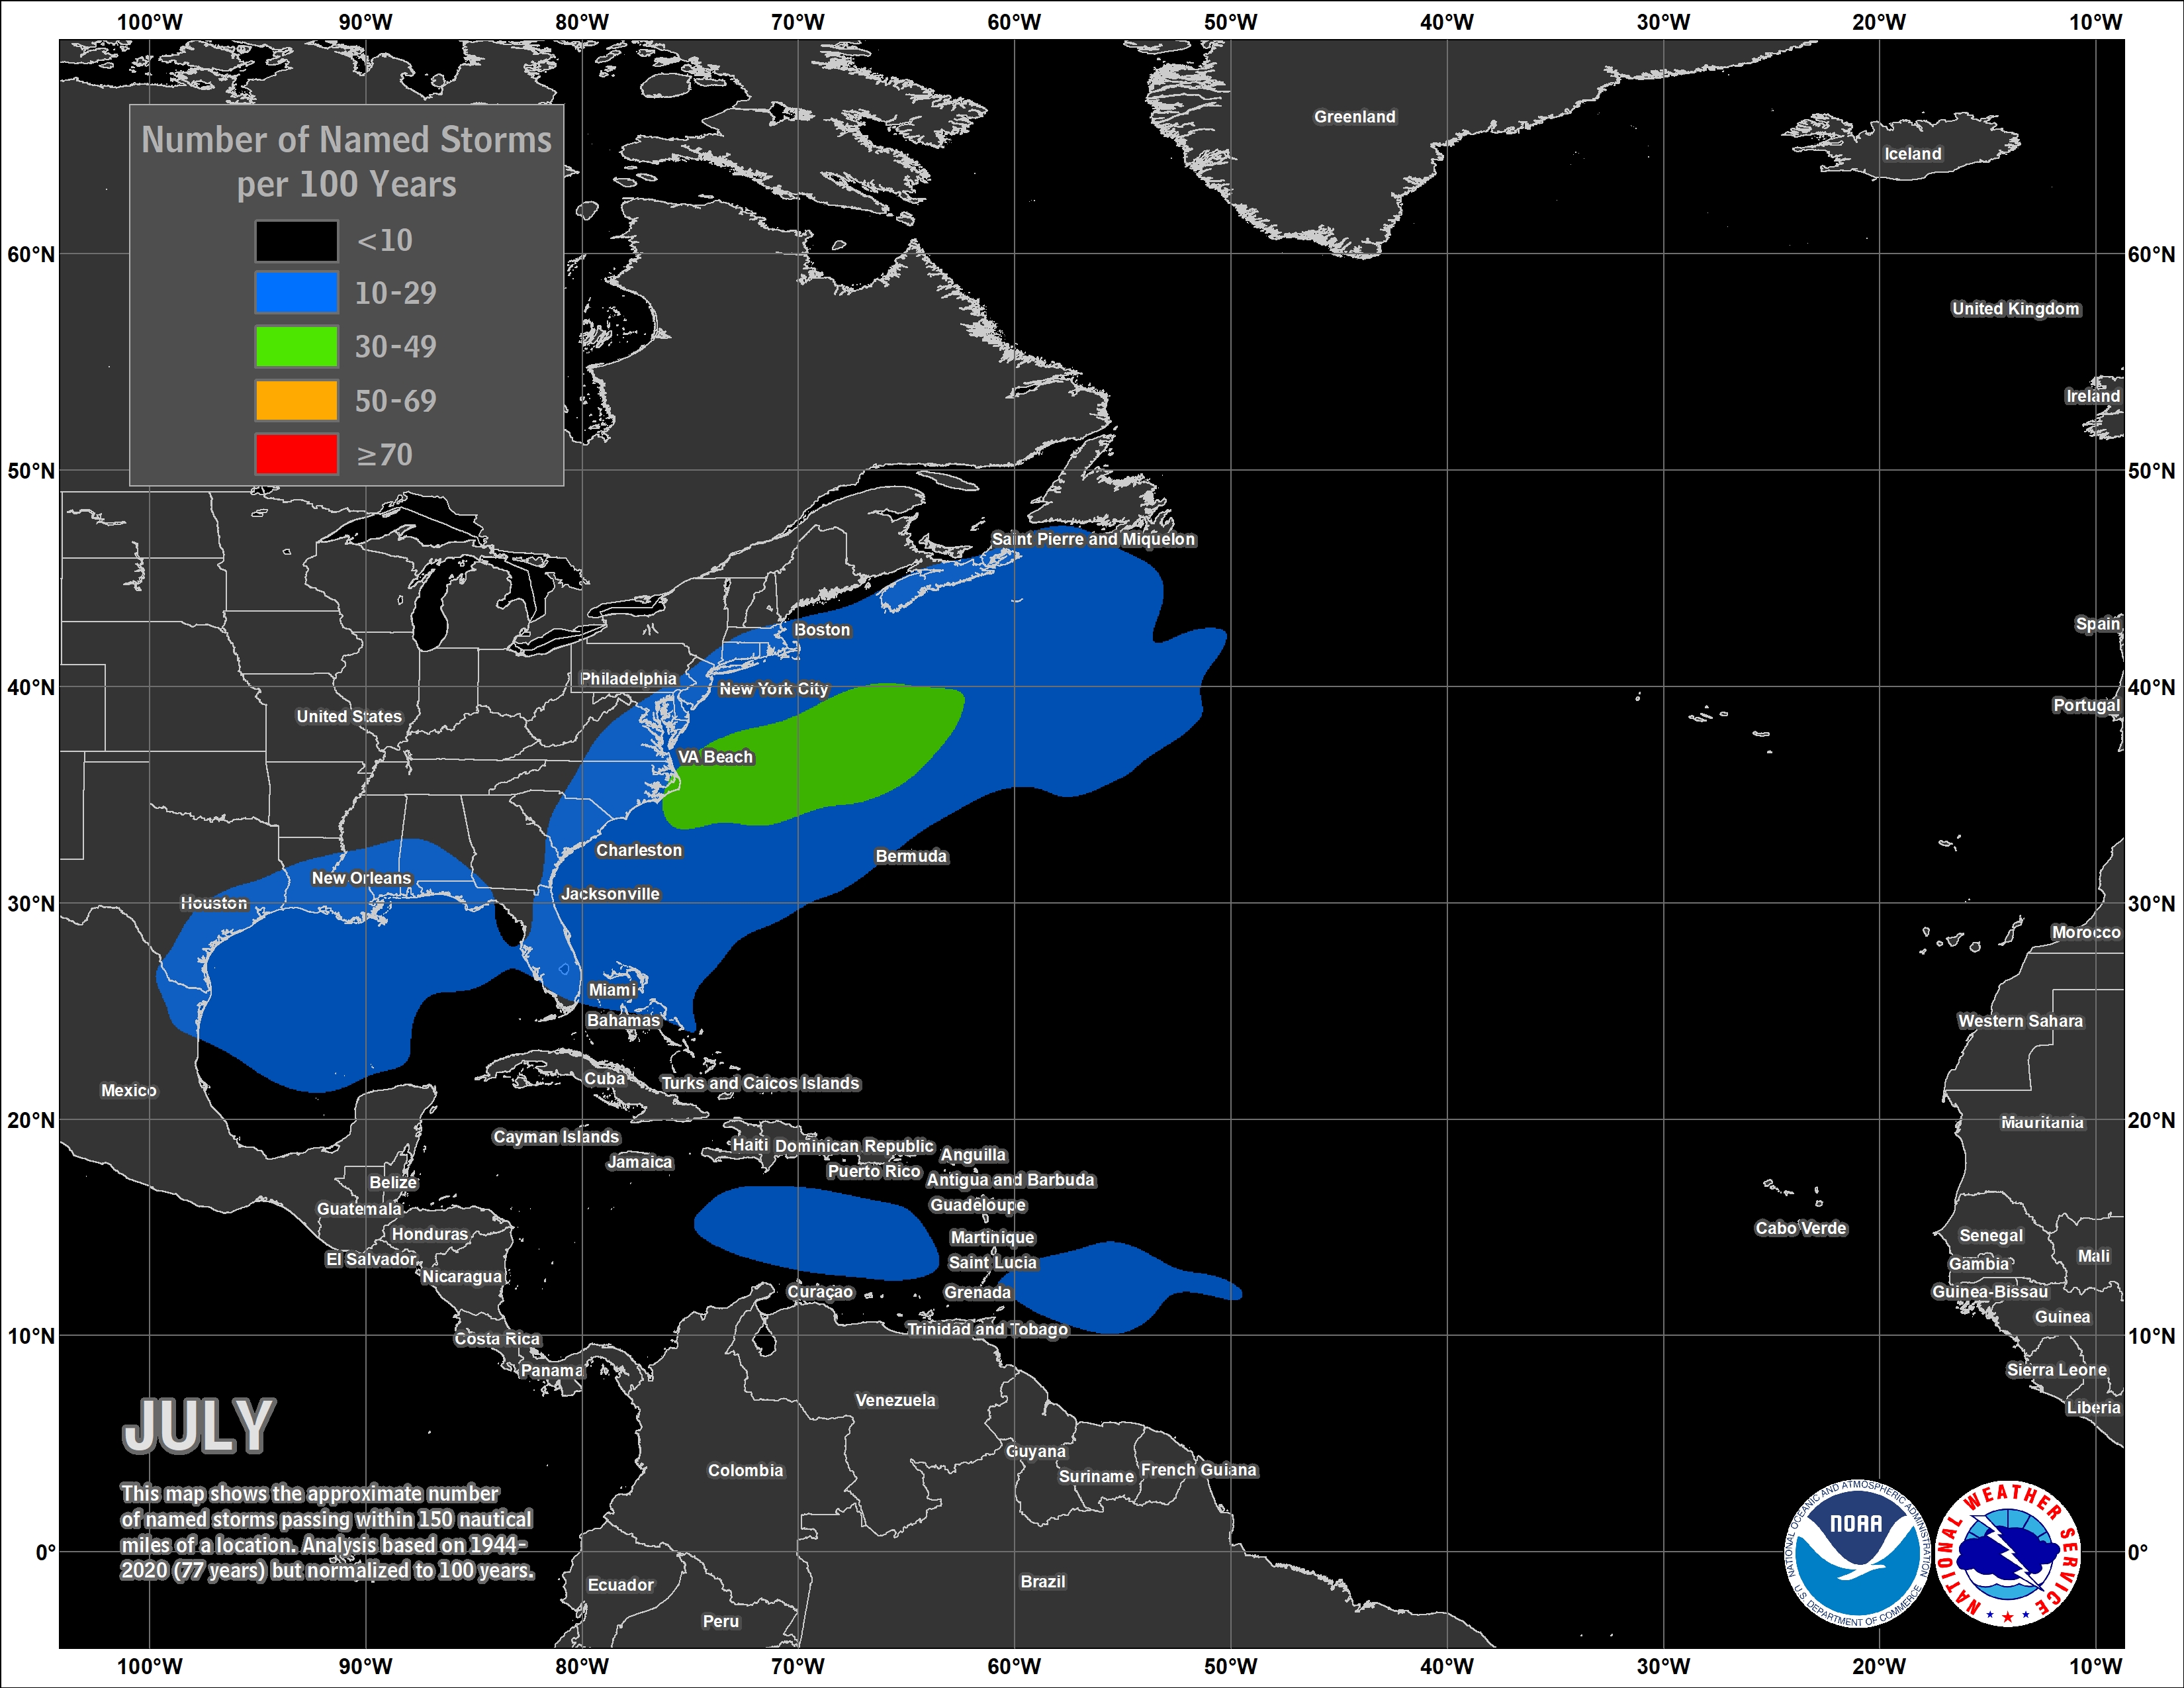
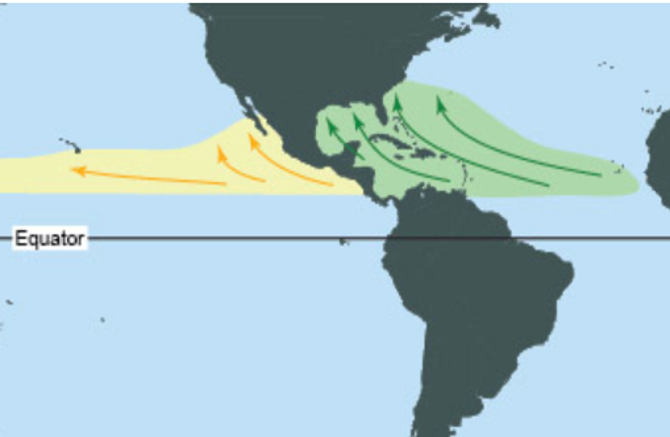
July temperatures are favored to lean above normal at 40 to 50% probability over the local area. Equal chances of above to below normal July rainfall is favored over the Gulf coast region. As we move into the month of July, typical development of tropical cyclones encompasses the Gulf to the western Atlantic, but begins to expand a bit eastward across the Caribbean to the western portions of the southern Atlantic Basin. The 2026 Atlantic Basin Hurricane Season Outlook is provided in the link below. It's highly encouraged to review your hurricane preparedness. Click on the Preparedness Tab on the NWS Mobile Tropical Webpage.
Click on the snap shots below to expand:
 July Normals July Normals |

|
Outlook |

|
|
|
Additional Climate Links:
The National Weather Service Mobile Alabama's Climate and Past Weather page provides climate data at your fingertips for many observation points in the local forecast area by accessing the NOWData tab as well as many other climate resources. The Climate Prediction Center Link provides short and longer range climatic outlooks and education about the larger scale global circulations that impact temperatures and weather. With the large agriculture and farming presence along the central Gulf coast, the Drought Monitor link provides updates on drought trends and impacts. Another very helpful resource is the Community Collaborative Rain Hail and Snow (CoCoRaHS) network, which is a large group of volunteers working together to measure and map precipitation (rain, hail, and snow). The aim of CoCoRaHS is to provide the highest quality data for natural resource, education and research applications. You can be a part of the CoCoRaHS team by becoming a volunteer rainfall observer.


