March 2024 Climate Summaries
Mobile Alabama and Pensacola Florida Area
National Weather Service Mobile Alabama
April 2, 2024
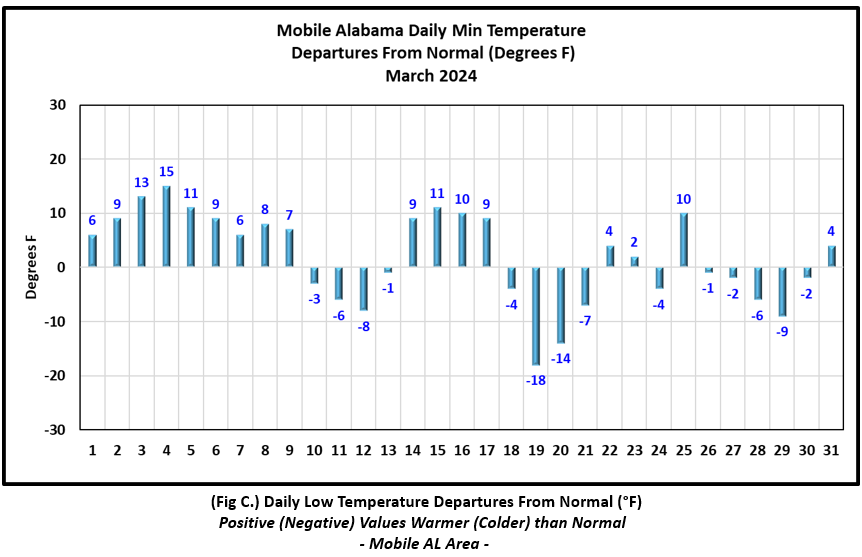
March 2024 in Review - Mobile saw a couple of peaks in daily high temperatures well above the climatic mean during the first half of the month. Outside of a few nights where lows dipped to below normal, night-time minimums were mostly above normal the first half of the month, averaging 6.2° above normal March 1st to the 17th. Following, overnight lows trended lower for much of the remainder of the month, averaging 3.4° below seasonal normals. A reinforcing shot of colder air filtered in on the 19th and 20th with overnight lows dipping down into the mid 30's, averaging 16° below normal these mornings.
Pensacola's average monthly high temperature of 72° was right on top of the normal. Overnight minimums saw the largest swings about the means with the warmest stretch coming the first nine days of the month averaging 8.1° above normal. A cold frontal passage on Saturday March 9th, sent lows downward to below normal. A reinforcing shot of colder air filtered in on the 19th and 20th with overnight lows averaging 14° below normal these mornings.
No record temperatures were reached or broken at Mobile and Pensacola.
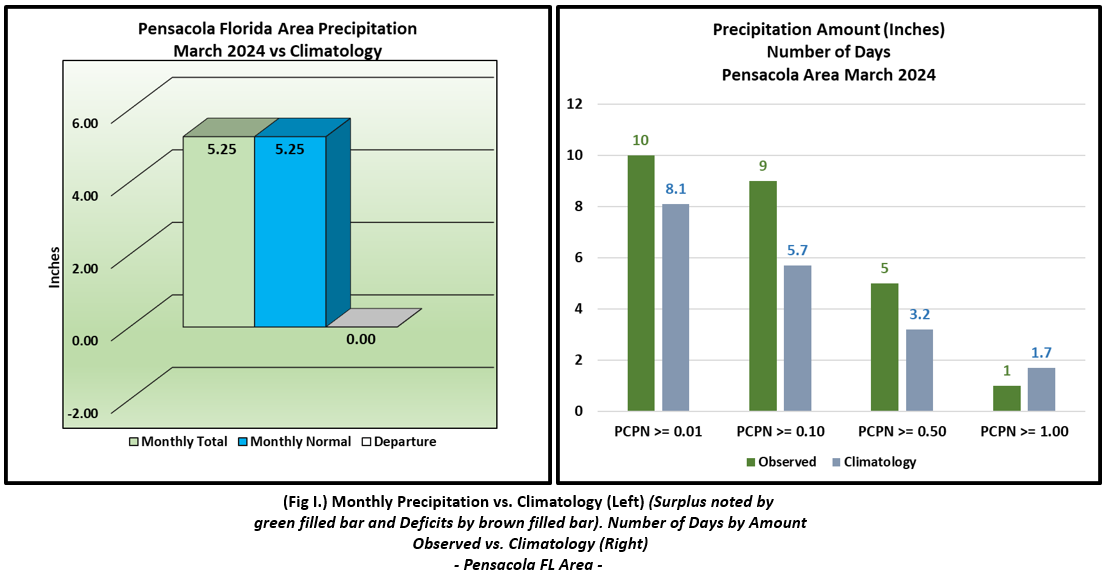
Monthly precipitation was very close to normal at Mobile. Pensacola's gauge reading of 5.25" was right on top of monthly average.
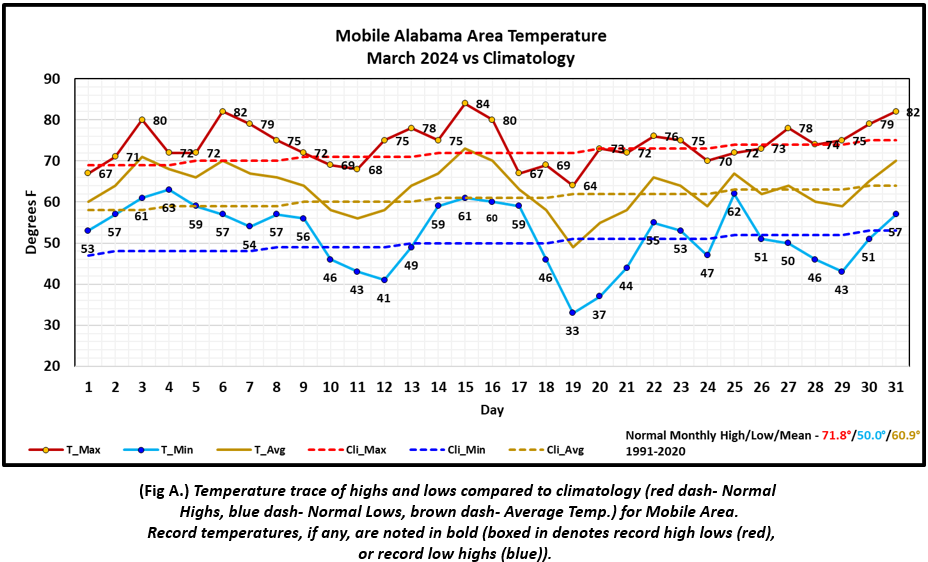
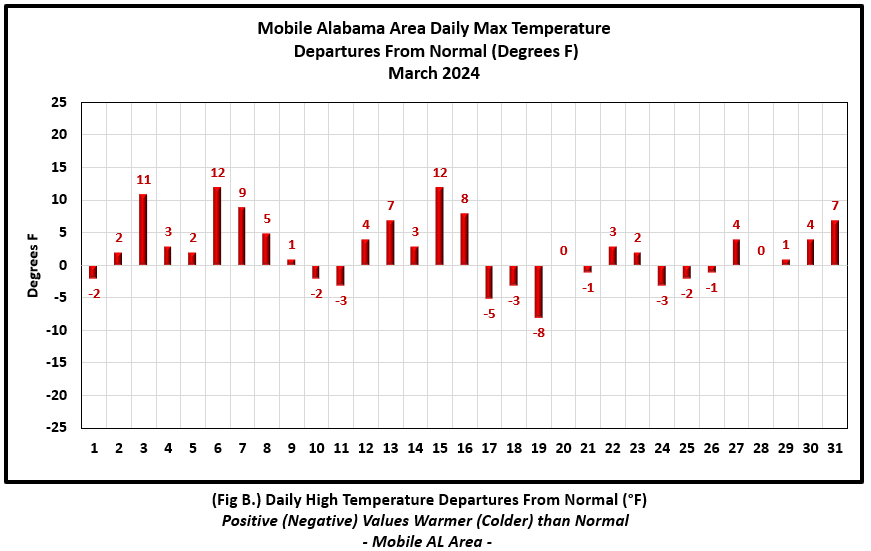
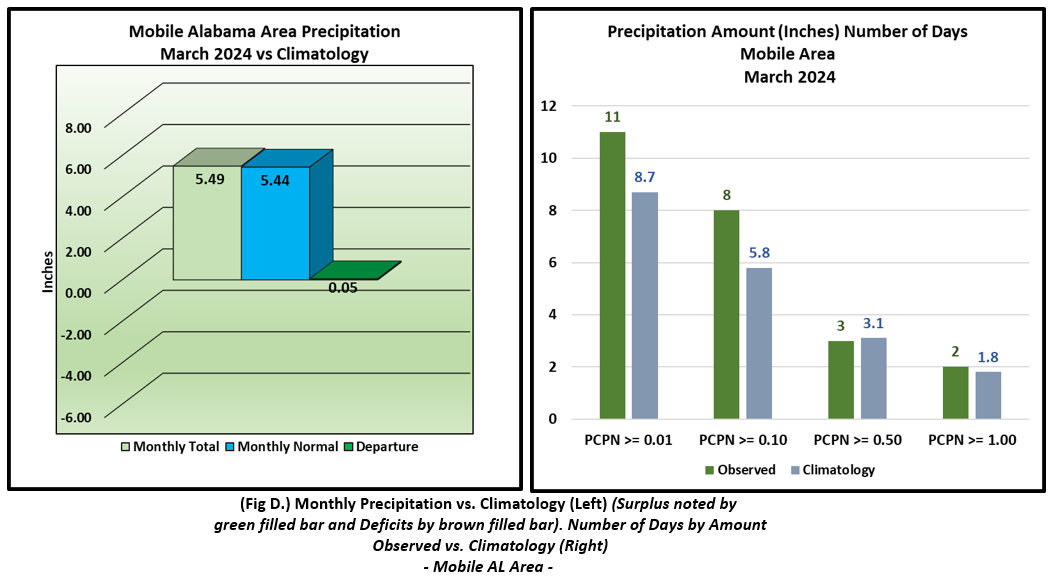
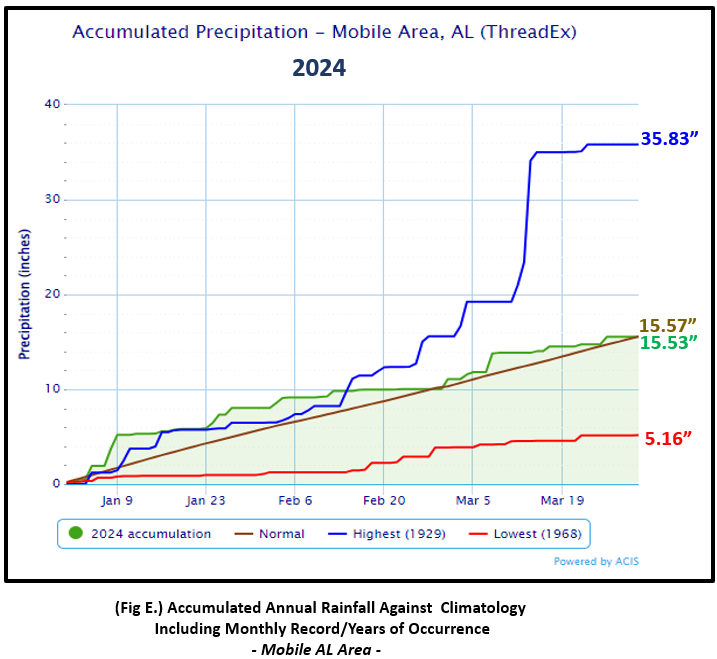
Mobile Alabama Area [Climate Normal Period 1991-2020, Climate Record Period 1872 to Present]- The average monthly high of 74.1° was 2.3° above normal. The average monthly low was 51.9° or 1.9° above normal. The average monthly temperature of 63.0° was 2.1° above normal. The highest temperature for the month, 84°, occurring on the 15th, was 12° above the normal for the date. The lowest temperature for the month dipped to 33° on the morning of the 19th, 18° below normal for this date. (Fig. A) shows a graphical representation of how the Mobile area temperatures compared to the seasonal normal daily highs and lows, which are shown by the colored dashed lines. Bar graphs reflecting the daily high/low temperature departures from normal are provided in the table below (Figs. B and C). The rain gauge collected 5.49" (Fig. D), or just a hair north of the monthly average of 5.44". Mobile did receive one day where a new excessive daily rainfall record was reached and that was on the 8th when 1.96" fell. The previous one day record on this date was 1.75" way back in 1919. Accumulated rainfall climatology at 15.53" for Mobile is very close to normal ending the month of March (Fig. E).
March Top Records for the Month During the Period of Record for the Mobile Area:
Click on the Mobile Alabama area climate graphics below to expand:
|
|
|
|
|
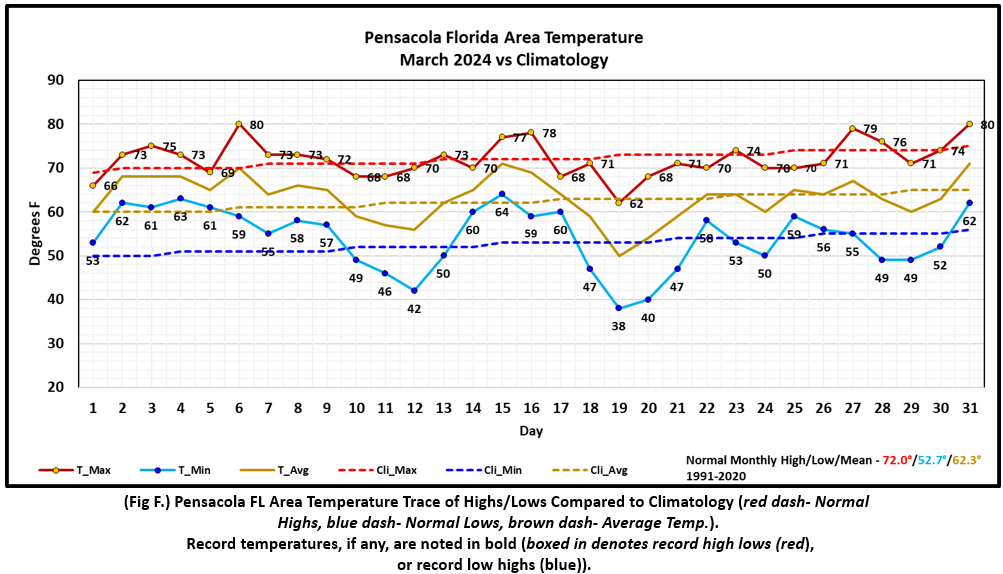
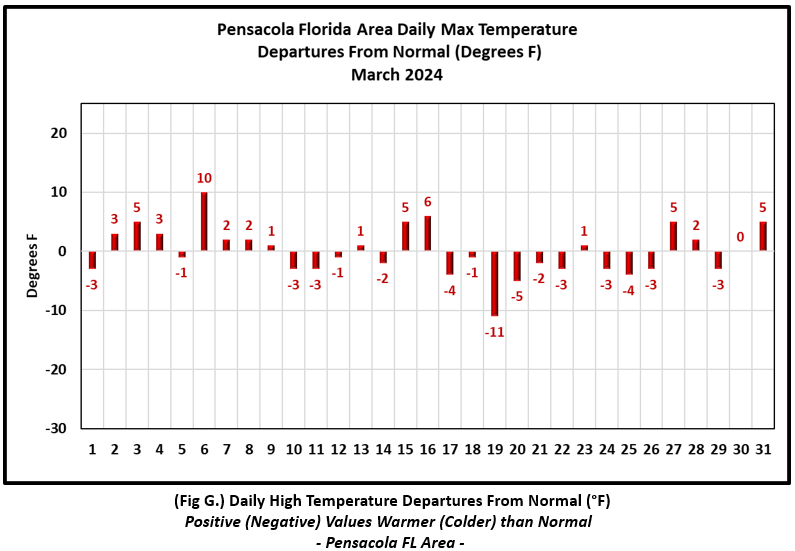
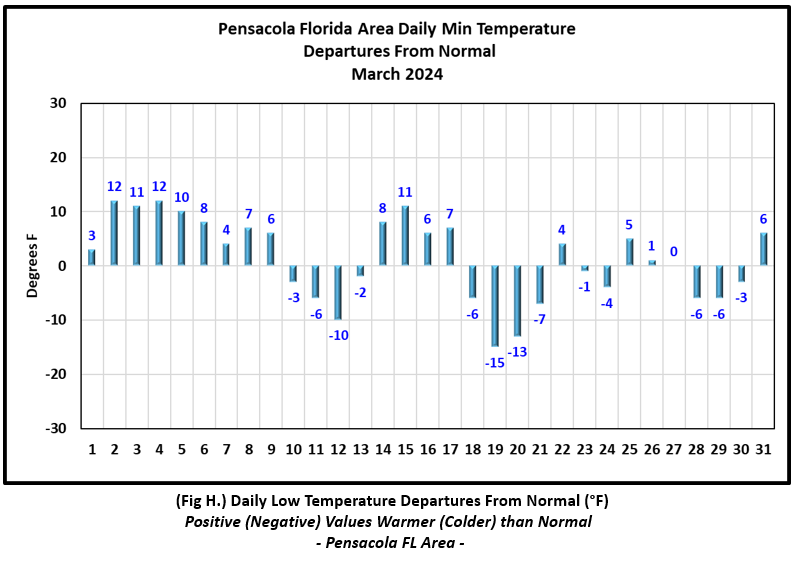
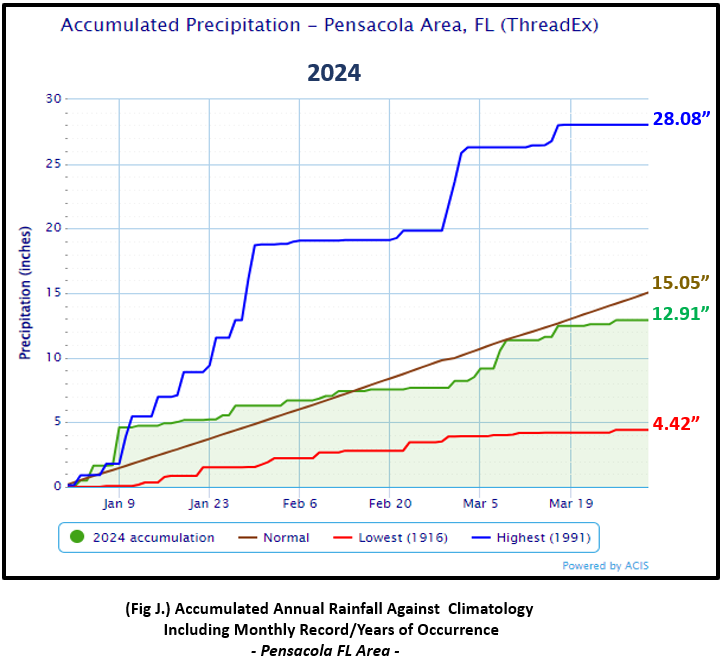
Pensacola Florida Area [Climate Normal Period 1991-2020, Climate Record Period 1879 to Present] - The average monthly high of 72.0° was normal. The average monthly low of 54.0° was 1.3° above normal. The average monthly temperature of 63.0° was 0.7° above normal. The highest temperature for the month, 80°, occurring on both the 6th and 31st, 10° above normal for the 6th and 5° above normal for the 31st. The lowest temperature for the month dipped to 38° on the morning of the 19th, 15° below normal for this date. (Fig. F) shows a graphical representation of how the Pensacola area temperatures compared to the seasonal normal daily highs and lows, which are shown by the colored dashed lines. (Figs. G and H) shows the daily high/low temperature departures from normal. The rain gauge collected 5.25" (Fig. I), or normal rainfall for the month of March. Accumulated rainfall climatology is in a deficit by 2.14" for Pensacola thus far to close out March (Fig. J).
March Top Records for the Month During the Period of Record for the Pensacola Area:
Click on the Pensacola Florida area climate graphics below to expand:
|
|
|
|
|
Additional March 2024 Climatology and Topics
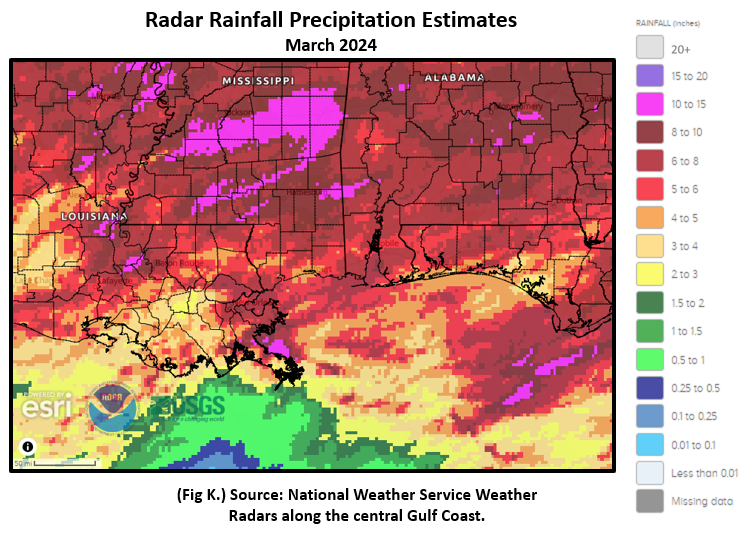
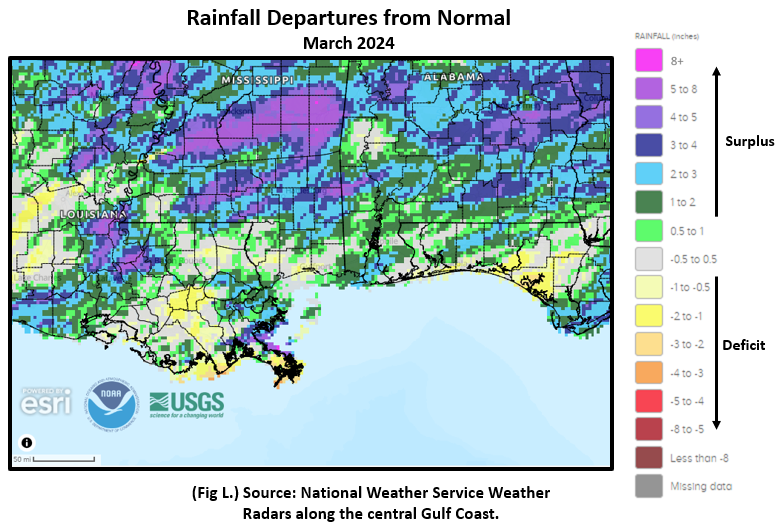
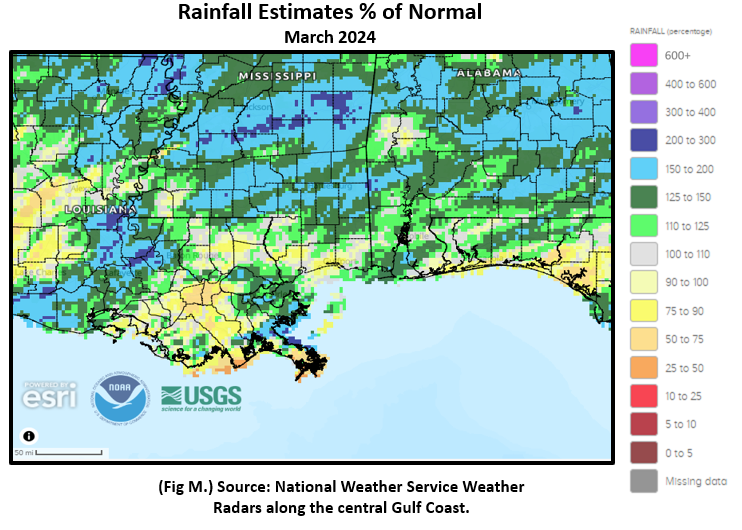
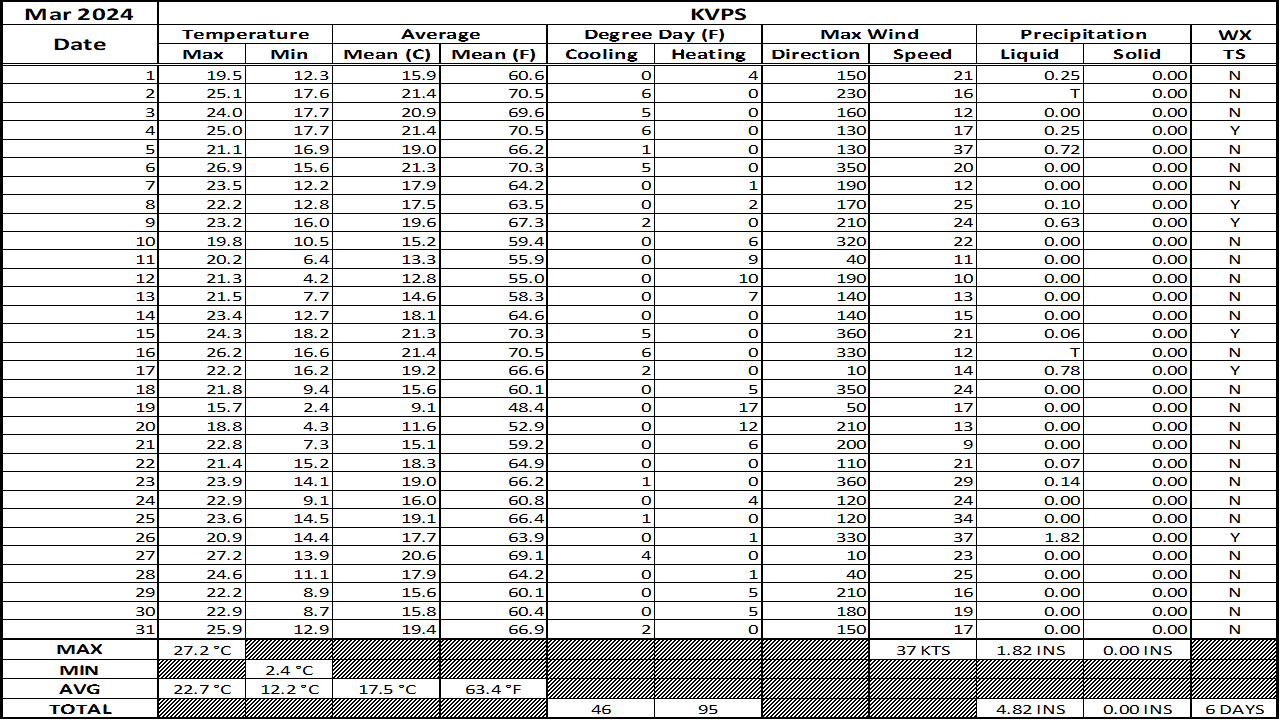
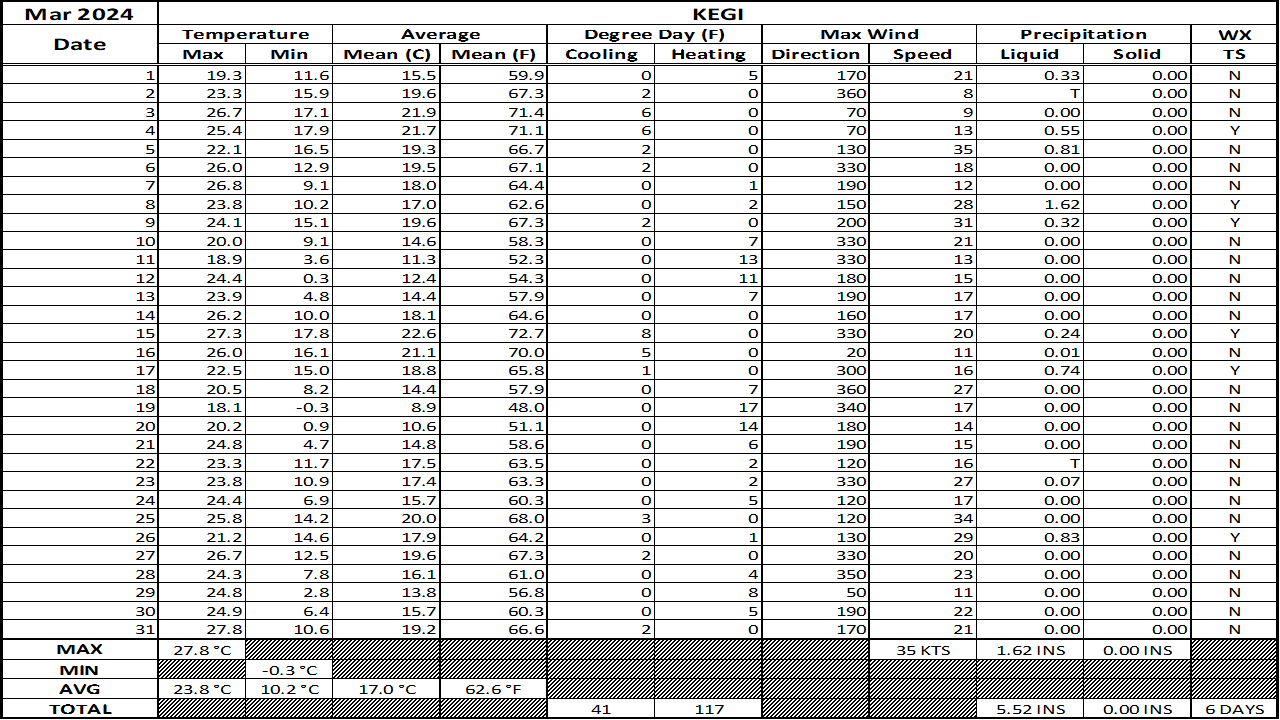
Most of the area looks to have received between 5 to 9 inches of rain during the month. A few pockets of locally higher amounts were focused over the interior of southeast MS into Washington Co. AL. A large swath of over 125% of normal rainfall was shown over the heart of the forecast area and another batch closer to the I-10 corridor. Fig. K shows the areal monthly rainfall total, Fig. L shows the areal rainfall departures from normal and Fig. M, the areal percent of normal rainfall. The latest March 2024 monthly summary for Eglin Air Force Base (AFB) - KVPS and Duke Field - KEGI has been received and provided in the tables below. The temperatures in the daily tables consists of numbers both in °F/°C. Data courtesy of Mr. David Biggar, Staff Meteorologist, 96th Weather Squadron. Provided by permission.
|
|
|
|
|
|
April 2024 Climatology, Seasonal Climatology and Outlooks:
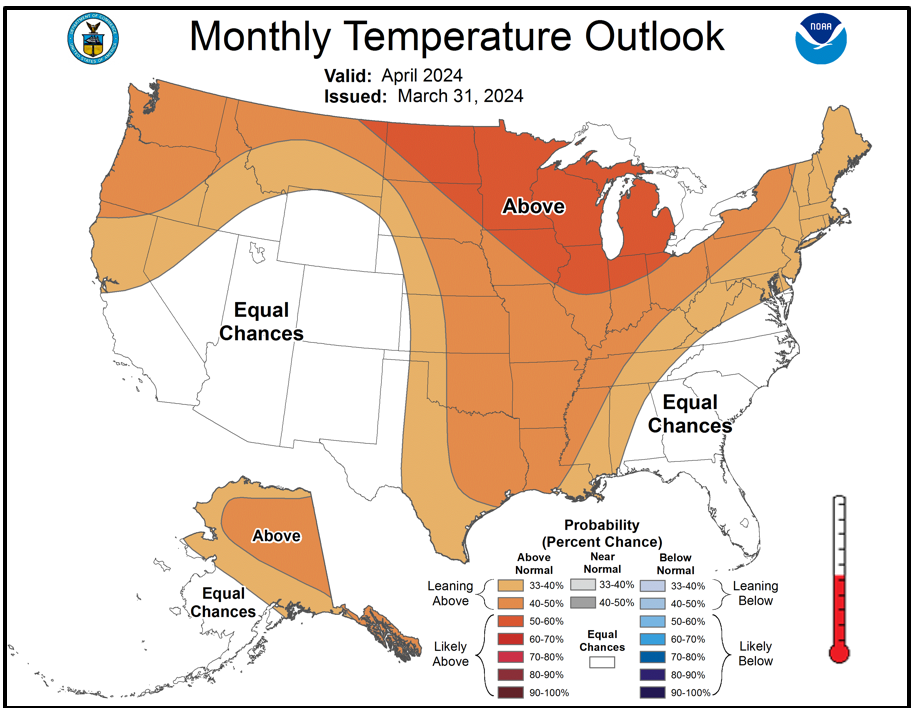
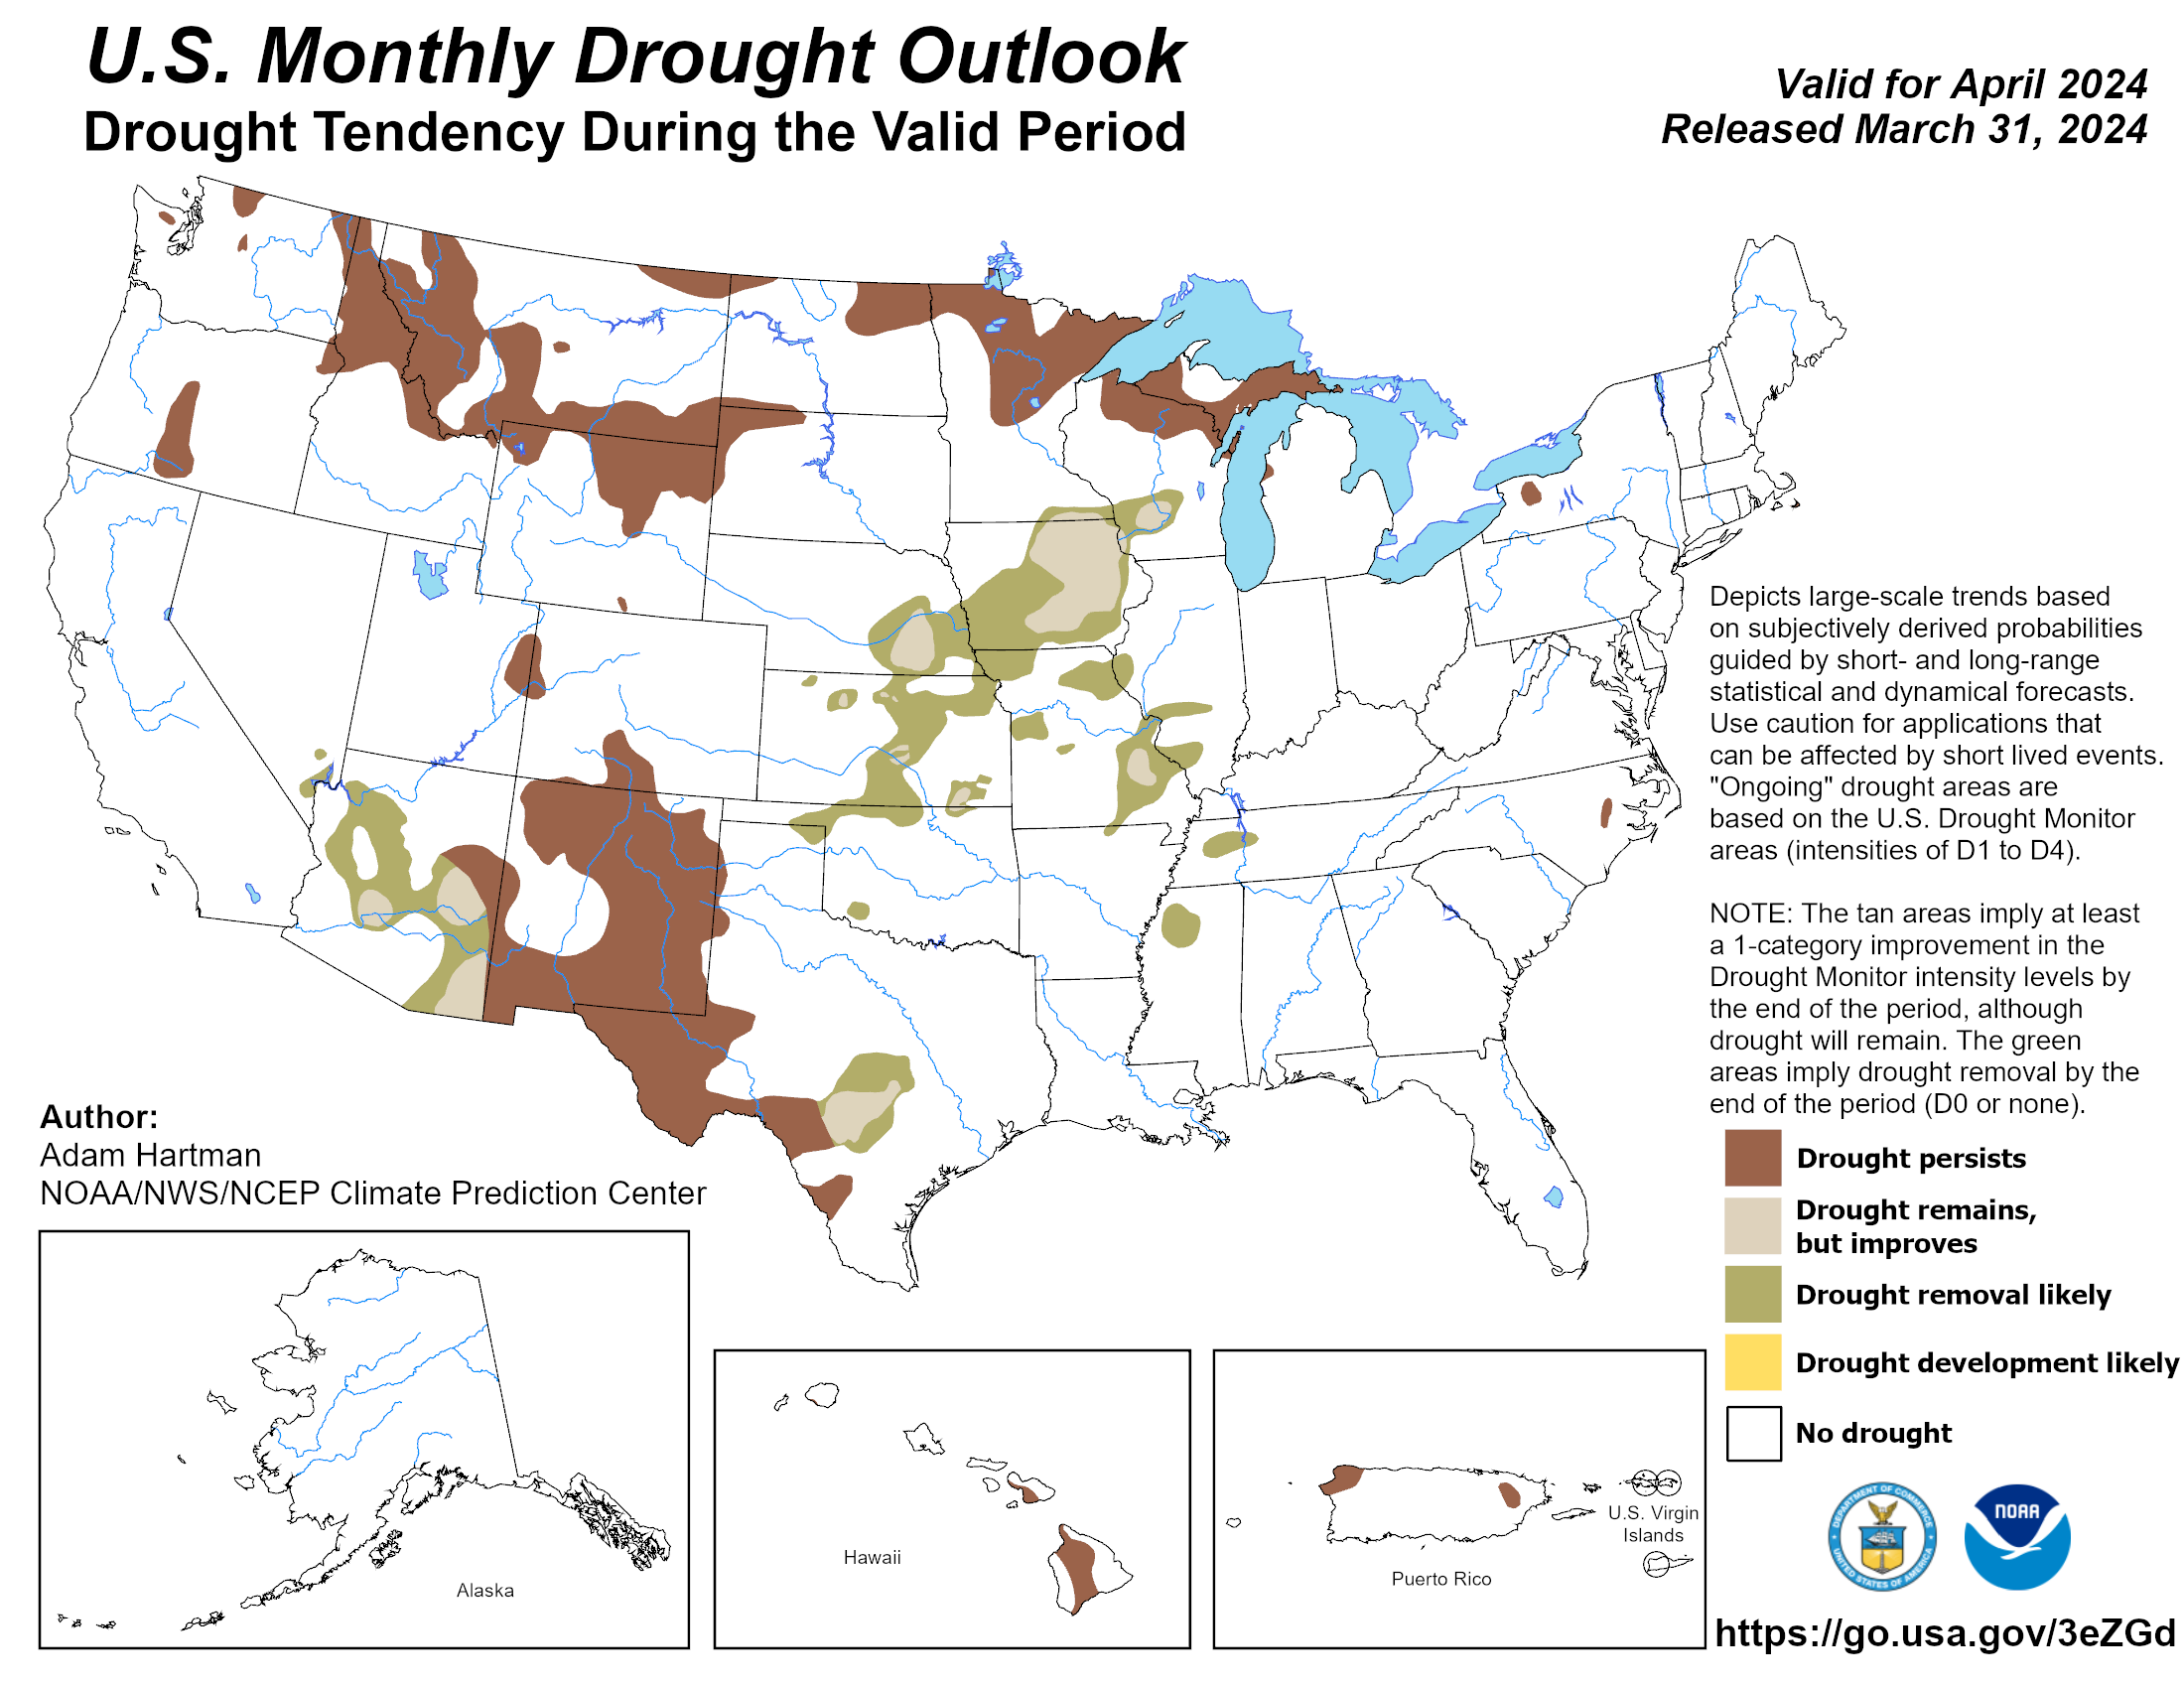
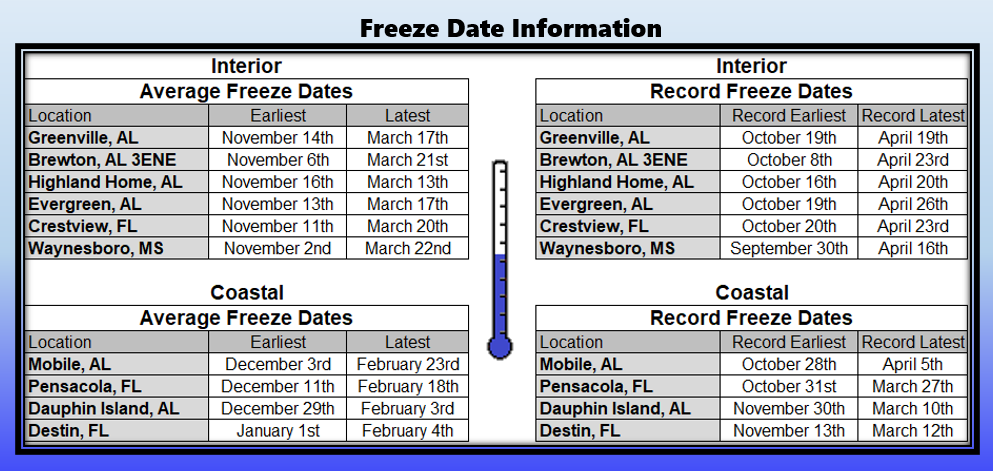
The latest outlook for April favors temperatures to lean above normal mostly along and west of the MS and OH River Valleys. Equal chances of above or below normal temperatures are favored over the southeast US. Precipitation is favored to lean above normal for April over the deep south. Although we are typically well past the normal last freeze, the climate period of record tells us we can still get a freeze well into the month of April. Considering this, gardeners and commercial growers should be prepared to cover up tender garden vegetables if a threat of freezing temperatures materializes. April looks drought free. Take note: The National Weather Service text-based drought statement has officially transitioned to a modernized version effective April 1st. Please refer to the Service Change Notice 24-27 regarding these changes.
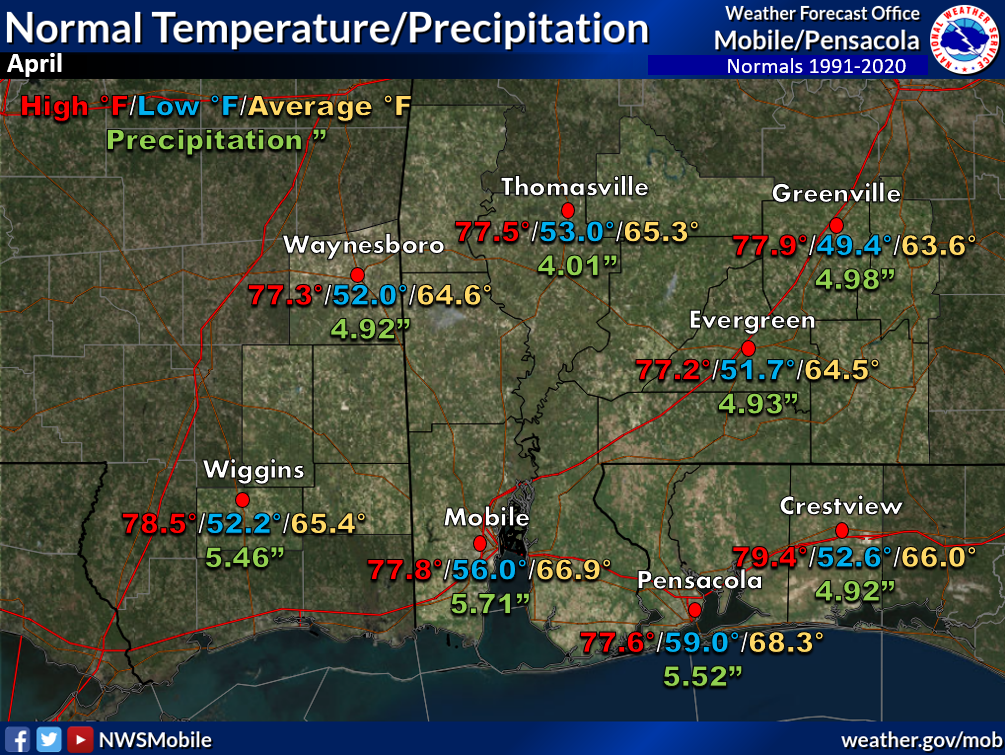 April Normals April Normals |
|
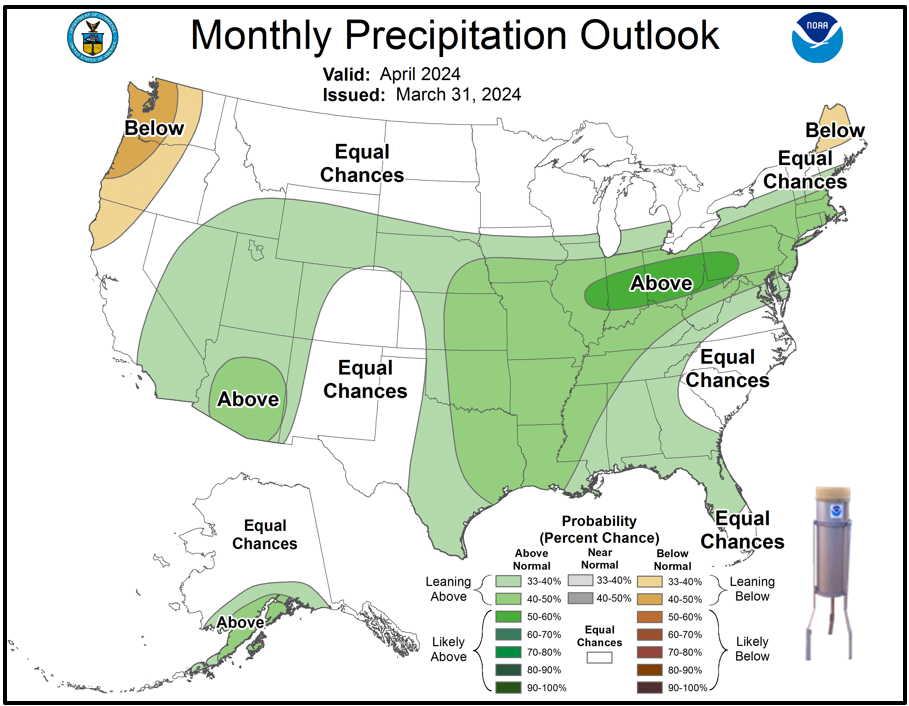
Outlook |
|
|
Additional Climate Links:
The National Weather Service Mobile Alabama's Climate and Past Weather page provides climate data at your fingertips for many observation points in the local forecast area by accessing the NOWData tab as well as many other climate resources. The Climate Prediction Center Link provides short and longer range climatic outlooks and education about the larger scale global circulations that impact temperatures and weather. With the large agriculture and farming presence along the central Gulf coast, the Drought Monitor link provides updates on drought trends and impacts. Another very helpful resource is the Community Collaborative Rain Hail and Snow (CoCoRaHS) network, which is a large group of volunteers working together to measure and map precipitation (rain, hail, and snow). The aim of CoCoRaHS is to provide the highest quality data for natural resource, education and research applications. You can be a part of the CoCoRaHS team by becoming a volunteer rainfall observer.