May 2026 Climate Summaries
Mobile Alabama and Pensacola Florida Area
National Weather Service Mobile Alabama
June 1, 2026
May 2026 in Review - May opened up on the cool side. For high temperatures, Mobile averaged 7.5° below normal the first nine days, while Pensacola averaged 6.1° below normal. During this period, Mobile set a couple of record low high temperatures, one on the 1st and the other on the 9th. The coolest period for the month was the first five days where lows averaged 10.2° below normal at Mobile and 9.8° below normal at Pensacola. During this span, both Mobile and Pensacola saw one record cold morning on the 3rd. Following, daily highs much of the remainder of the month of May hovered below normal. Overnight lows trended above seasonal normals much of the remainder of the month, outside of a brief period during the middle of May were lows dipped below normal. Overall, the average monthly highs were a few degrees below normal and the lows were near normal.
The weather story shifted from that of several dry chapters and emerging, intensifying drought over the recent months to May being a wet chapter. The spigot was fully open with the rain gauge at Mobile capturing an astounding near 18" of rainfall while at the same time setting a new all time monthly rainfall for May. Nearly a third of the monthly rainfall occurred in a day's time at Mobile when nearly a half foot of record daily rainfall fell on the 22nd. Pensacola's monthly rain was a half foot. Both sites saw above normal rainy days at or greater than 0.01", 0.10", 0.50", and 1.00" of rainfall.
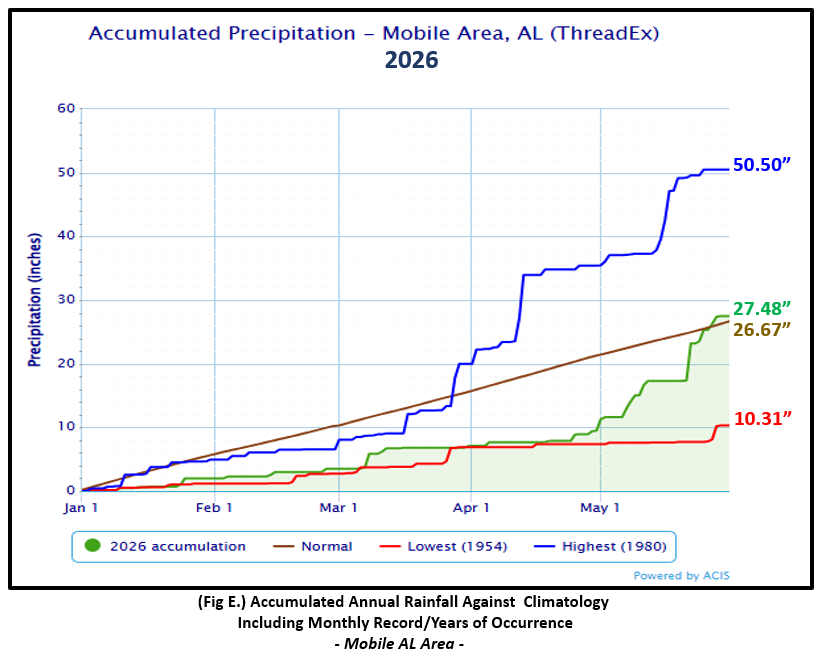
Mobile Alabama Area [Climate Normal Period 1991-2020, Climate Record Period 1872 to Present]- The average monthly high of 82.0° was 2.9° below normal. The average monthly low was 64.2° or 0.4° above normal. The average monthly temperature of 73.1° was 1.3° below normal. The highest temperature for the month of 91° occurred on the final day of the month, just 3° above normal for the date. There were two record low high temperatures. 66° on the 1st broke the pervious record on this date of 67° set way back in 1909. The other was 68° on the 9th matching the previous record on this date set way back in 1903. The lowest temperature for the month was a cold 43° on the morning of the 3rd, 17° below normal for the date. This low not only broke the previous record low for the date of 47° set in 2004, it also tied for the all-time coldest daily low temperature in May with the 4th in 2013 and the 13th in 1960. (Fig. A) shows a bar graphical representation of how the Mobile area daily temperatures compared to the seasonal normal daily highs and lows. The extremes are also shown. Bar graphs reflecting the daily high/low temperature departures from normal are provided in the table below (Figs. B and C). Excessive rainfall caused the rain gauge to swell to 17.99" (Fig. D), or 12.60" above normal. This amount easily overtook the previous wettest May on record of 15.08" in 1980. 32% of the monthly rainfall total fell in a one day's time when 5.78" was measured on the 22nd, setting a new daily record rainfall for the day. The previous record for the date was 3.80" in 1965. Annual rainfall to date in Mobile has moved into plus category by 0.81" above normal. (Fig. E).
May Top Records for the Month During the Period of Record for the Mobile Area:
Click on the Mobile Alabama area climate graphics below to expand:

|

|

|

|
|
Pensacola Florida Area [Climate Normal Period 1991-2020, Climate Record Period 1879 to Present] - The average monthly high of 81.9° was 3.2° below normal. The average monthly low of 66.9° was right at normal. The average monthly temperature of 74.4° was 1.6° below normal. The highest temperature for the month, 89°, occurred on the 31st was just a 1° above normal for the date. The lowest temperature was a crisp 48° on the morning of the 3rd and 15° below normal for the date. This low tied the previous record low for the date set way back in 1921. (Fig. F) shows a bar graphical representation of how the Pensacola area daily temperatures compared to the seasonal normal daily highs and lows. The extremes are also shown. Bar graphs reflecting the daily high/low temperature departures from normal are provided in the table below (Figs. G and H). Rainfall for May totaled 6.01" (Fig. I), or 2.11" above normal. Although beneficial rains came in May, annual rainfall remains in deficit by 9.54" below normal for the Pensacola area to date (Fig. J).
May Top Records for the Month During the Period of Record for the Pensacola Area:
Click on the Pensacola Florida area climate graphics below to expand:

|

|

|

|

|
Additional May 2026 Climatology and Topics
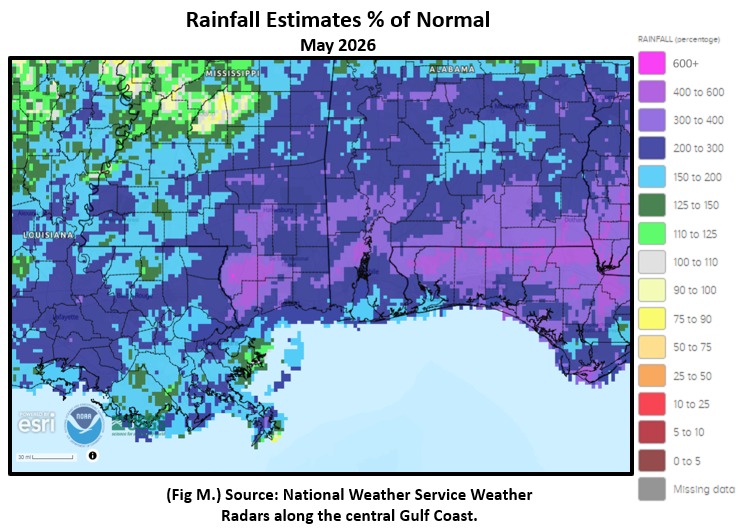
It was an exceedingly wet month over the central Gulf coast. Much of the local area saw more than 10" inches of monthly rainfall. There were a few pockets where rains exceeded an astounding 20". Needless to say, the entire area saw above normal rainfall with a large footprint of 300 to 600% of normal monthly rainfall. (Fig. K) shows the areal monthly rainfall total, (Fig. L) shows the areal rainfall departures from normal and (Fig. M), the areal percent of normal rainfall. Above normal rains for May has definitely brought an improvement in drought (Fig. P) but regardless, drought is still in place. Hard to believe, but there are several factors that go into drought decision making with rainfall being one. Considering though that this drought event developed over the longer term, it will still take some time to see more improvements but it appears we are headed in the right direction.

|

|
|

|
June 2026 Climatology, Seasonal Climatology and Outlooks:
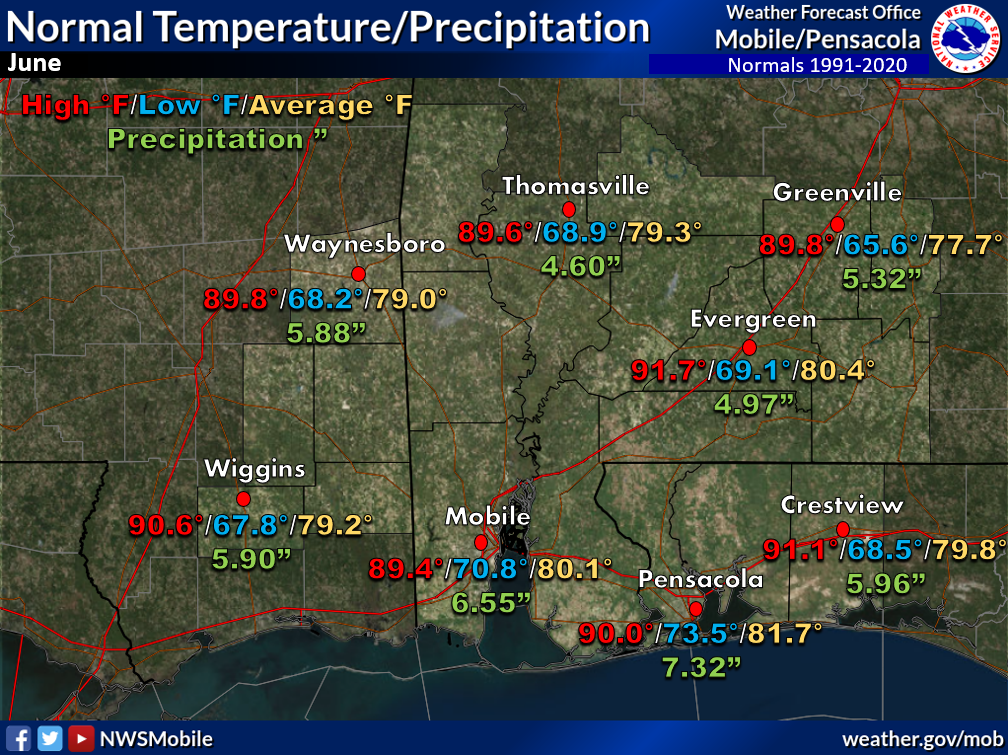
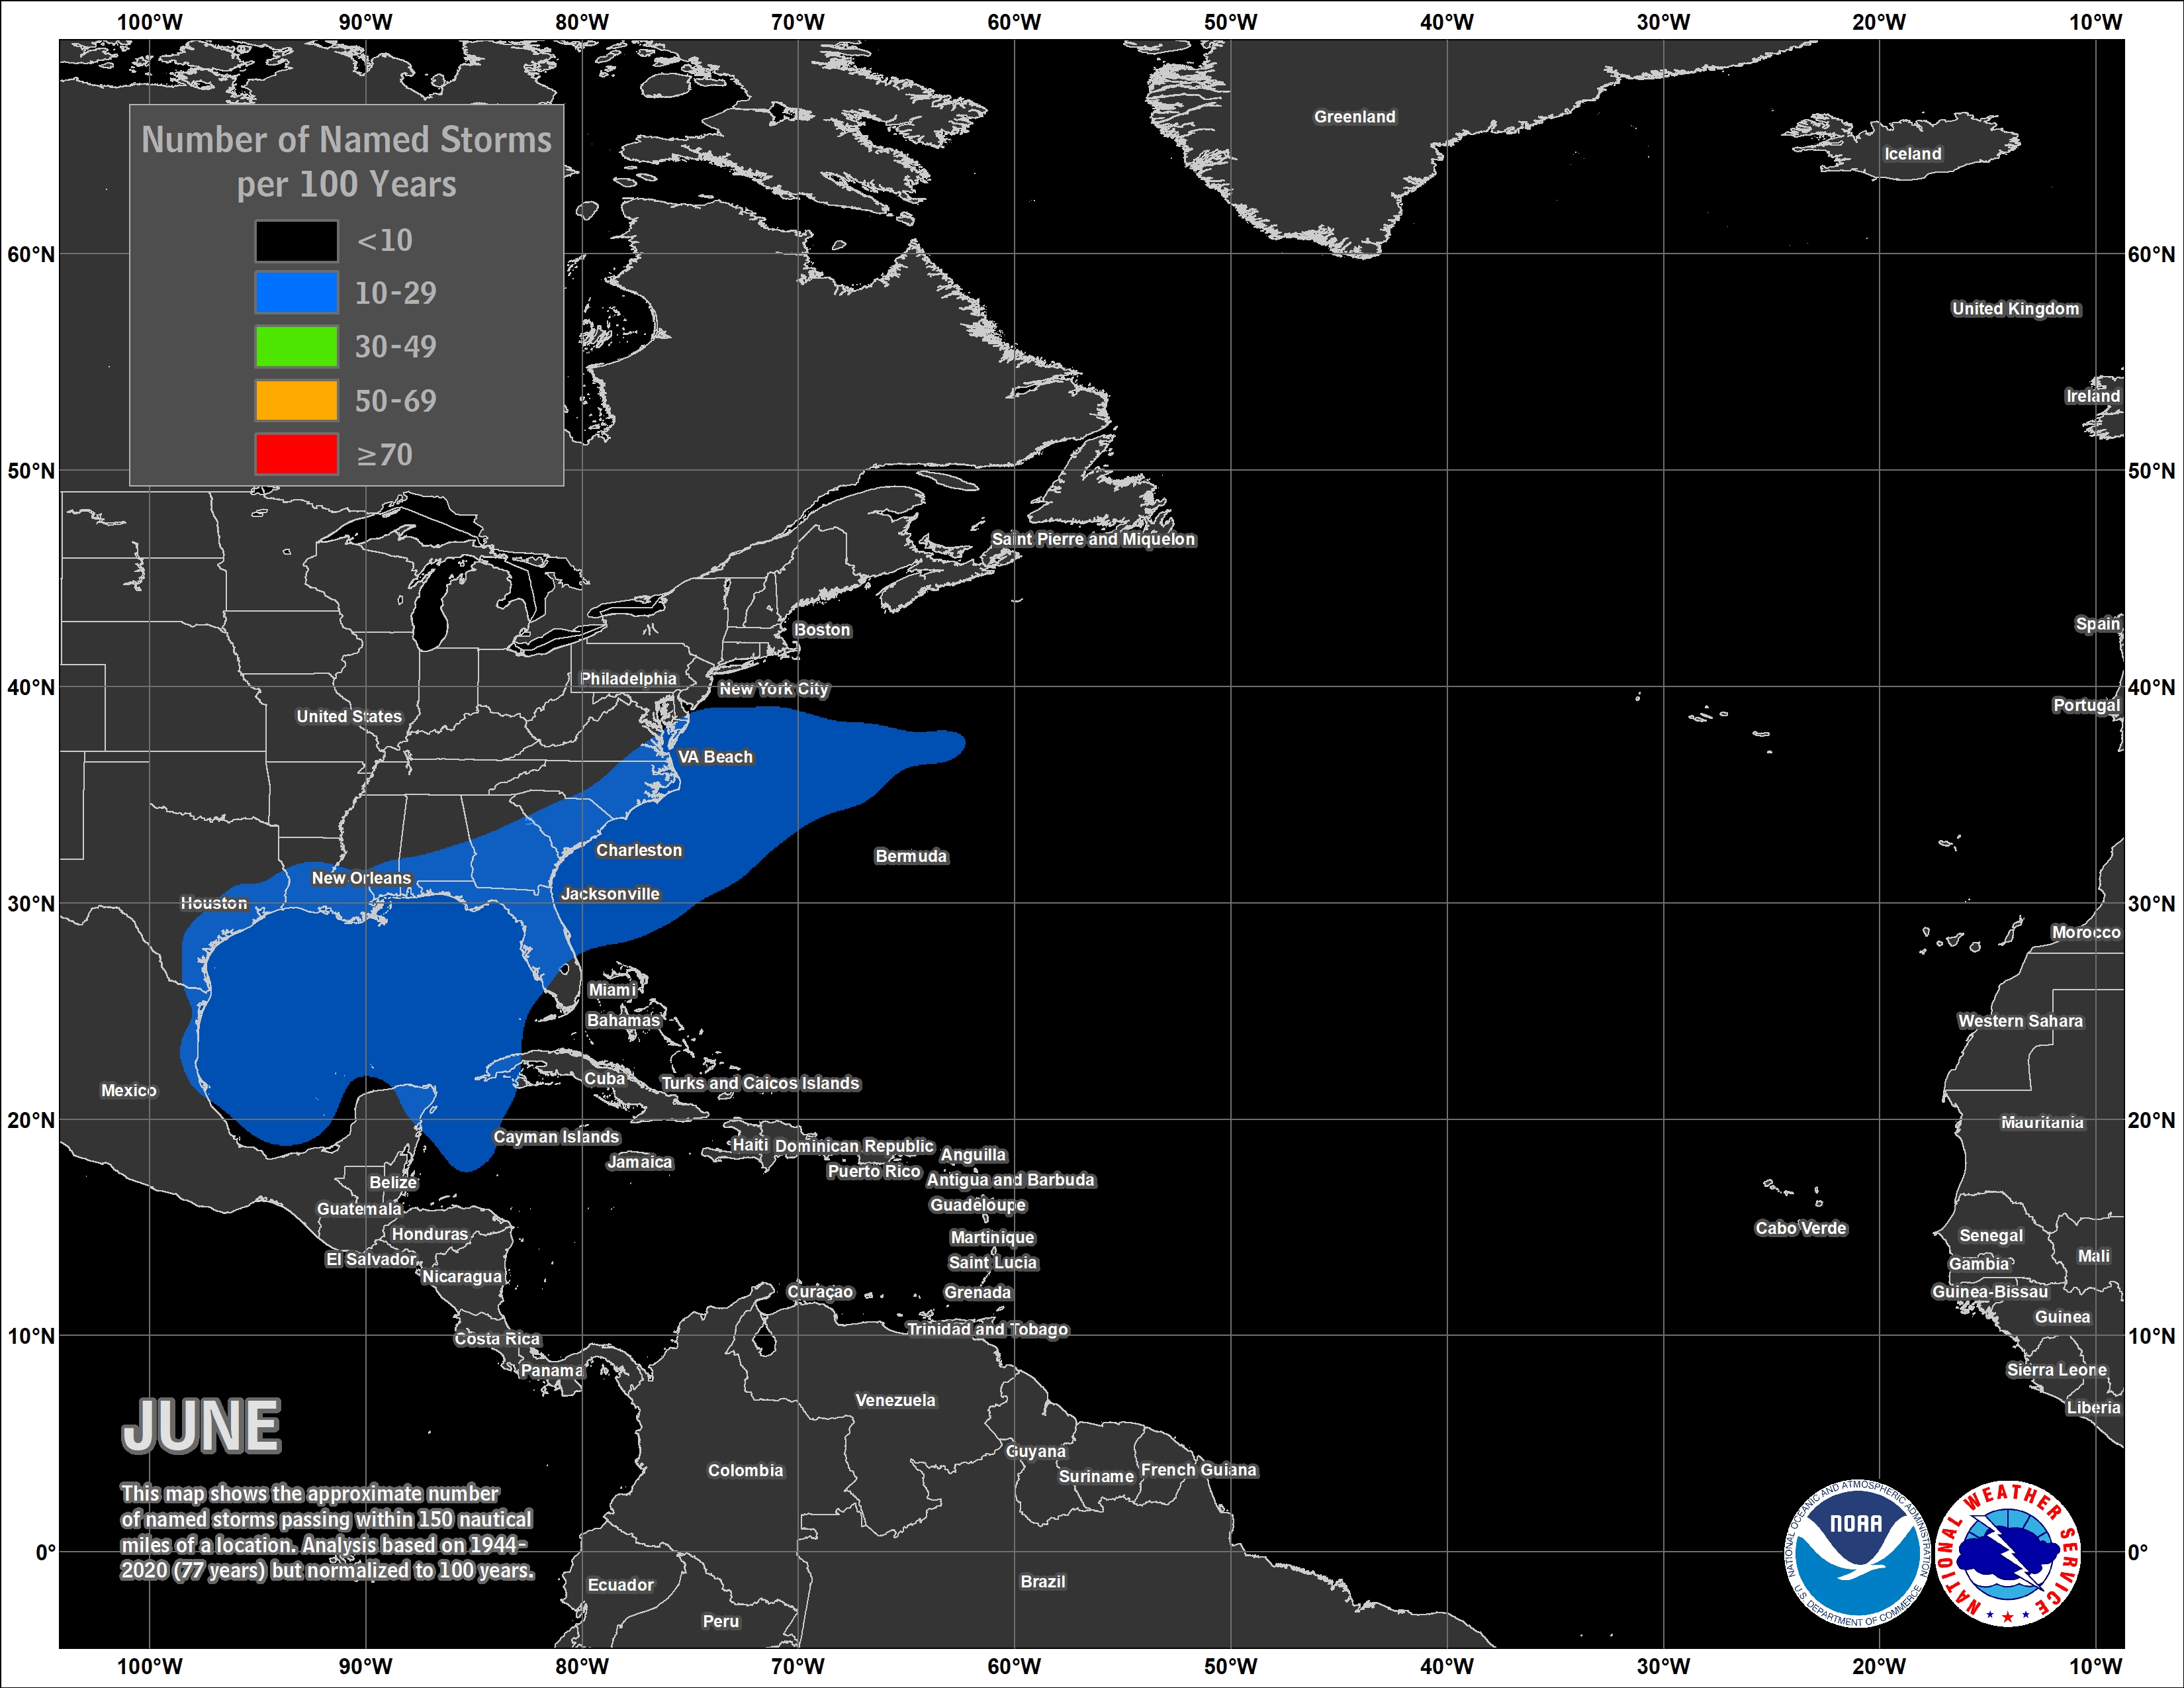
The latest outlook for June calls for equal chances of above or below normal temperatures. The good news is, as far as some potential to whittle away local local drought intensity some more, the southeast U.S. is favored to lean above normal on June rainfall. June marks the official start of the Atlantic Basin Hurricane Season and NOAA has released its outlook for 2026 and predicts storm development at below normal. Lending to the outlook the development and perhaps intensifying of El Niño over the central and eastern Pacific. Although ocean temperatures in the Atlantic are expected to be slightly warmer than normal and trade winds are likely weaker than average, El Niño conditions tend to support less tropical storms and hurricanes due to increase in wind shear and unfavorable environments over the Atlantic basin. Remember though, it only takes one storm to make for a very bad season. See the link to the outlook below. As we open up hurricane season, the climatologically more favorable area for storms to develop in June are typically off the Mid-Atlantic to closer to home, out over the Gulf. It's highly encouraged to review your hurricane preparedness. Click on the Preparedness Tab on the NWS Mobile Tropical Webpage.
Click on the snap shots below to expand:
 June Normals June Normals |

|

Outlook |

|
|
|
Additional Climate Links:
The National Weather Service Mobile Alabama's Climate and Past Weather page provides climate data at your fingertips for many observation points in the local forecast area by accessing the NOWData tab as well as many other climate resources. The Climate Prediction Center Link provides short and longer range climatic outlooks and education about the larger scale global circulations that impact temperatures and weather. With the large agriculture and farming presence along the central Gulf coast, the Drought Monitor link provides updates on drought trends and impacts. Another very helpful resource is the Community Collaborative Rain Hail and Snow (CoCoRaHS) network, which is a large group of volunteers working together to measure and map precipitation (rain, hail, and snow). The aim of CoCoRaHS is to provide the highest quality data for natural resource, education and research applications. You can be a part of the CoCoRaHS team by becoming a volunteer rainfall observer.