May 2023 Climate Summaries
Mobile Alabama and Pensacola Florida Area
National Weather Service Mobile Alabama
June 2, 2023
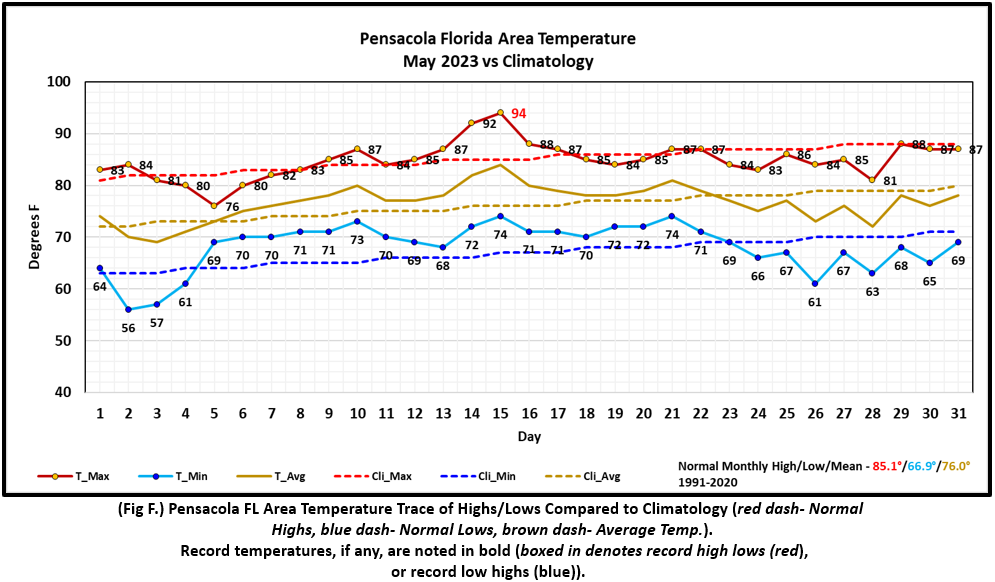
May 2023 in Review - The month started and ended cooler than normal with respect to low temperatures. Mobile saw the coolest stretch being at the first four days of the month when lows dipped into the lower to mid 50s or an average of 6.75° below normal through this period. Following, daily highs and lows at Mobile and Pensacola modified to above seasonal normals before trending back to near to below normal to close out the month. The warmest period was the middle of the month when highs jumped above 90° for a few days, or an average of 8° above normal. As a whole though, average monthly temperatures were very close to May normals. As far as records, only one record high temperature was reached. That was on May 15th at Pensacola when the thermometer rose to a toasty 94°.
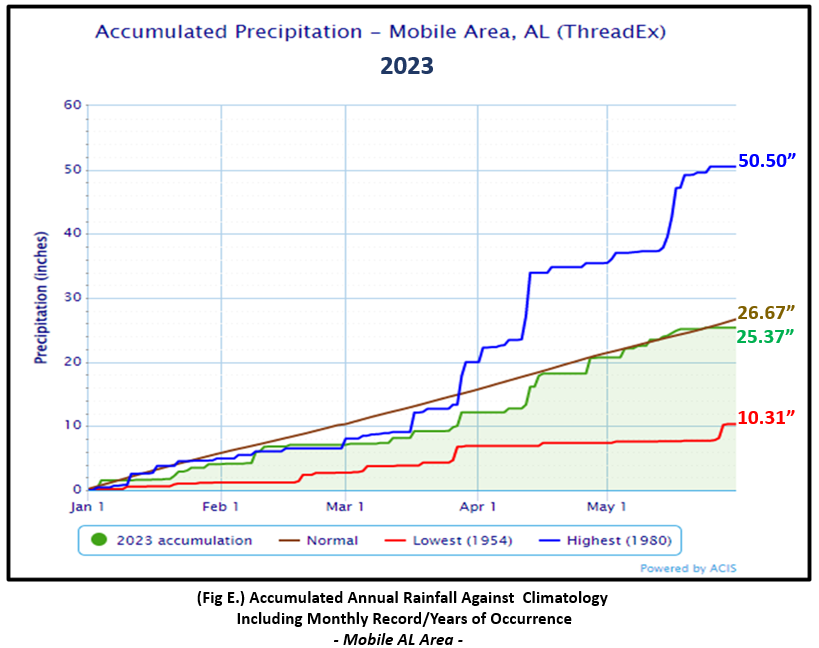
Typical for summer, daily precipitation from showers and storms can be rather hit and miss. Considering this, less rain arrived at the rain gauge at Mobile than Pensacola with Mobile seeing total rainfall coming in shy of normal by near 0.75" while Pensacola saw over 1.00" north of normal. Annual rainfall to date is just off the pace of normal at both Mobile and Pensacola.
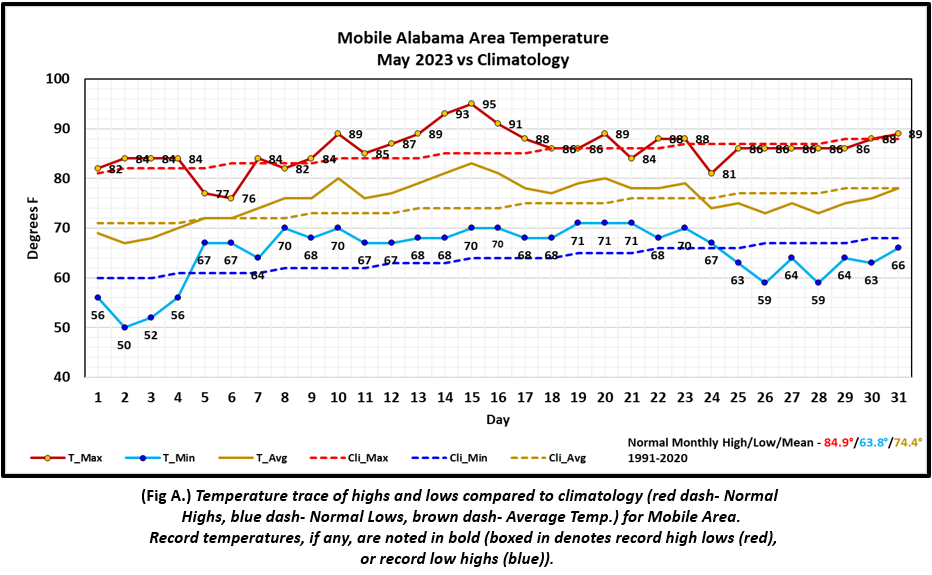
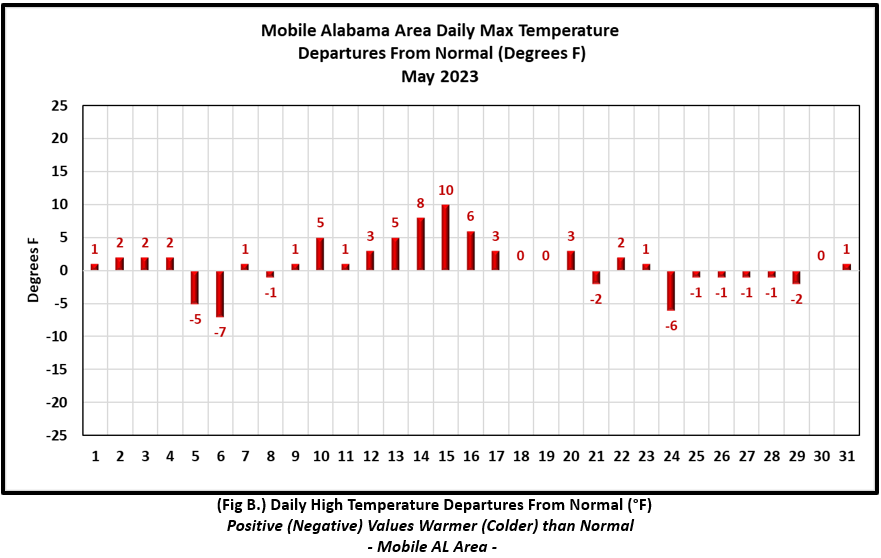
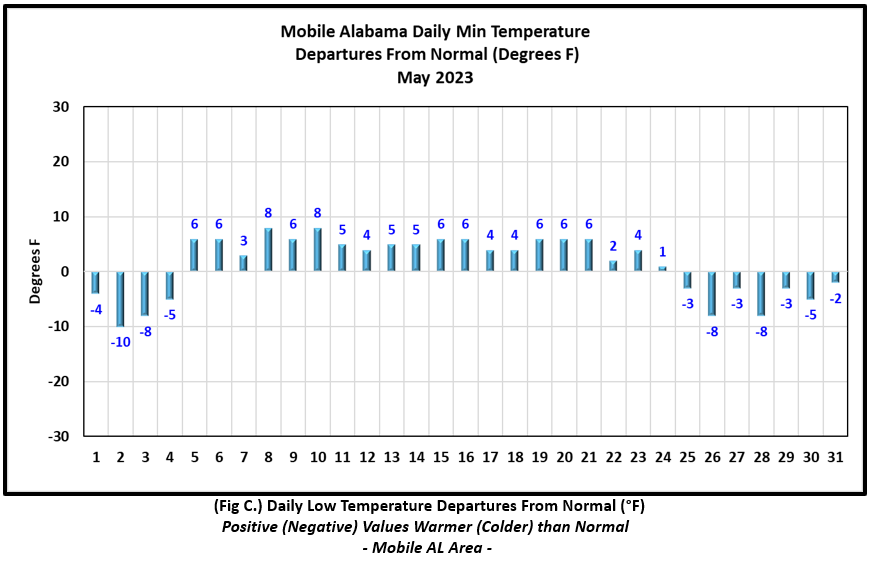
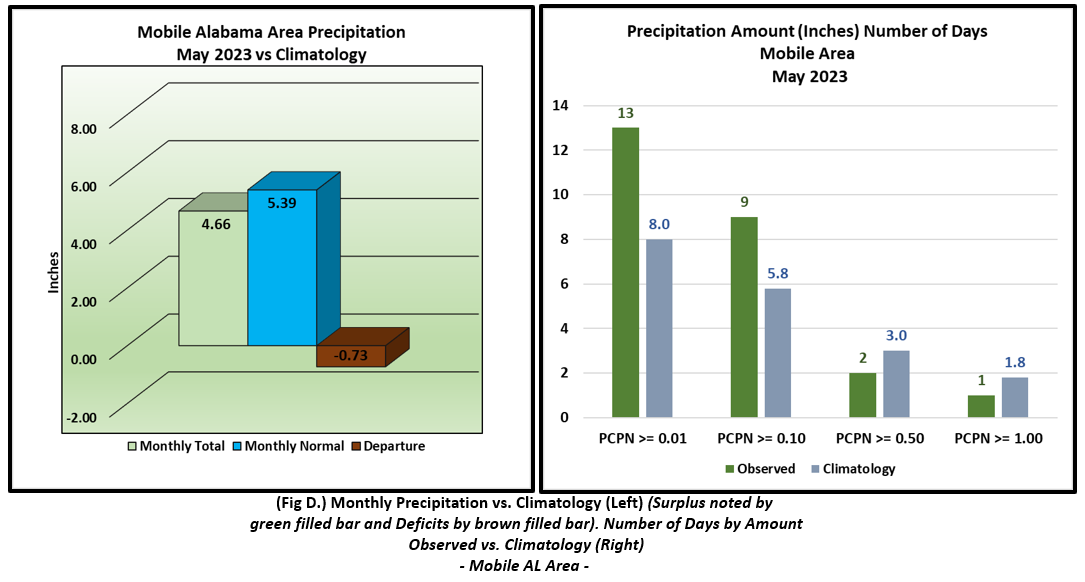
Mobile Alabama Area [Climate Normal Period 1991-2020, Climate Record Period 1872 to Present]- The average monthly high of 85.9° was 1.0° above normal. The average monthly low was 65.2° or 1.4° above normal. The average monthly temperature of 75.6° was 1.2° above normal. The highest temperature for the month of 95°, occurring on the 15th, 10° above normal for the date. The lowest temperature for the month was a rather cool, 50° on the morning of the 2nd, 10° below normal for this date. No record temperatures were reached. (Fig. A) shows a graphical representation of how the Mobile area temperatures compared to the seasonal normal daily highs and lows, which are shown by the colored dashed lines. Bar graphs reflecting the daily high/low temperature departures from normal are provided in the table below (Figs. B and C). Rainfall for May totalled 4.66" (Fig. D), or 0.73" below normal. Annual rainfall to date is in deficit by 1.30" below normal for the Mobile area (Fig. E).
May Top Records for the Month During the Period of Record for the Mobile Area:
Click on the Mobile Alabama area climate graphics below to expand:
|
|
|
|
|
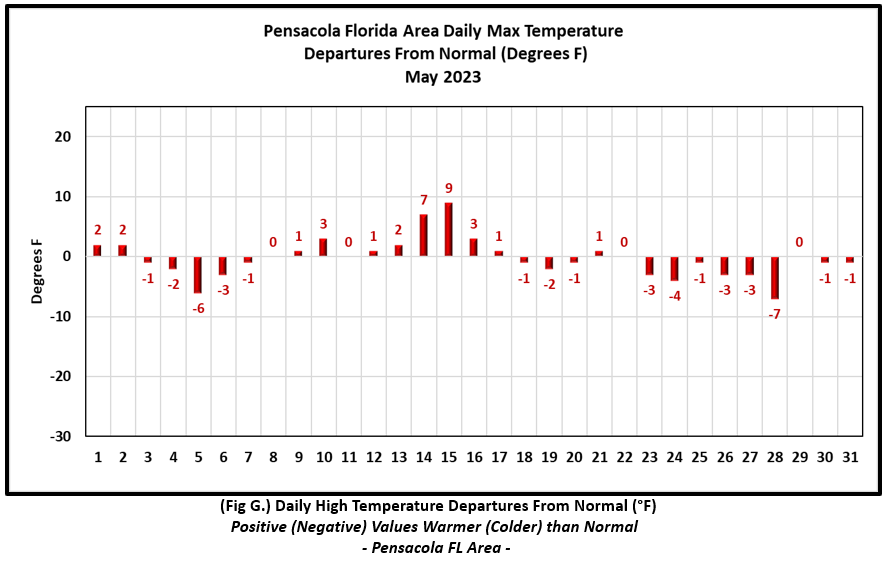
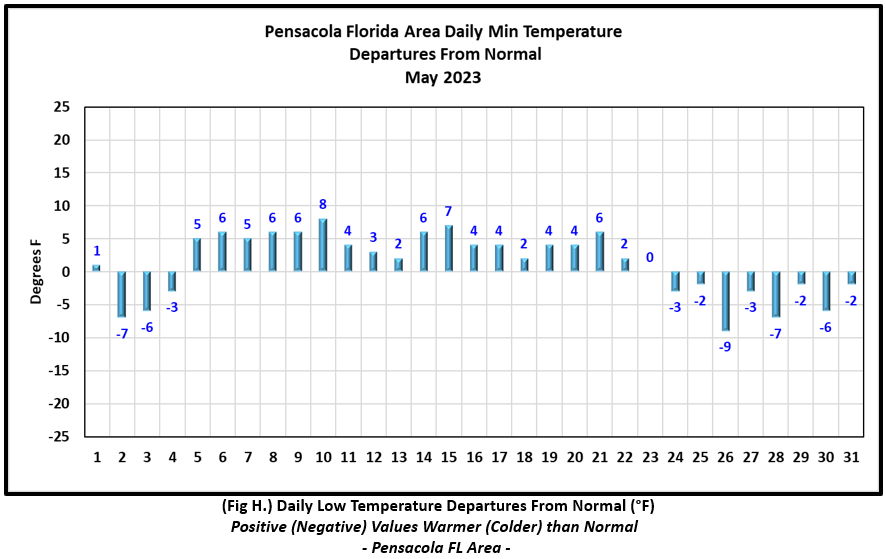
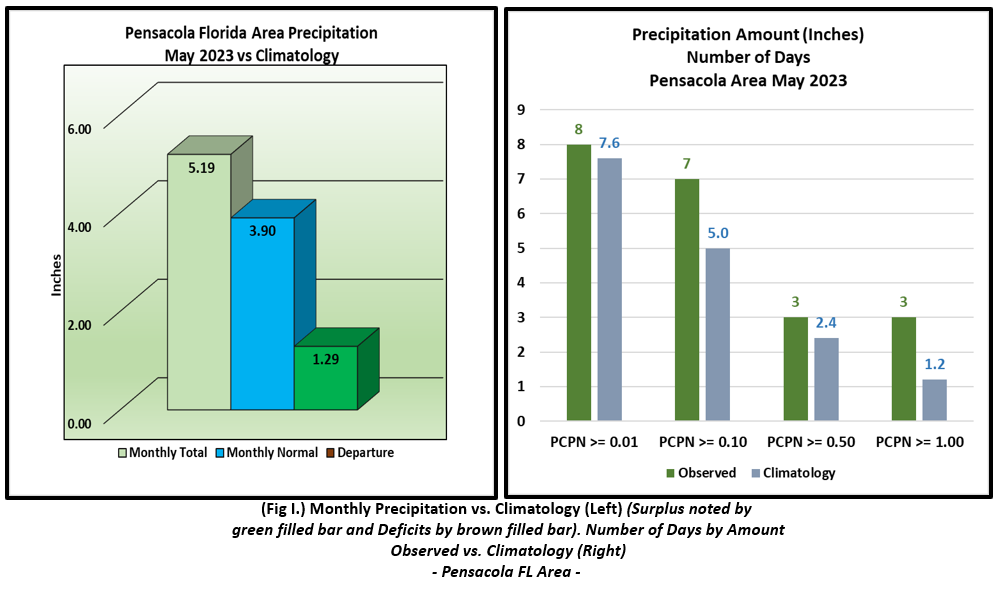
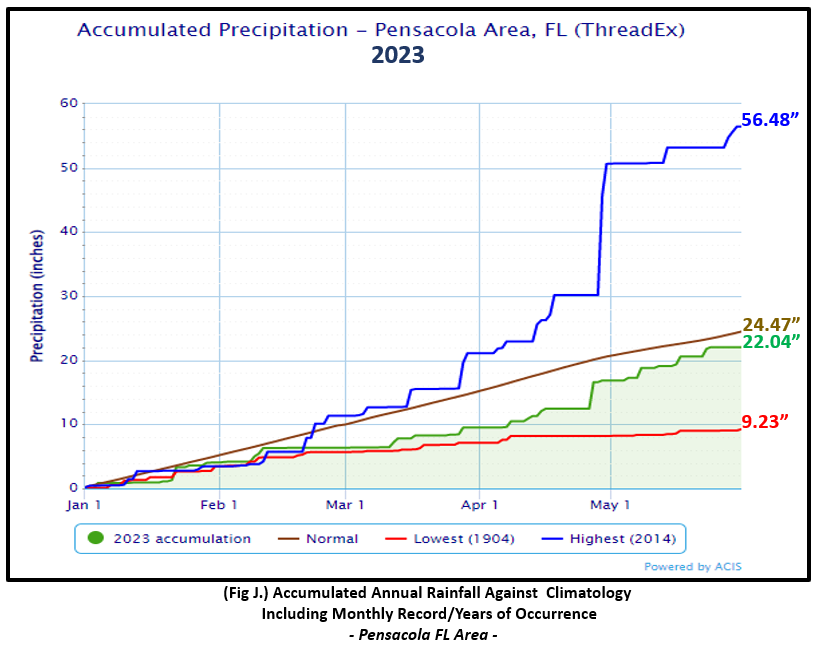
Pensacola Florida Area [Climate Normal Period 1991-2020, Climate Record Period 1879 to Present] - The average monthly high of 84.9° was 0.2° below normal. The average monthly low of 68.1° was 1.2° above normal. The average monthly temperature of 76.5° was 0.5° above normal. The highest temperature for the month, 94°, occurring on the 15th and was 9° above the normal for the date and also tied the previous record set back in 1998. The lowest temperature was 56° on the morning of the 2nd and 7° below normal for this date. (Fig. F) shows a graphical representation of how the Pensacola area temperatures compared to the seasonal normal daily highs and lows, which are shown by the colored dashed lines. (Figs. G and H) shows the daily high/low temperature departures from normal. Rainfall for May totalled 5.19" (Fig. I), or 1.29" above normal. Annual rainfall to date is in deficit by 2.43" below normal for the Pensacola area (Fig. J).
May Top Records for the Month During the Period of Record for the Pensacola Area:
Click on the Pensacola Florida area climate graphics below to expand:
|
|
|
|
|
Additional May 2023 Climatology and Topics
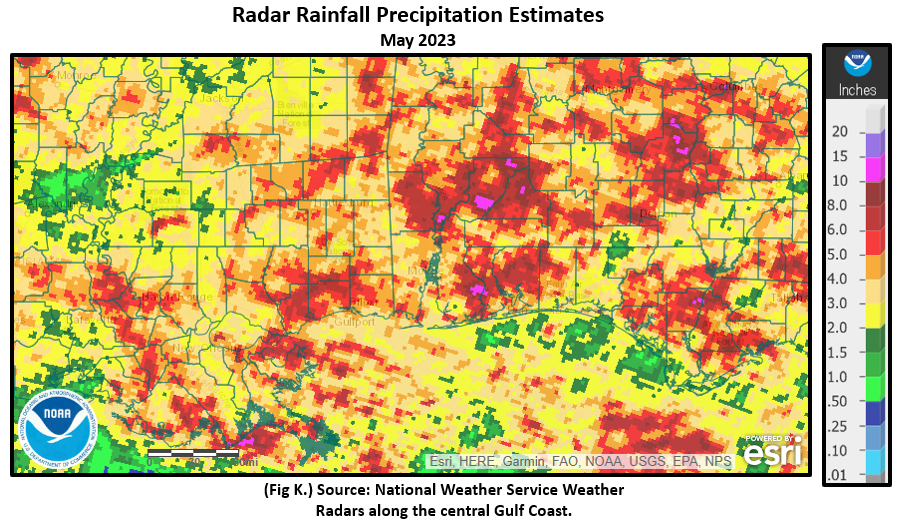
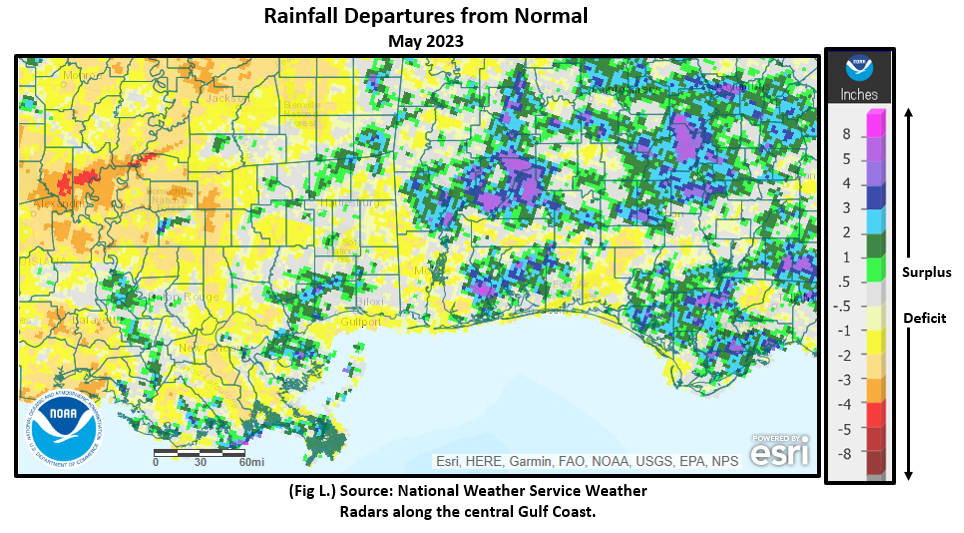
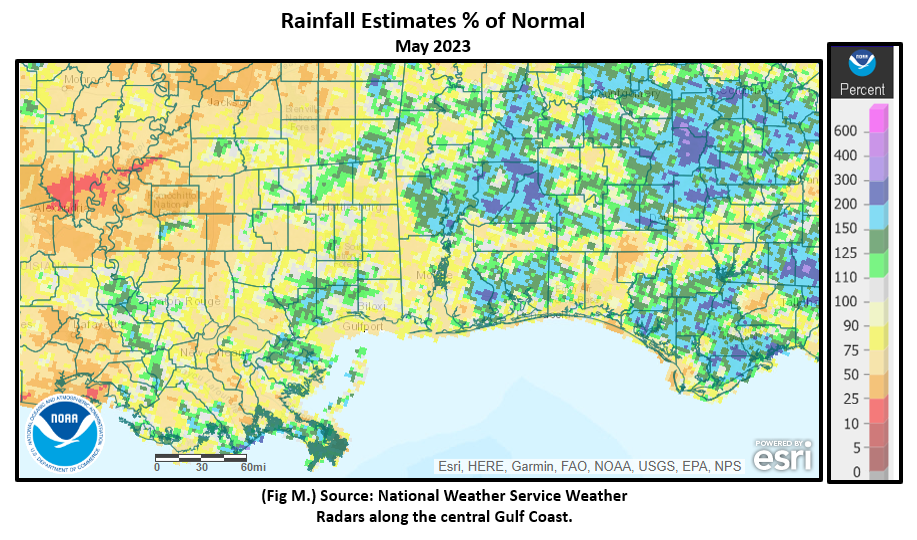
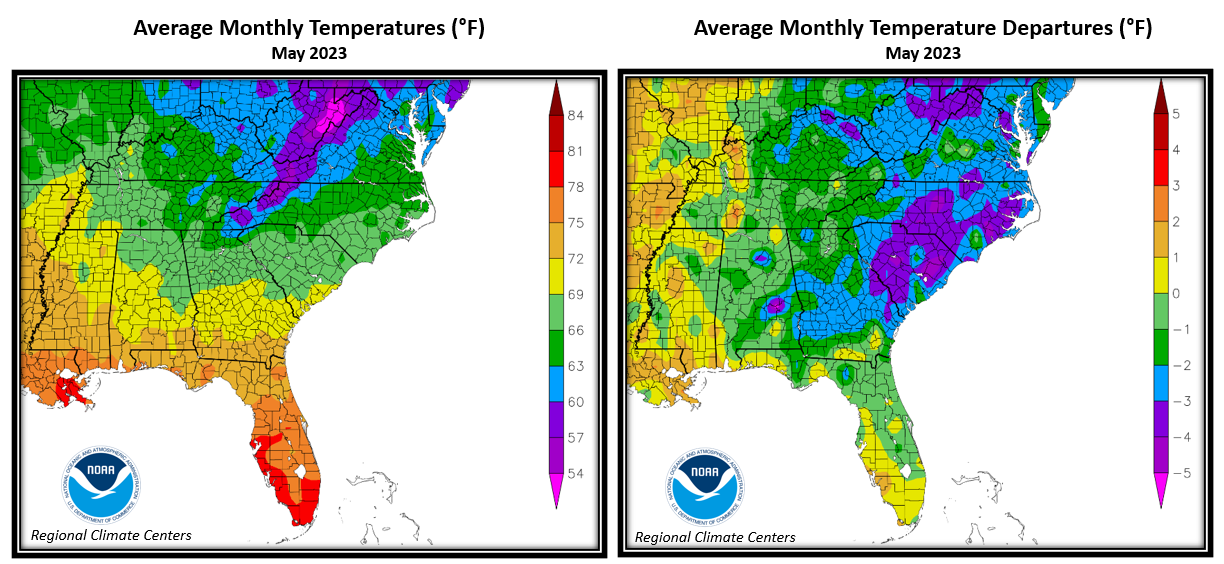
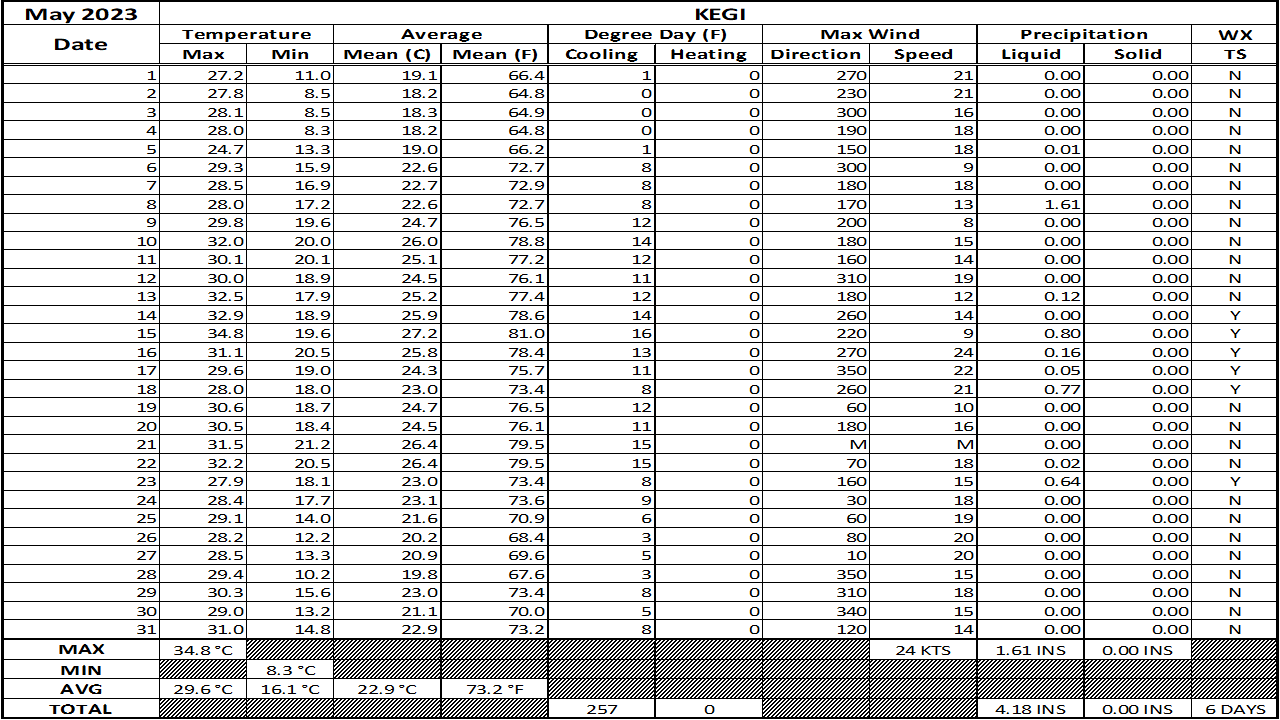
There were notable pockets of excessive rain that surpassed May monthly normals by several inches focused primarily over the Interstate 10 corridor from Baldwin County Alabama, east across the western Florida Panhandle. The other was over the interior of south-central Alabama, south of US Highway 84. Within these areas, a few locales saw 200 to 300% of normal rainfall. (Fig. K) shows the areal monthly rainfall total, (Fig. L) shows the areal rainfall departures from normal and (Fig. M), the areal percent of normal rainfall. Areal average temperatures (Fig. N), shows the immediate central Gulf coastal areas seeing slightly above normal numbers with most of the interior seeing slightly below normal. The latest May 2023 monthly summary for Eglin Air Force Base (AFB) - KVPS has been received and provided in the table below. The temperatures in the daily tables consists of numbers both in °F/°C. Data courtesy of Mr. David Biggar, Staff Meteorologist, 96th Weather Squadron. Provided by permission.
|
|
|
|
|

|
|
June 2023 Climatology, Seasonal Climatology and Outlooks:
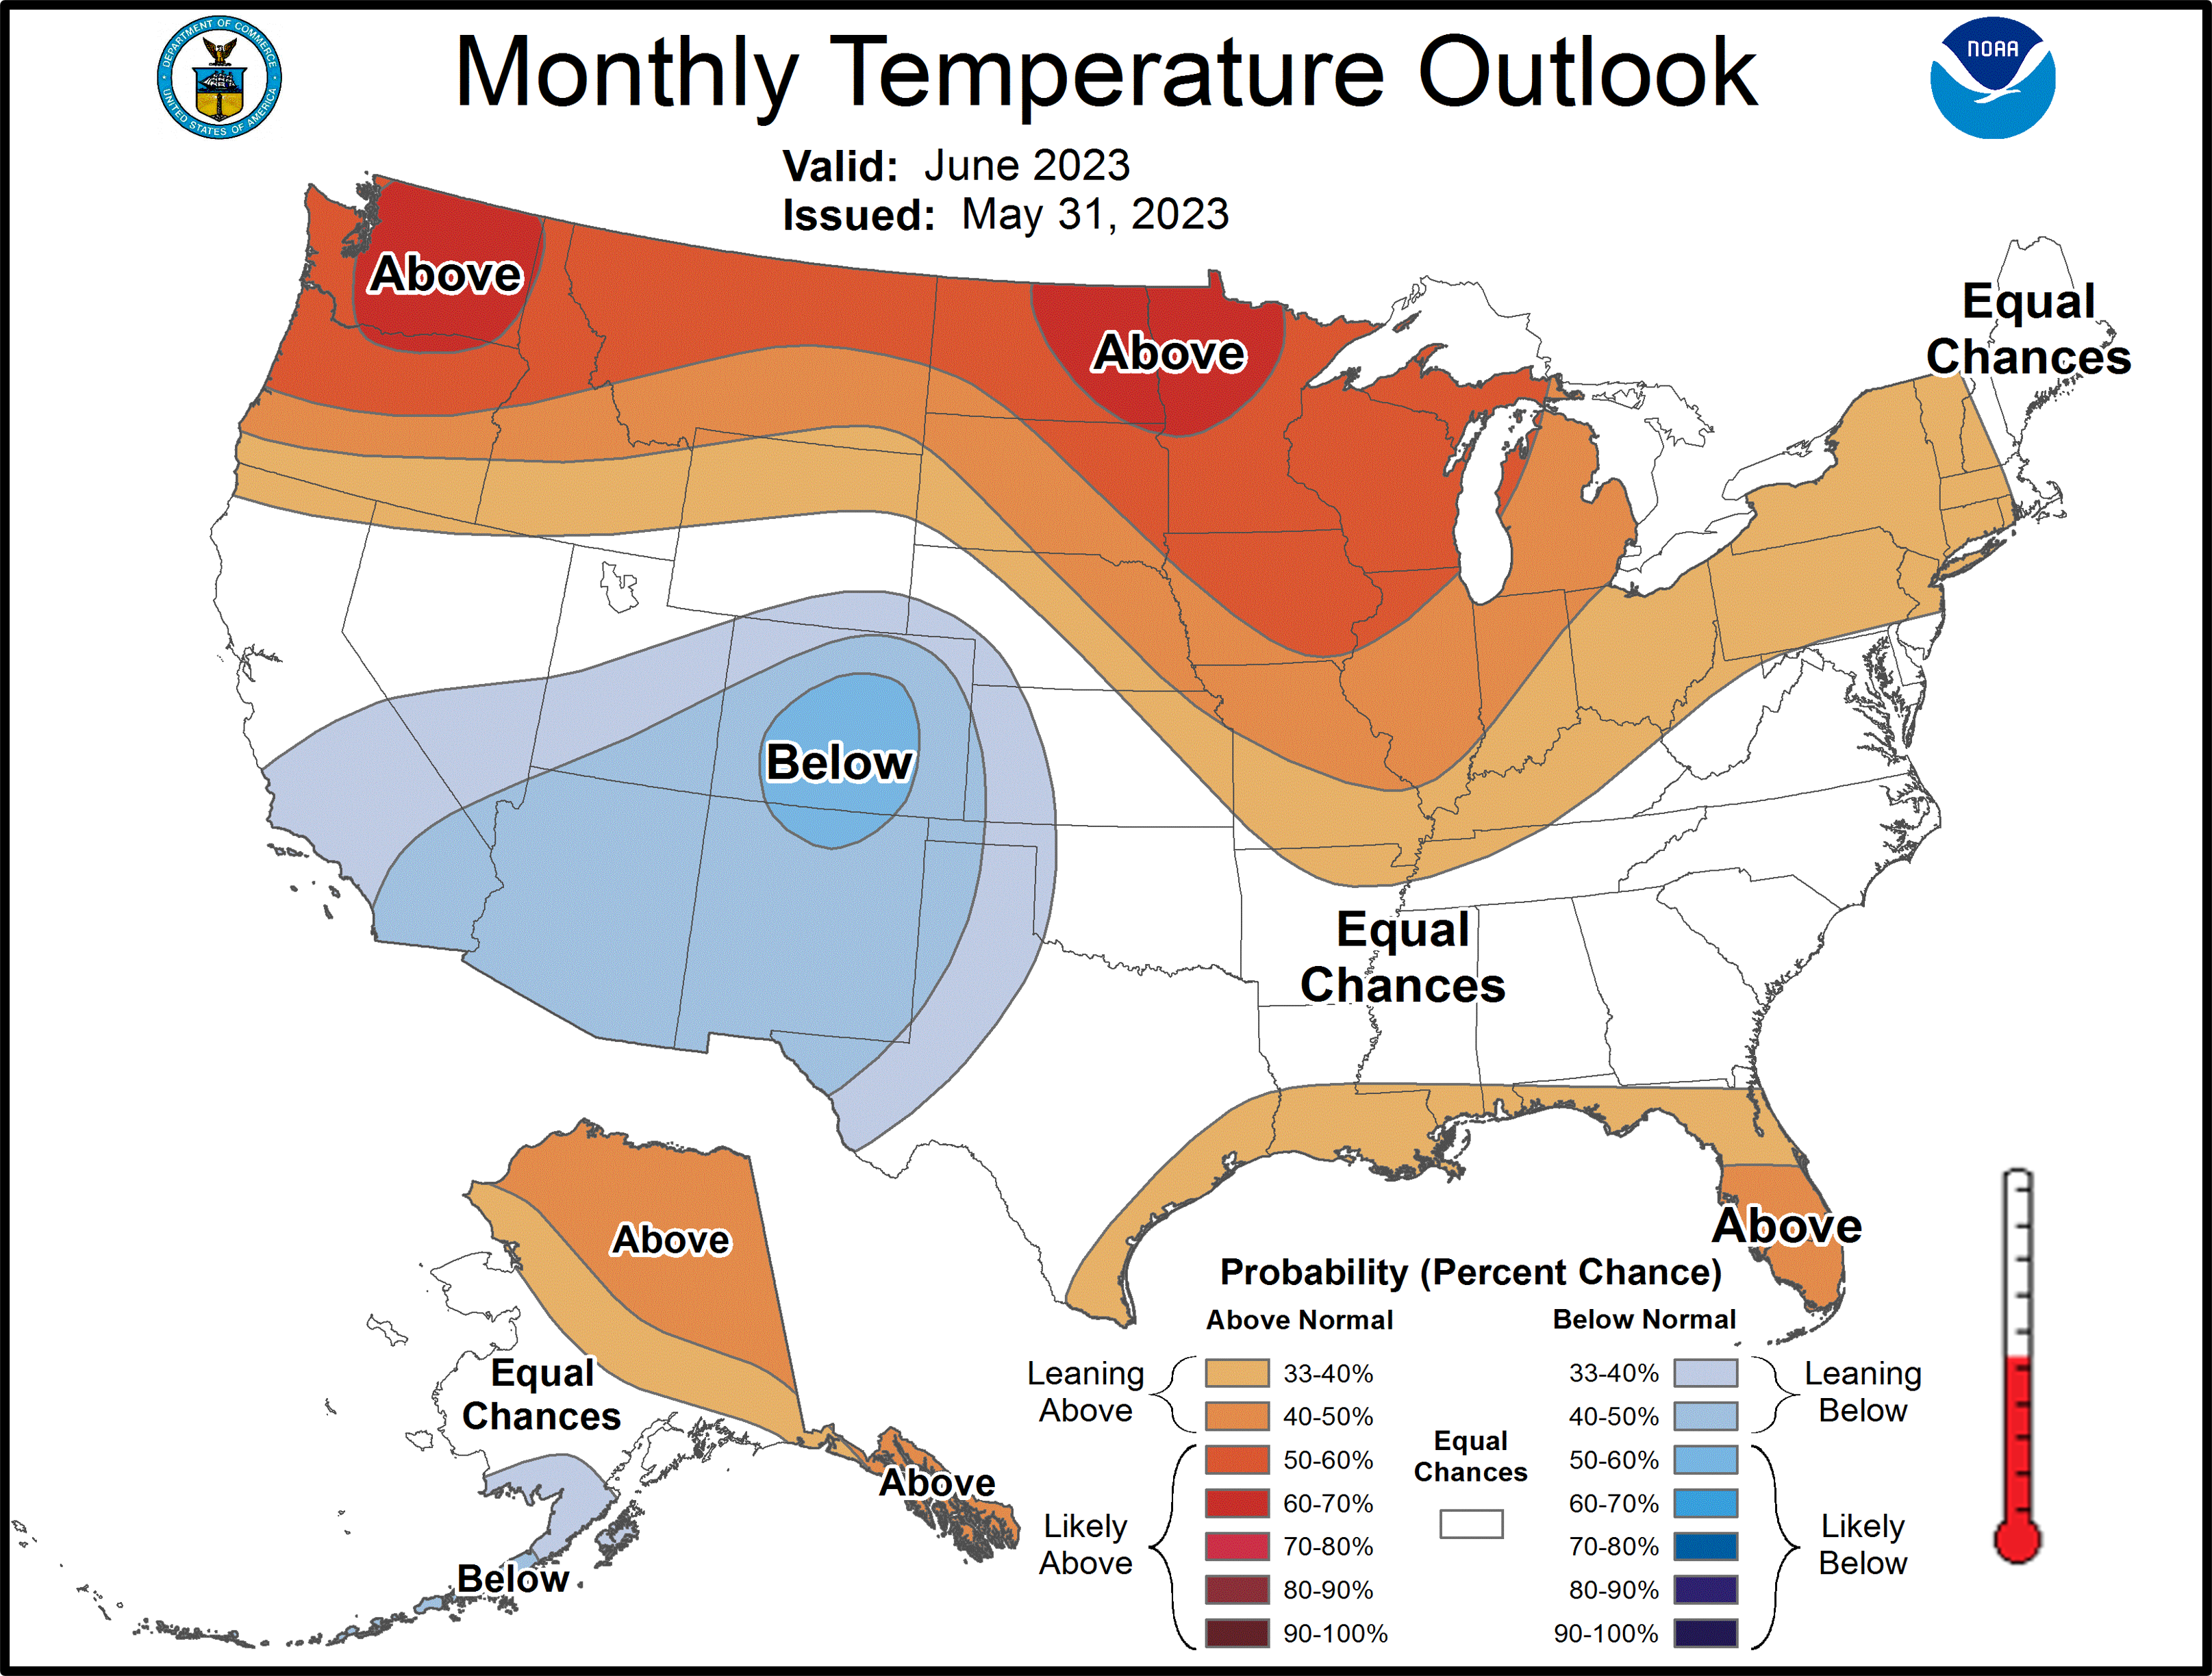
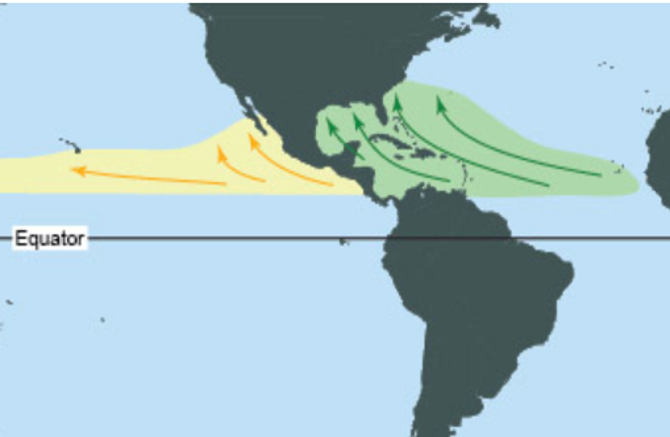
It appears the I-10 corridor and points south are favored to lean above normal in temperature for the month of June with equal chances of seeing above or below normal temperatures over the remainder of the Coastal Plain. The outlook for precipitation favors equal chances of above or below monthly normal occurrence. With June marking the official start of the Atlantic Basin hurricane season, NOAA predicts a near normal hurricane season. After moving out of an extended period of La Niña conditions, there is now a high potential that El Niño will develop this summer which can suppress hurricane activity in the Atlantic Basin. However, this could be offset by warmer than normal sea surface temperatures which would provide an energy source for storm development along with other favorable factors. It's highly encouraged to review your hurricane preparedness. Click on the Preparedness Tab on the NWS Mobile Tropical Webpage.
Click on the snap shots below to expand:
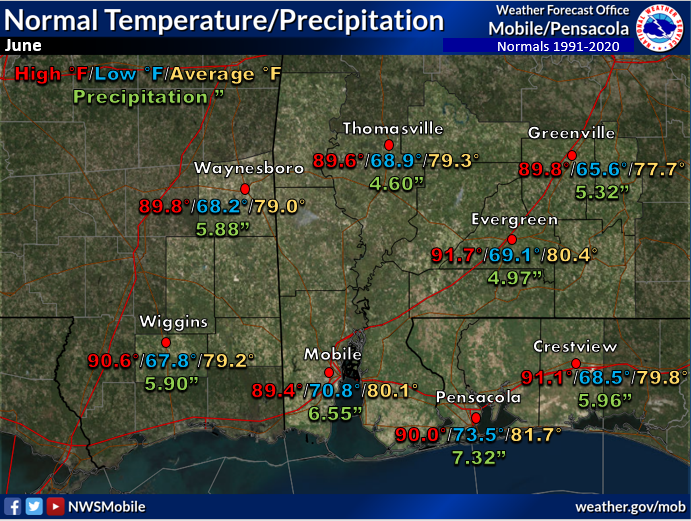 June Normals June Normals |
|
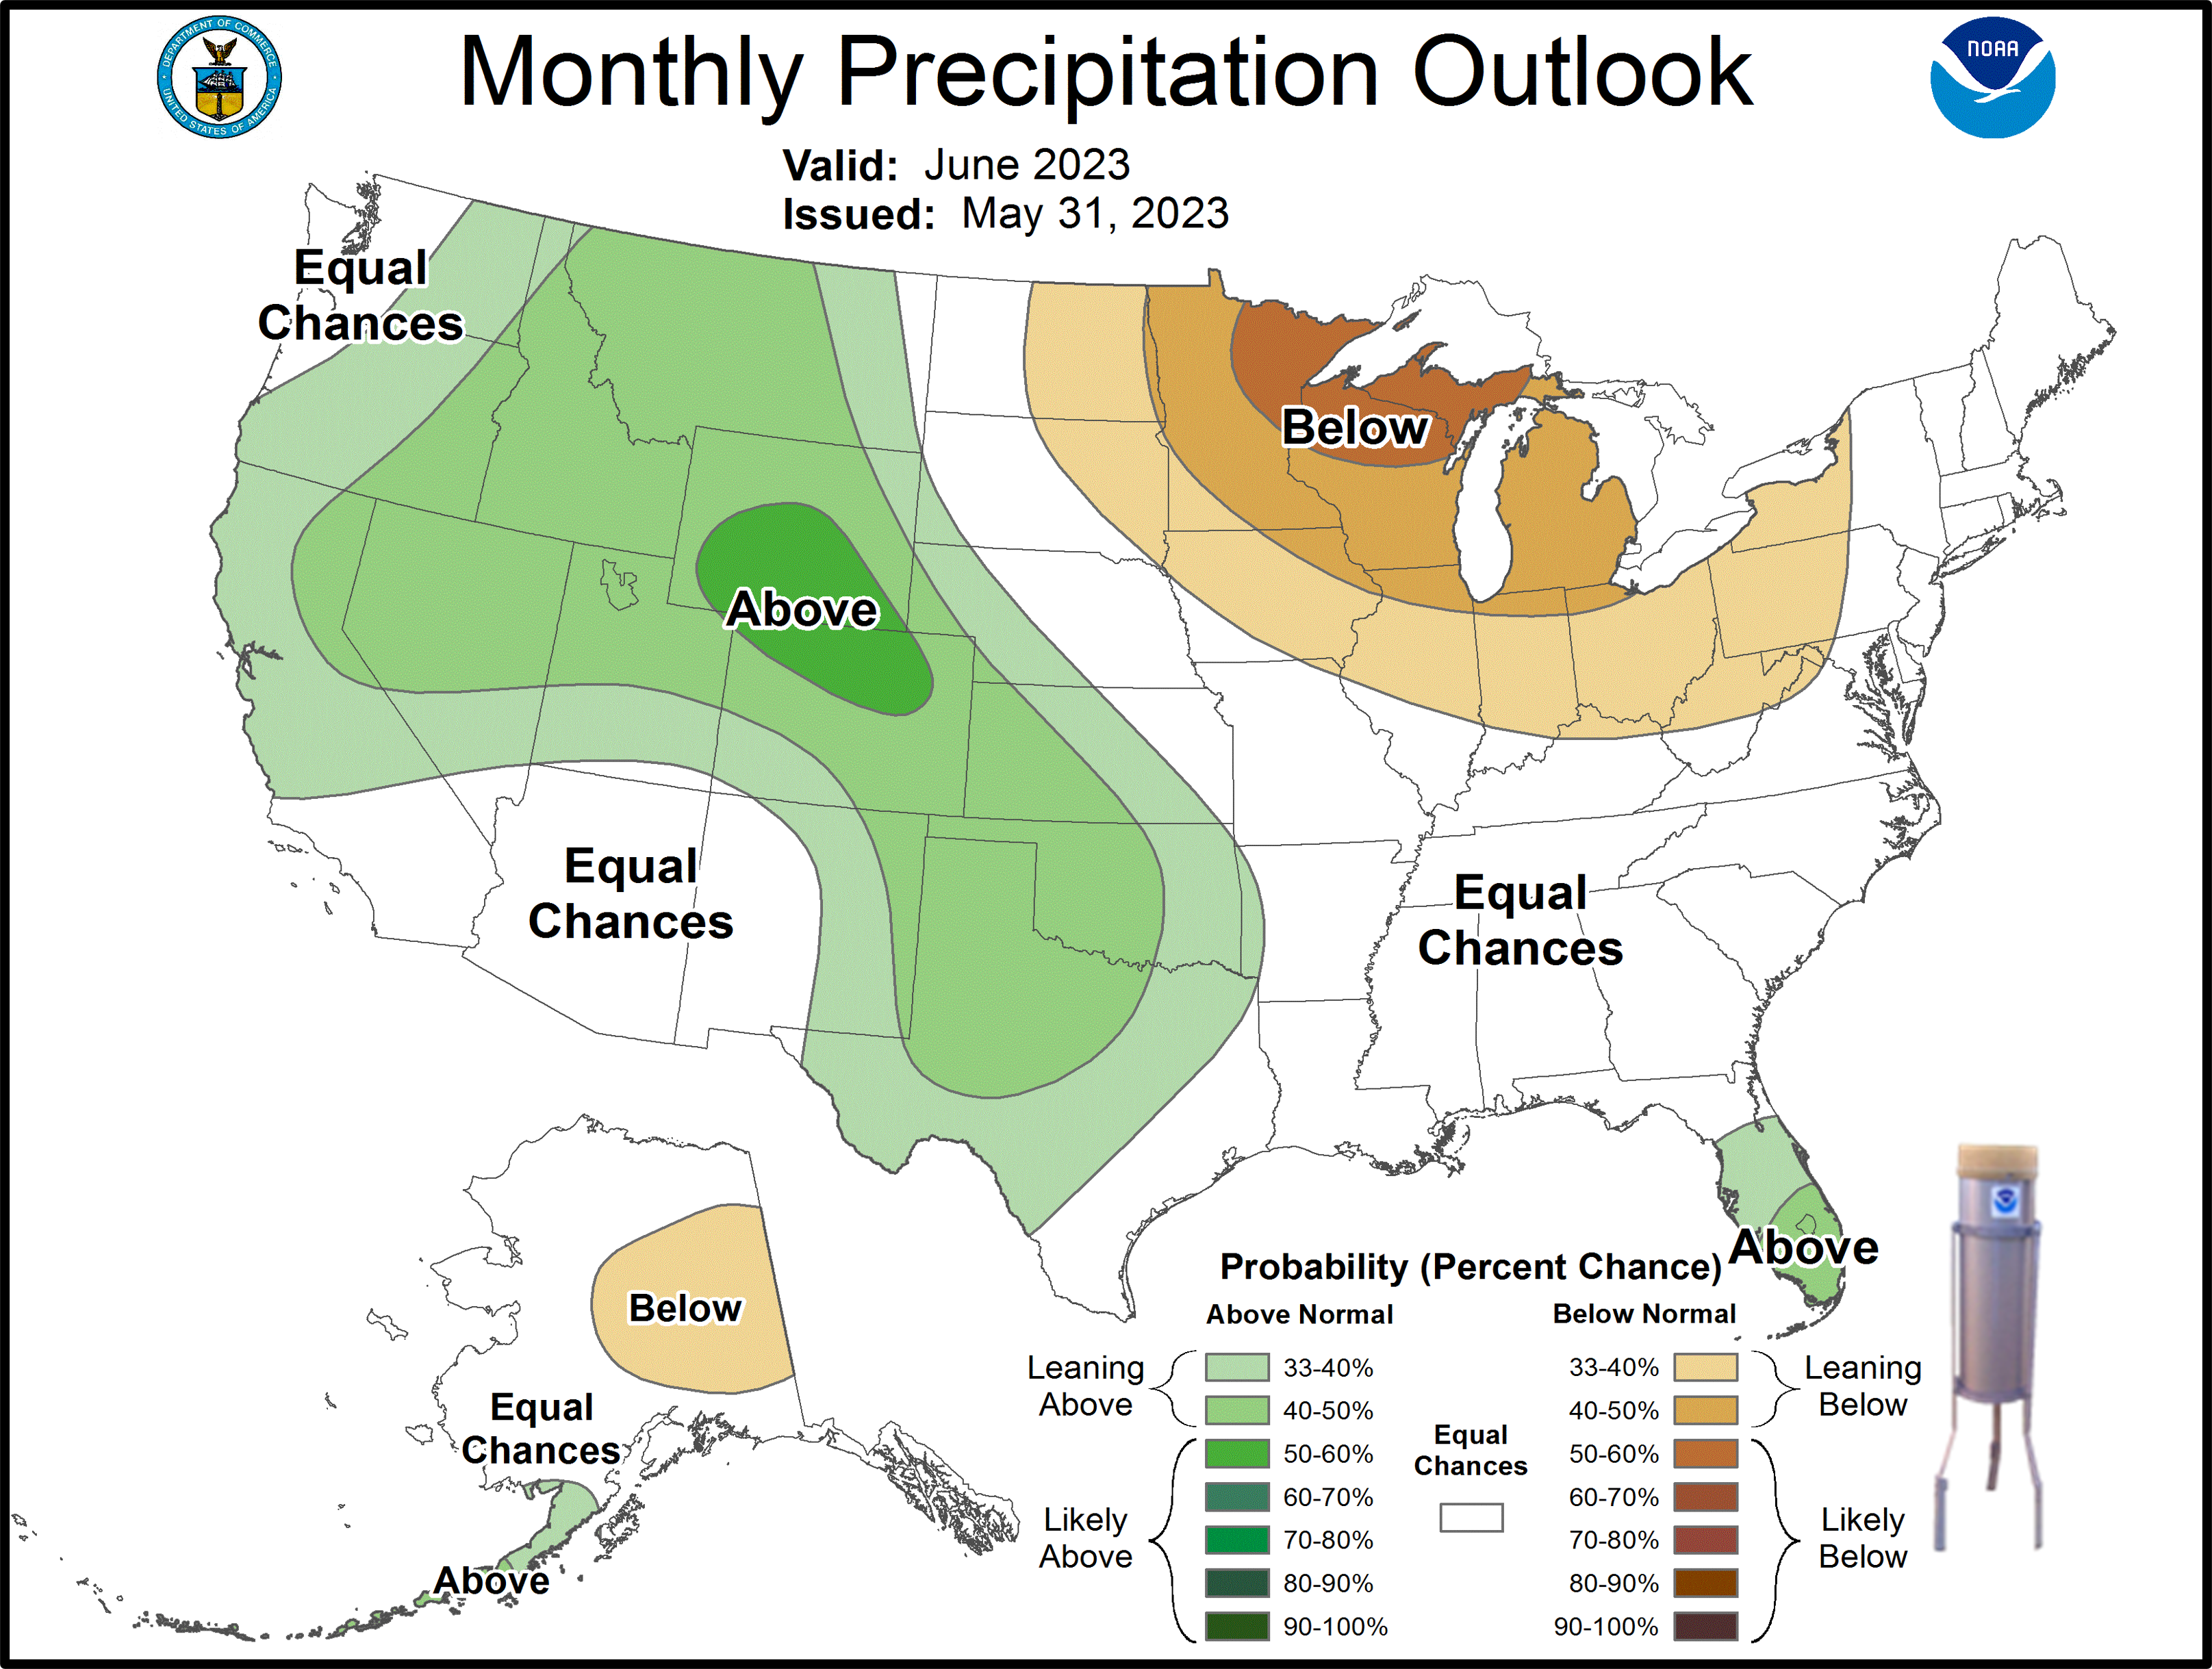
Outlook |

|
|
Additional Climate Links:
The links below are intended to provide additional climate information, education and outlooks. The National Weather Service Mobile Alabama's Climate and Past Weather page provides climate data at your fingertips for many observation points in the local forecast area by accessing the NOWData tab as well as many other climate resources. The Climate Prediction Center Link provides short and longer range climatic outlooks and education about the larger scale global circulations that impact temperatures and weather. With the large agriculture and farming presence along the central Gulf coast, the Drought Monitor link provides updates on drought trends and impacts. Another very helpful resource is the Community Collaborative Rain Hail and Snow (CoCoRaHS) network, which is a large group of volunteers working together to measure and map precipitation (rain, hail and snow). The aim of CoCoRaHS is to provide the highest quality data for natural resource, education and research applications. You can be a part of the CoCoRaHS team by becoming a volunteer rainfall observer. To learn more click on the CoCoRaHS link below.
National Weather Service Mobile AL Climate and Past Weather
National Weather Service Mobile AL Climate Summary Monthly Archives
Climate Prediction Center (CPC)
CoCoRaHS Network Water Year Summaries
![]()