November 2025 Climate Summaries
Mobile Alabama and Pensacola Florida Area
National Weather Service Mobile Alabama
December 2, 2025
November 2025 in Review - All three temperature metrics considering average highs, lows and means were above normal at both Mobile and Pensacola. As is typical there were large swings in temperatures as we move into the cold season. There were two strong cold frontal passages. One on the afternoon of the 9th and the other being a series of frontal passages on the afternoon of the 26th that sent temperatures plunging to well below normal for two to three days following their passage. The coldest air-masses of the two occurred between the 10th through the 12th. Highs on the 10th and 11th at Mobile plunged to 17.5° below normal on average and at Pensacola 18.5° below normal on average. The span from the morning of the 10th through the 12th saw overnight lows the coldest of the Fall season where lows averaged 17.3° below normal on average at Mobile and 18.0° below normal on average at Pensacola. A record cold high and a new record low was reached at Mobile during this period and Pensacola saw two new record lows reached during the period. Highs and lows rebounded to much above normal at both sites from the 14th to the 25th. Average highs and lows during this period of warming were 10.3° and 10.5° above normal respectively and at Pensacola 7.0° and 9.1° above normal respectively. In fact, Mobile saw a new daily record high reached and Pensacola saw two new record high low temperatures occurring during this time span, before cooling back down to close out the month.
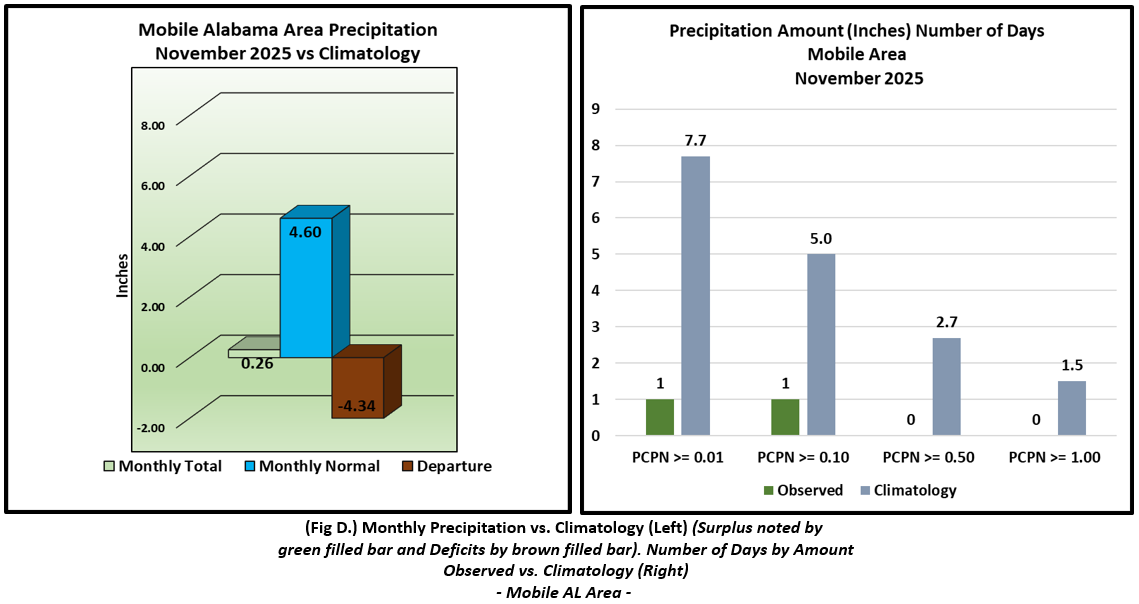
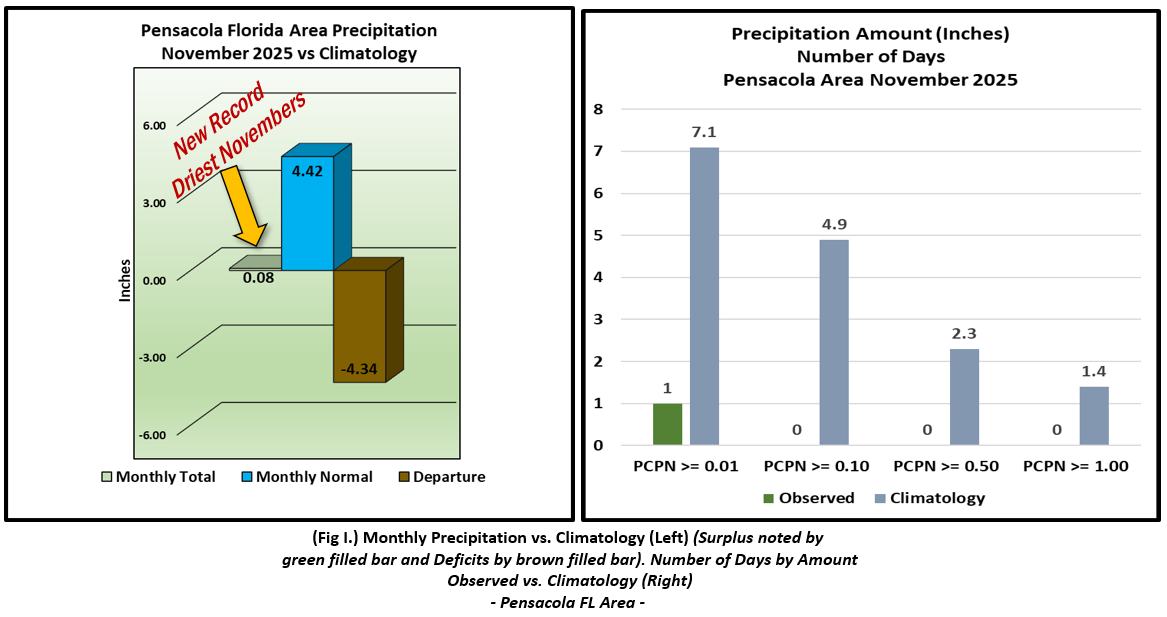
The lack of rainfall was astonishing for the deep south with Mobile and Pensacola in the top five driest Novembers on record with Mobile 4th driest and Pensacola standing tall at the top driest.
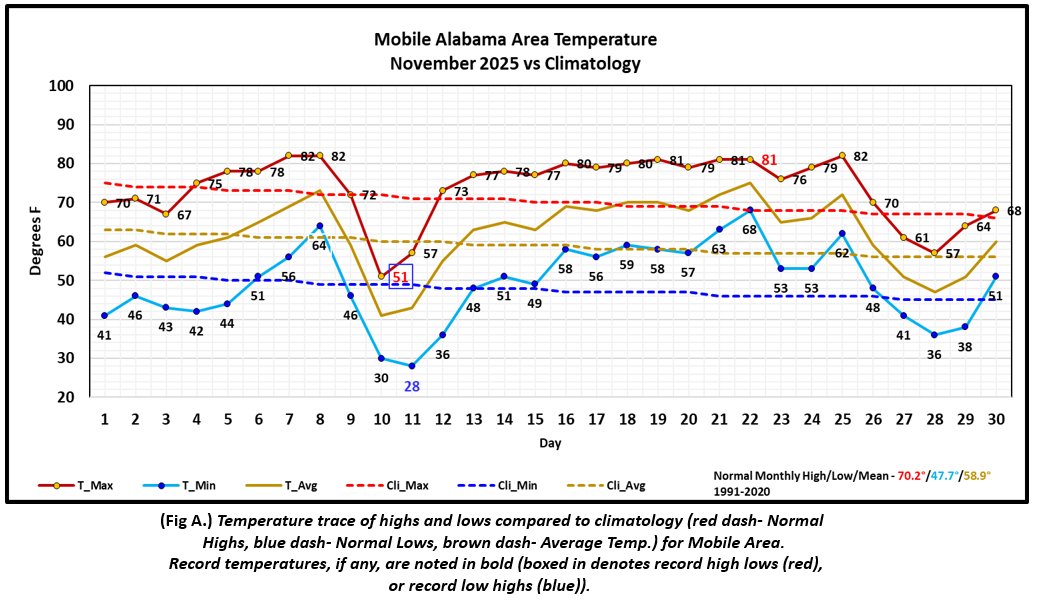
Mobile Alabama Area [Climate Normal Period 1991-2020, Climate Record Period 1872 to Present]- The average monthly high of 73.5° was 3.3° above normal. The average monthly low was 49.2° or 1.5° above normal. The average monthly temperature of 61.4° was 2.5° above normal. The highest temperature for the month, was a toasty 82° on three days, the 7th, 8th and 9° and 10° above normal for these days and again on the 25th, 14° above the normal for this date. The lowest temperature for the month plunged to a record setting 28° on the morning of the 11th, 21° below normal for the date. Following provides more details on the three record temperatures for the Mobile area:
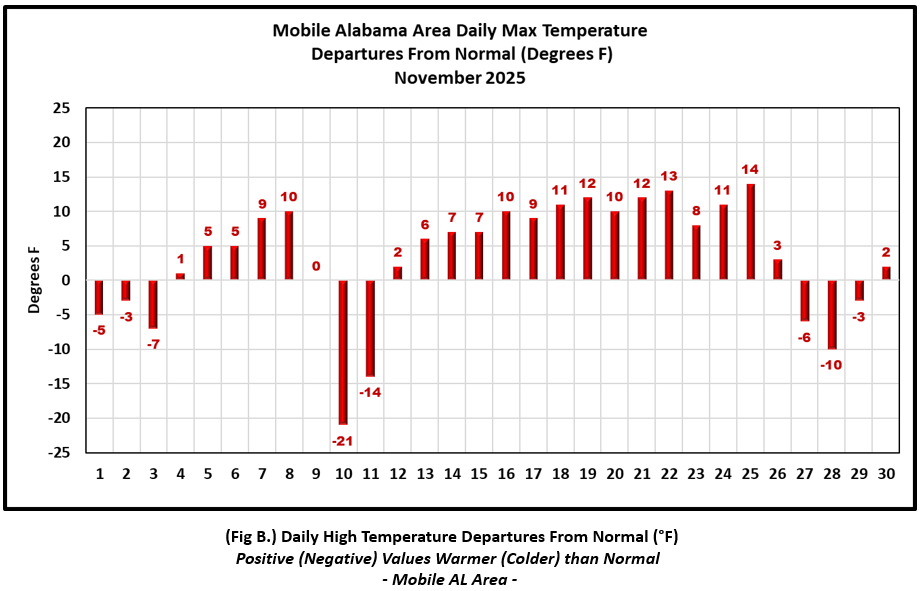
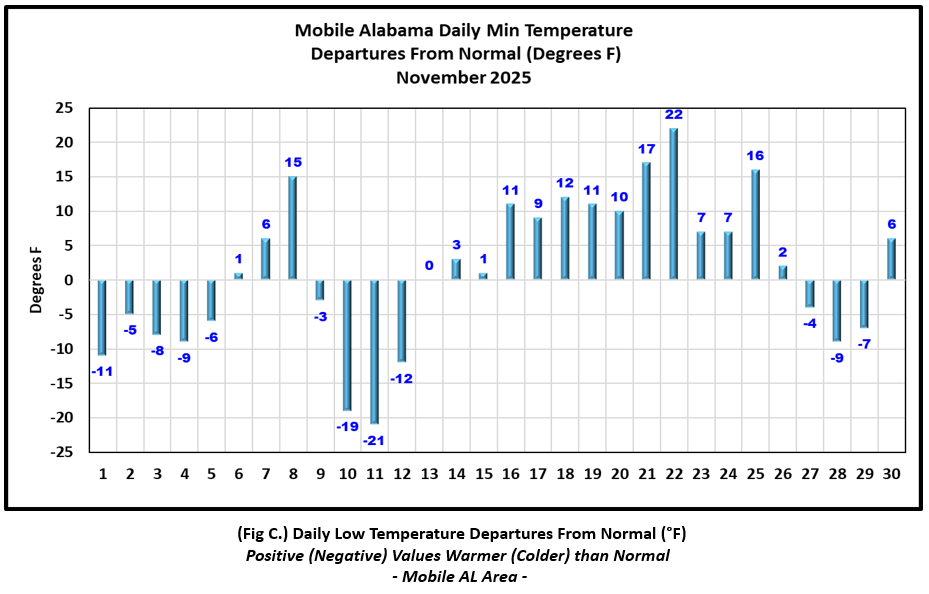
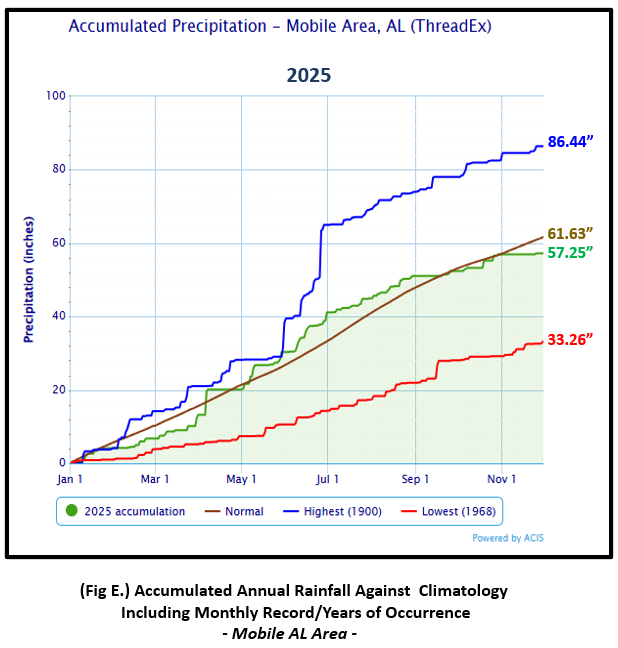
(Fig. A) shows a graphical representation of how the Mobile area temperatures compared to the seasonal normal daily highs and lows, which are shown by the colored dashed lines. Bar graphs reflecting the daily high/low temperature departures from normal are provided in the table below (Figs. B and C). The rain gauge collected a meager 0.26" (Fig. D), or 4.34" below the monthly normal. Mobile takes over the 4th spot in the list of driest Novembers on record. The Mobile area sees an annual rainfall deficit to date at well over four inches below normal. Annual total collected thus far is 57.25" or 4.38" below normal to date. (Fig. E).
November Top Records for the Month During the Period of Record for the Mobile Area:
Click on the Mobile Alabama area climate graphics below to expand:
|
|
|
|
|
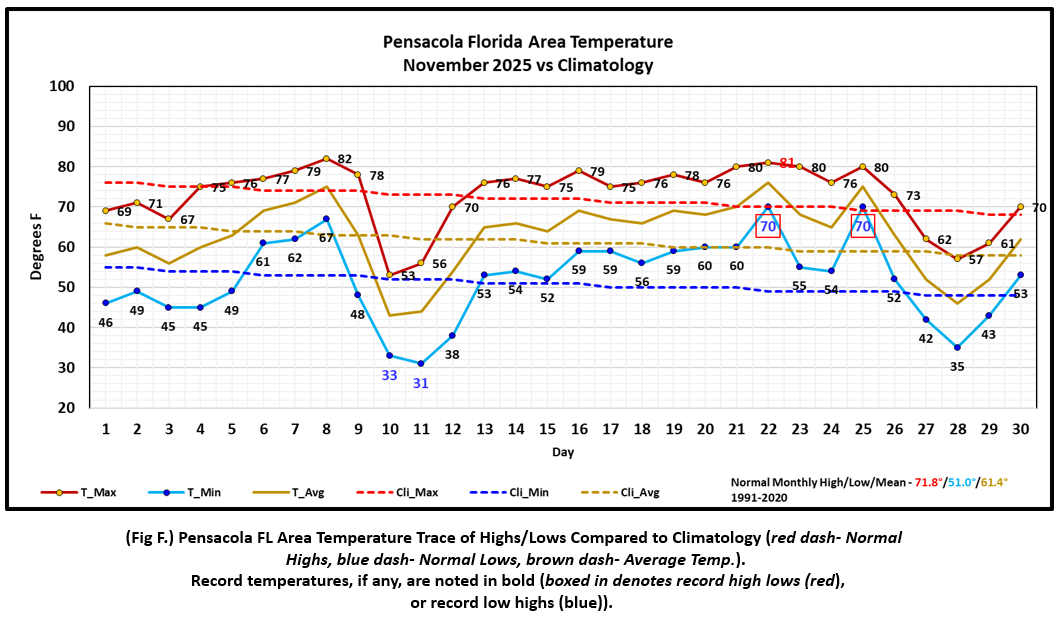
Pensacola Florida Area [Climate Normal Period 1991-2020, Climate Record Period 1879 to Present] - The average monthly high of 72.8° was 1.0° above normal. The average monthly low of 52.0° was 1.0° above normal. The average monthly temperature of 62.4° was 1.0° above normal. The highest temperature for the month was a toasty 82° on the 8th, 8° above the normal for the date. The lowest temperature for the month dipped to 31° on the morning of the 11th and an astounding 21° below normal for this date. This was also one of two record setting low temperatures for the month. There were three other record temperatures for the month. A breakout of all the record temperatures are listed:
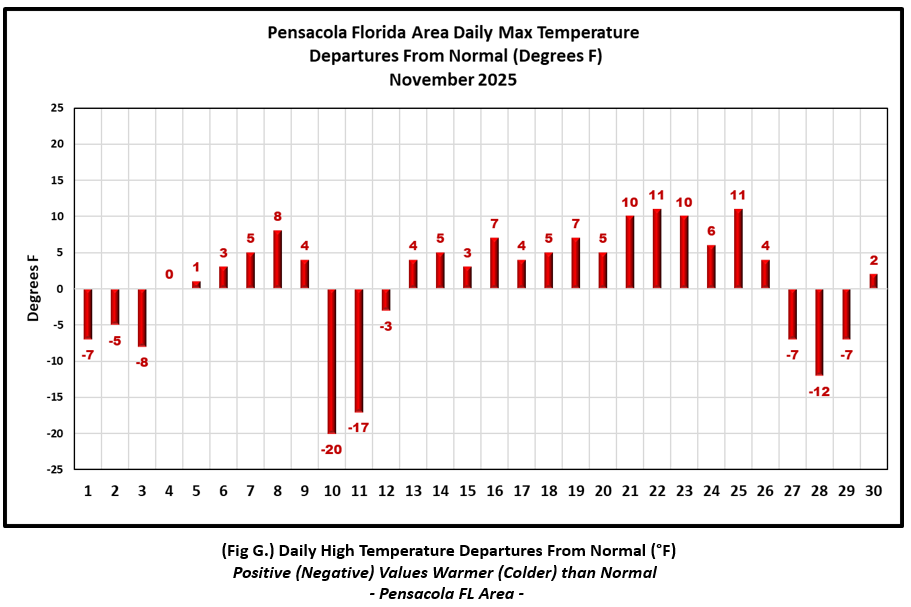
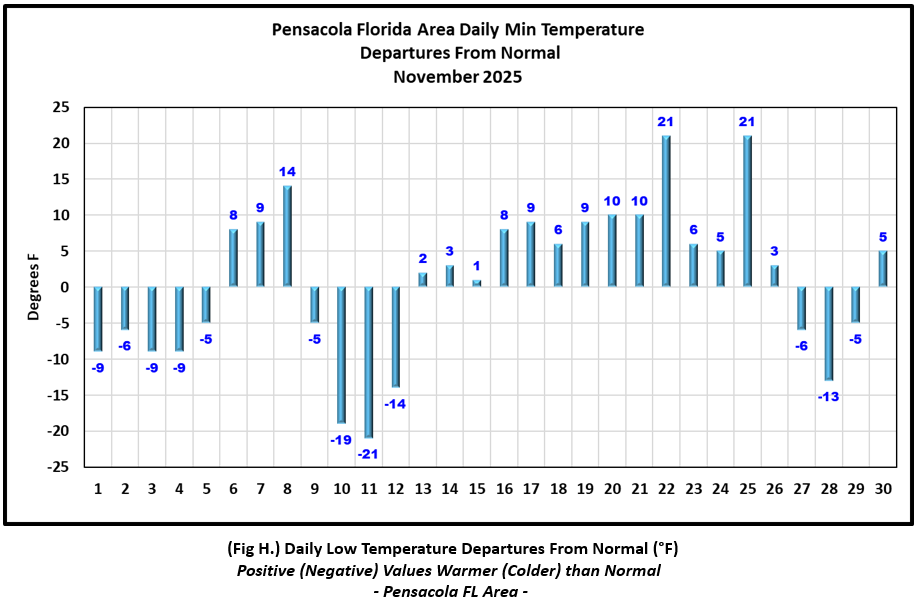
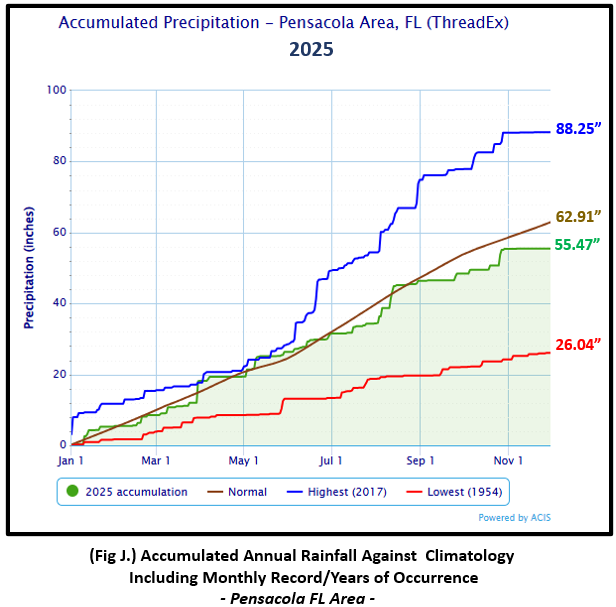
(Fig. F) shows a graphical representation of how the Pensacola area temperatures compared to the seasonal normal daily highs and lows, which are shown by the colored dashed lines. (Figs. G and H) shows the daily high/low temperature departures from normal. The rain gauge captured a minuscule and new record monthly low 0.08" (Fig. I), or 4.34" below the monthly normal. Considering the lack of rainfall for the month, the annual rainfall deficit at Pensacola has ballooned to over seven inches below normal to date. (Fig. J).
November Top Records for the Month During the Period of Record for the Pensacola Area:
Click on the Pensacola Florida area climate graphics below to expand:
|
|
|
|
|
Additional November 2025 Climatology and Topics
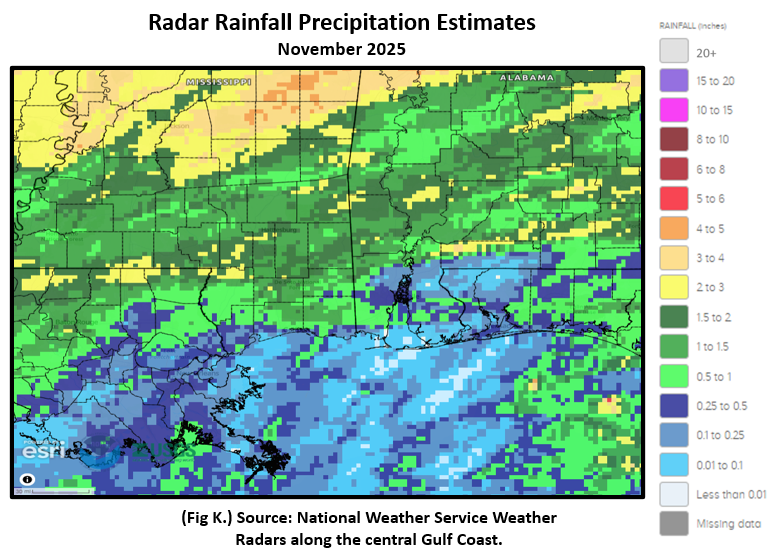
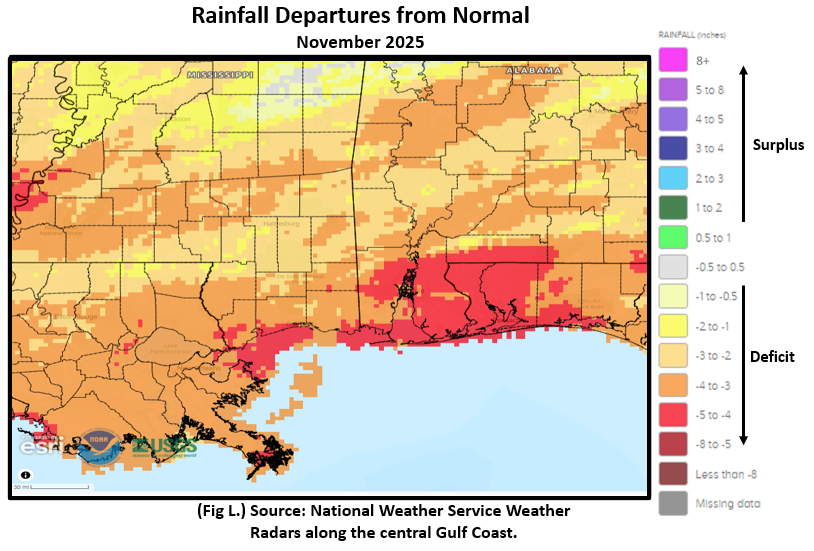
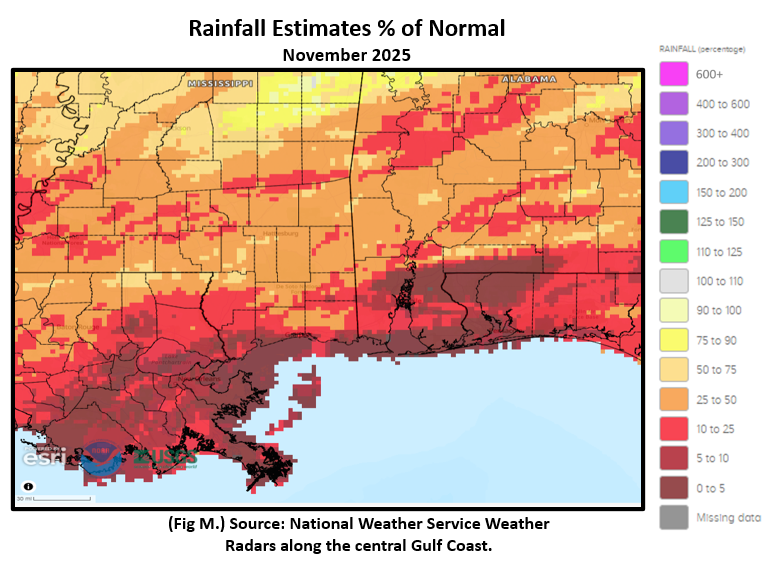
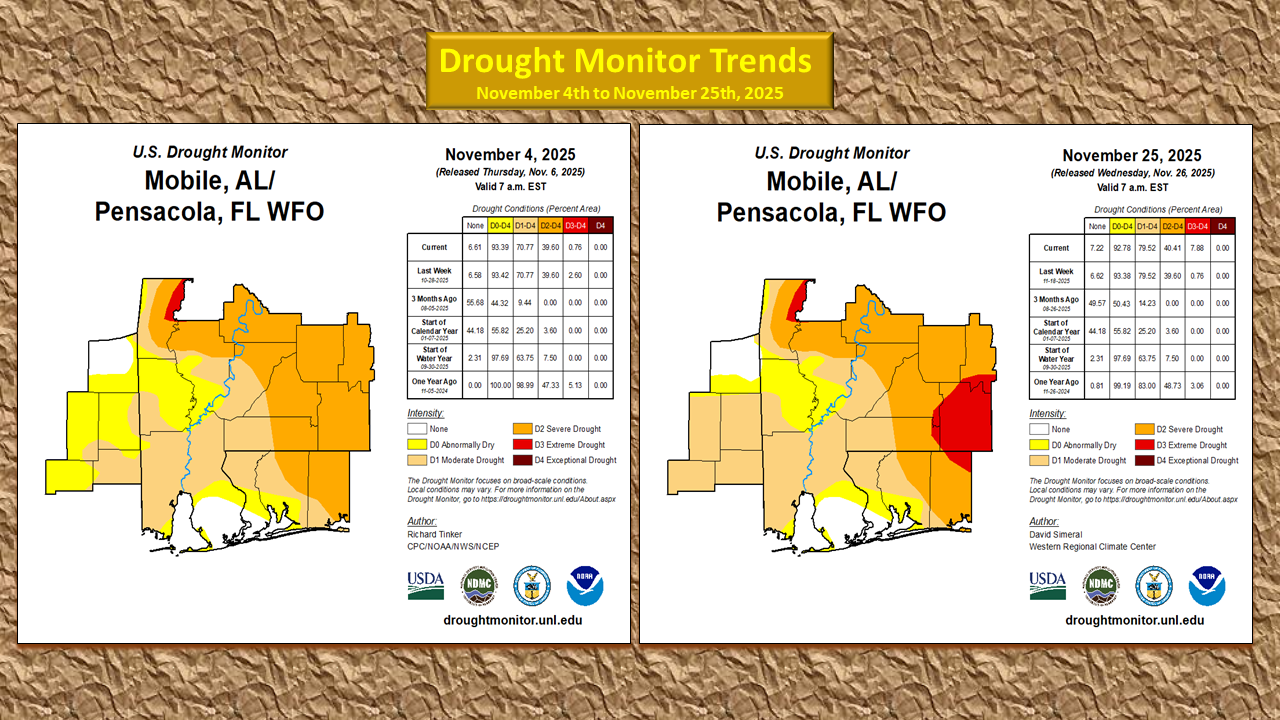
The lack of rainfall over the deep south was notable with much of the coastal zones seeing 10% or less of normal November rainfall. Much of the remainder of the area at 50% or less. Fig. K shows the areal monthly rainfall total, Fig. L shows the areal rainfall departures from normal and Fig. M, the areal percent of normal rainfall. With the large shortage of November rainfall, drought intensities worsened through the month.
|
|
|
|
December 2025 Climatology, Seasonal Climatology and Outlooks:
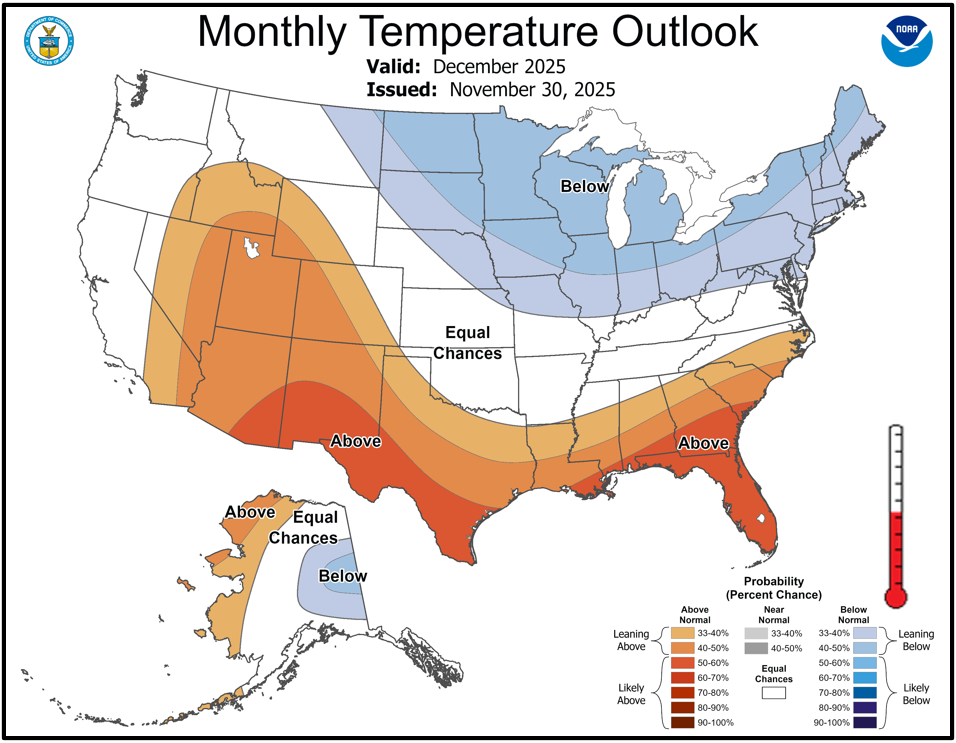
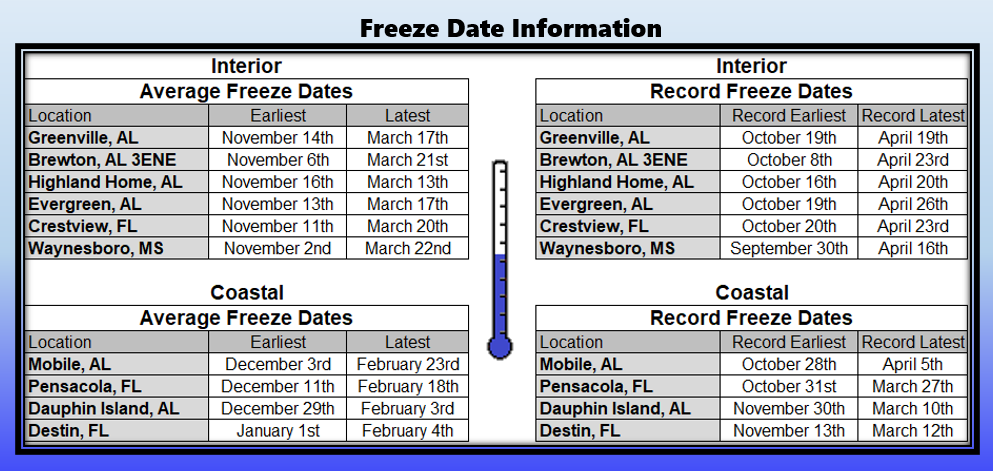
The latest outlook for December indicates a weather pattern which favors a continuation in temperatures favored to be above normal for the month. The precipitation outlook is promising, leaning above normal over much of the local area. Although the 2025 Atlantic Basin Hurricane Season fell within NOAA's predicted ranges, there were some notable contrasts. Refer to the 2025 Atlantic Basin Hurricane Season Recap for the details. Freeze date and drought information is provided in the tables below.
Click on the snap shots below to expand:
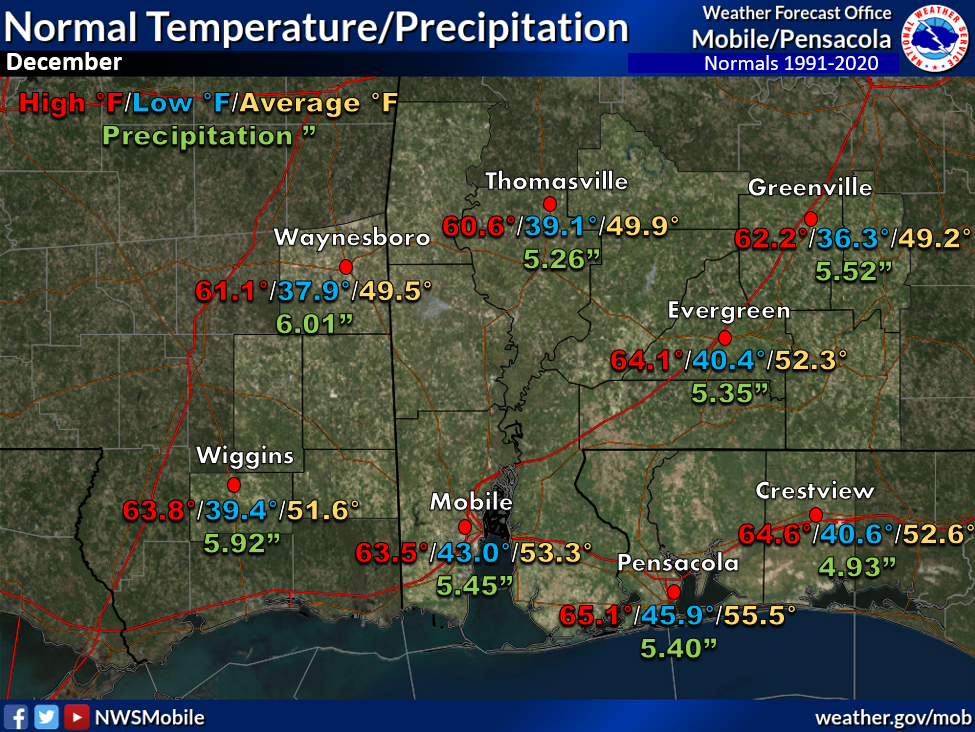 December Normals December Normals |
|
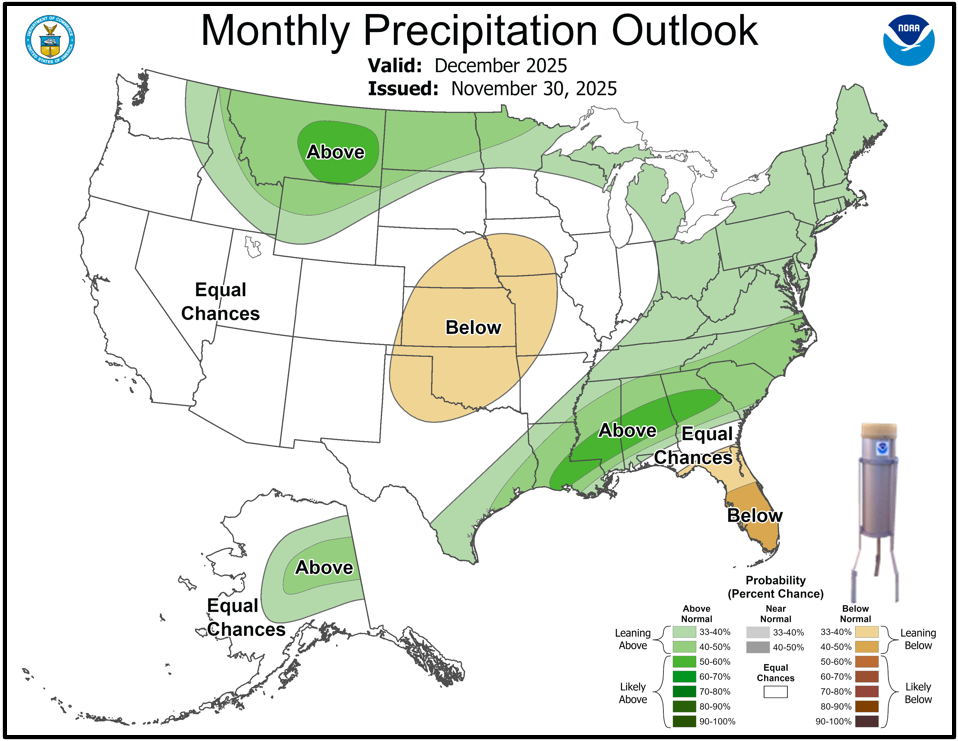
Outlook |
|
|
Additional Climate Links:
The National Weather Service Mobile Alabama's Climate and Past Weather page provides climate data at your fingertips for many observation points in the local forecast area by accessing the NOWData tab as well as many other climate resources. The Climate Prediction Center Link provides short and longer range climatic outlooks and education about the larger scale global circulations that impact temperatures and weather. With the large agriculture and farming presence along the central Gulf coast, the Drought Monitor link provides updates on drought trends and impacts. Please refer to NWS Mobile's Drought Information Statements and Archives on drought details, impacts, outlooks. Another very helpful resource is the Community Collaborative Rain Hail and Snow (CoCoRaHS) network, which is a large group of volunteers working together to measure and map precipitation (rain, hail and snow). The aim of CoCoRaHS is to provide the highest quality data for natural resource, education and research applications. You can be a part of the CoCoRaHS team by becoming a volunteer rainfall observer.