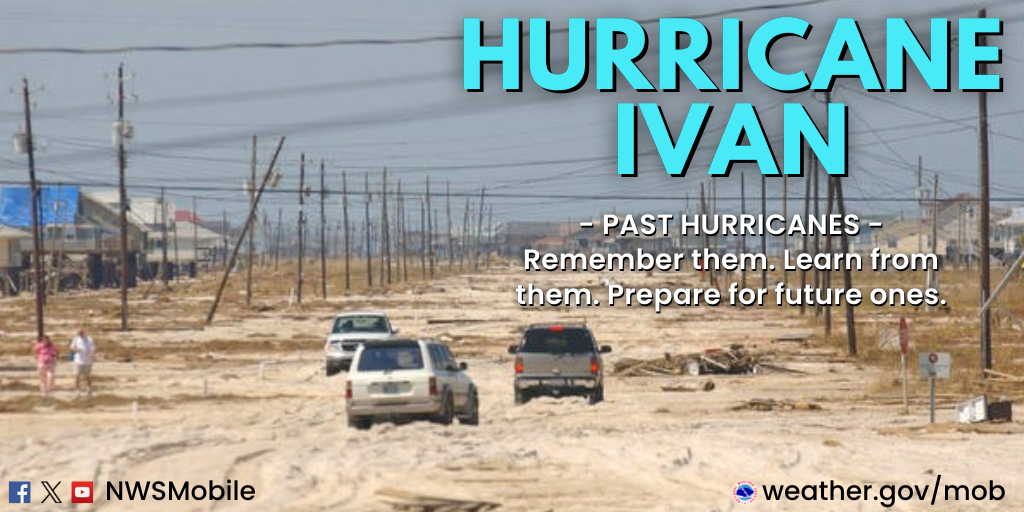
Powerful Hurricane Ivan Slams the Central Gulf Coast
as a Category 3 Hurricane
September 16, 2004
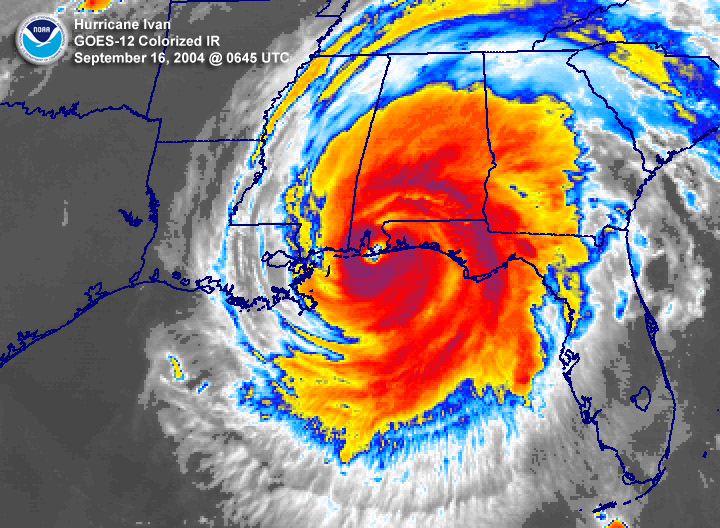
At 150am on 16 September 2004, powerful Hurricane Ivan made landfall just west of Gulf Shores, AL as a Category 3 Hurricane.
View of the northern eyewall making landfall.
Ivan packed 120 mph sustained surface winds and a historic storm surge, the magnitude and extent of the damage and destruction over Baldwin County in Alabama and Escambia and Santa Rosa Counties in
northwest Florida exceeded that of both Hurricane Frederic (September 1979) and Hurricane Opal (October 1995).
Hurricane Ivan may rival the magnitude of damage and destruction caused by the Hurricane of 1926 which ravaged the counties east of Mobile Bay. A total of 8 deaths in the western Florida Panhandle (7 in Escambia County and 1 in Santa Rosa County) were the direct result of Hurricane Ivan. Damage was estimated near 14 billion US dollars.
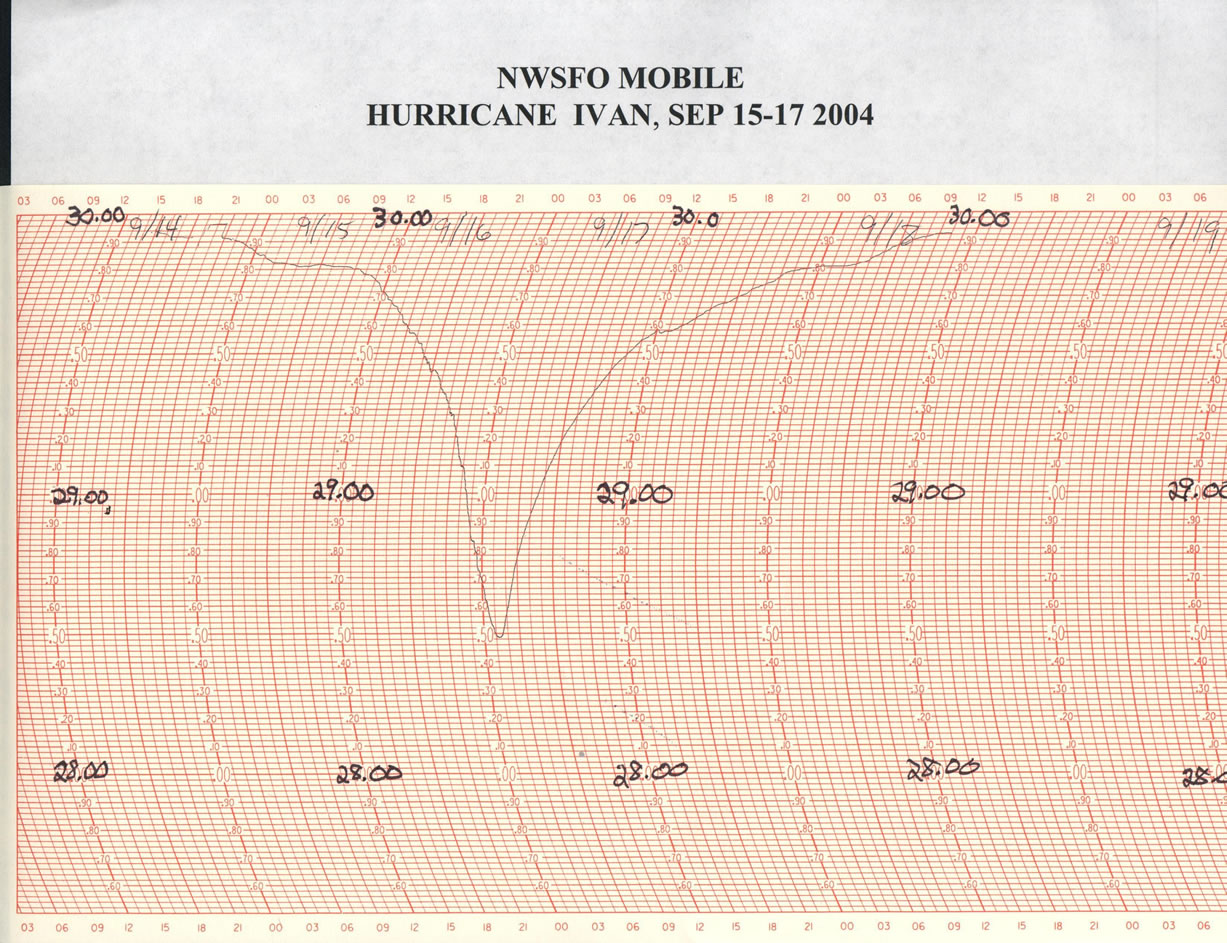
This microbaragraph shows the pressure with time as the western eyewall approached the National Weather Service Office in Mobile, AL. The observed minimum central pressure was 28.48 inches (or 964mb). Brookley Field (not shown) was located 32 miles northwest of the eye and measured 28.23 inches (or 956mb) of pressure. The minimum central pressure measured by NOAA Research Aircraft at the time of landfall was 27.85 inches (or 943mb). Note: there was a 13mb pressure difference over a straight line from Brookley Field (northwest Mobile Bay) to the center of Ivan located over extreme southeastern Mobile Bay.
This webpage will remain focused on Hurricane Ivan's impacts across southwestern Alabama and the northwestern Florida Panhandle. Below are some of the regional impacts...
Jump to - Wind, Storm Surge, Rainfall, Animations, Imagery, or Additional Information sections
WIND
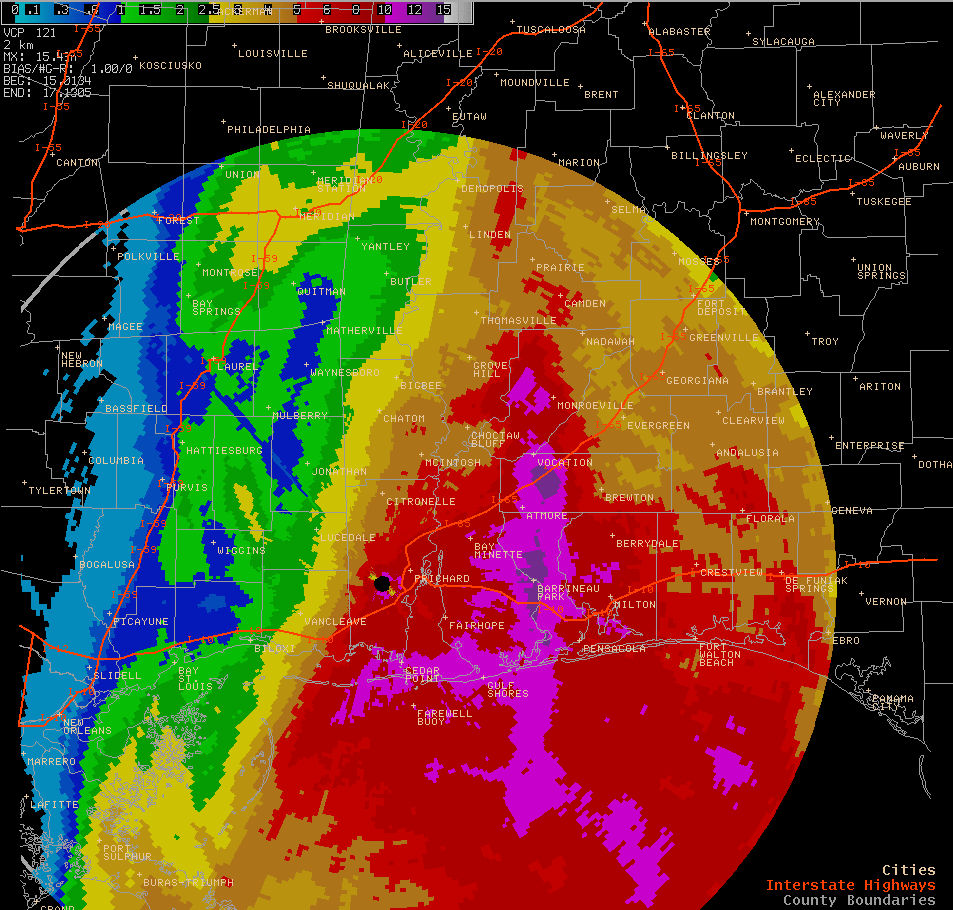
Table 1 below gives hourly 0.5 degree radar reflectivity images taken from the National Weather Service Doppler Weather Radar in Mobile, AL (KMOB) prior to, during and after landfall. View an animated hourly radar loop of Hurricane Ivan.
Table 1 - Hourly radar reflectivity images (0.5 deg) taken from the NWS Doppler Radar in Mobile, AL (KMOB) prior to, during and after landfall.
9pm CDT 10pm CDT 11pm CDT Midnight N Eyewall Landfall
(1251am CDT)1am CDT Eye Landfall
(2am CDT)3am CDT 4am CDT 5am CDT 6am CDT 7am CDT 8am CDT 9am CDT
As a major characteristic of most landfalling hurricanes, Ivan's maximum surface winds occurred within the right front quadrant of the storm (or northeast of Ivan's center given the orientation of approach in this case) just prior to and after landfall.
WSR-88D radar reflectivity location of strongest surface winds at the time of landfall.
WSR-88D radar velocity location of strongest surface winds surrounding landfall or 8 min resolution .gif (large)
or 4 min resolution .gif (very large).
Note: large area of 124 knot winds at 3000 feet above ground northeast through east with respect to Ivan's center.A loss of power and phone lines well before landfall rendered many observational platforms unable to continue logging data. Table 2 shows information on regional peak wind gusts during this event. Click on the buoy and Dauphin Island, Alabama C-MAN locations in Table 2 to view time series plots of sustained wind speeds, wind gusts and wave heights. You may note upon observing Buoy 42040 (70 miles south of Dauphin Island, AL) that significant wave heights reached a maximum of 52 feet (not to be confused with storm surge along the coast). Buoy 42040 later went adrift from its mooring. Note: most of the peak wind gust data was obtained from the relatively weaker west side of Ivan. Although there are no surface wind observations available over inland southwestern Alabama, an estimated 80-100 mph winds near Ivan's center caused major tree and structural damage along his path over Escambia, Conecuh, Monroe and Wilcox counties of Alabama.
*** Indicates Eglin Air Force Base, FL Wind Sensor
Location Peak Wind Gust Value (mph) Time Location Peak Wind Gust Value (mph) Time
Baldwin County, AL145 unknown 2 SW Mary Esther, FL
200' high over Gulf119 350am Buoy 42040
70mi south of Dauphin Island, AL85 15th at 443pm Gulf Shores Airport, AL
DOW115 unknown Buoy 42007
20mi south of Ocean Springs, MS78 1242am Pensacola Naval Air Station, FL
KNPA107 138am Mobile, AL
KMOB, Bates Field75 212am Pensacola, FL
10m Gill106 144am Mobile, AL Downtown
WKRG Studios74 104am Battleship Park, AL
on Mobile Bay105 135am
(no data after)Fairhope, AL
AWIS72 15th at 1118pm Dauphin Island, AL
C-MAN102 15th at 1029pm Grand Bay, AL 71 1217am Pensacola Airport, FL
KPNS101 150AM
(no data after)8 SW Mossy Head, FL 69 1210am 10 S Harold, FL *** 90 1210am Spanish Fort, AL 59 300am Fairhope, AL
10m Gill89 144am Semmes, AL
AWIS59 1230am 10 N Mary Esther, FL *** 86 1230am Grand Bay, AL
RAWS58 1217am 5 NE Seminole, FL *** 86 440am Semmes, AL
NWS Mesonet56 midnight Evergreen, AL
KGZH47 1253am
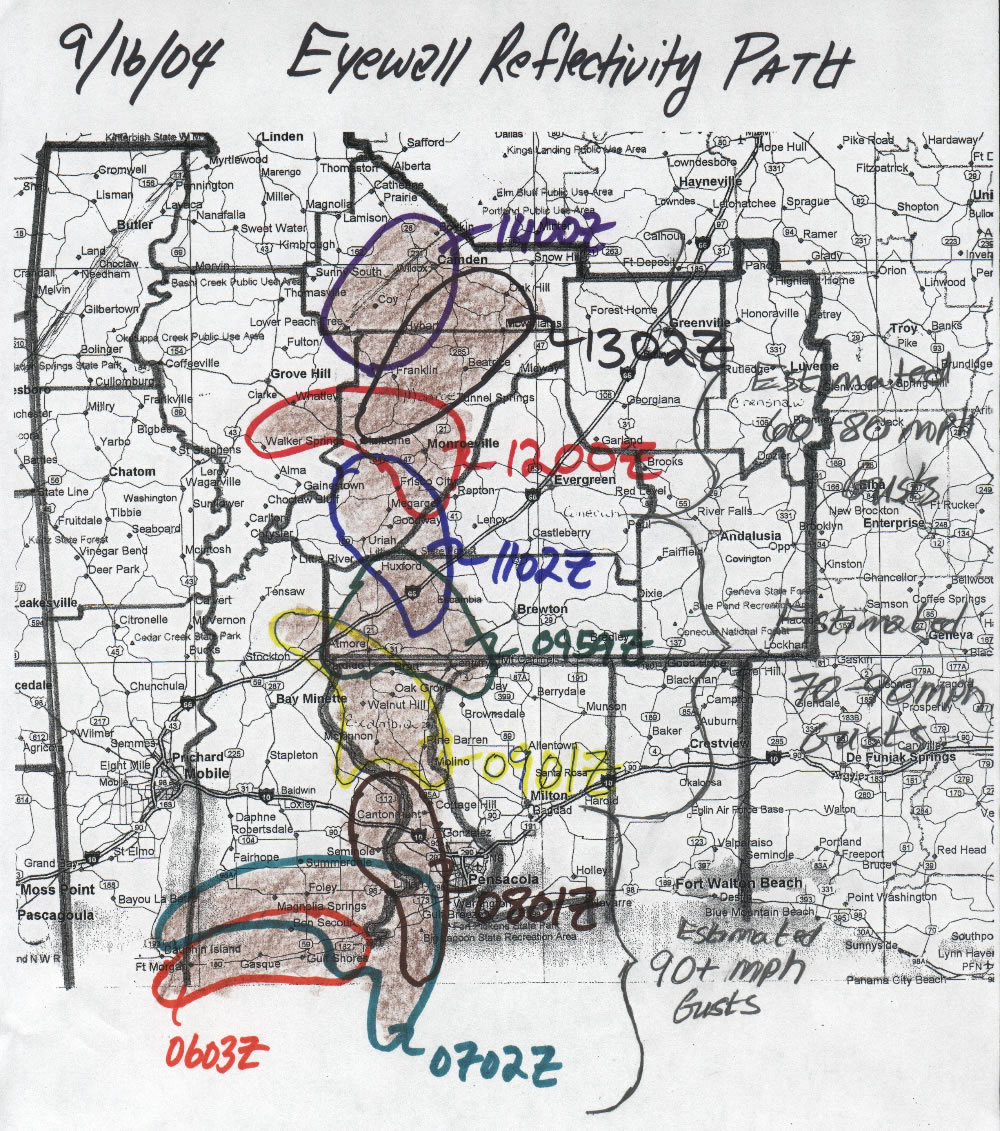
Ivan's path of destruction did not stop in the coastal counties, however. The winds around the center of a landfalling hurricane can remain above hurricane force (> 74 mph) well inland (and most certainly in higher gusts). That was certainly the case with Ivan.
Path of Ivan traced out by the highest radar reflectivities (> 50 dBZ, obtained from the KMOB WSR-88D)
In these intense squalls very near the eyewall, higher winds just above the surface are efficiently transported down to the ground. As one can see in the above figure, Ivan carved a path of wind destruction as it moved well away form the coast. The National Weather Service in Mobile, AL issued Inland Hurricane High Wind Warnings for the affected counties well in advance of Ivan's arrival into inland southwest Alabama.
STORM SURGE
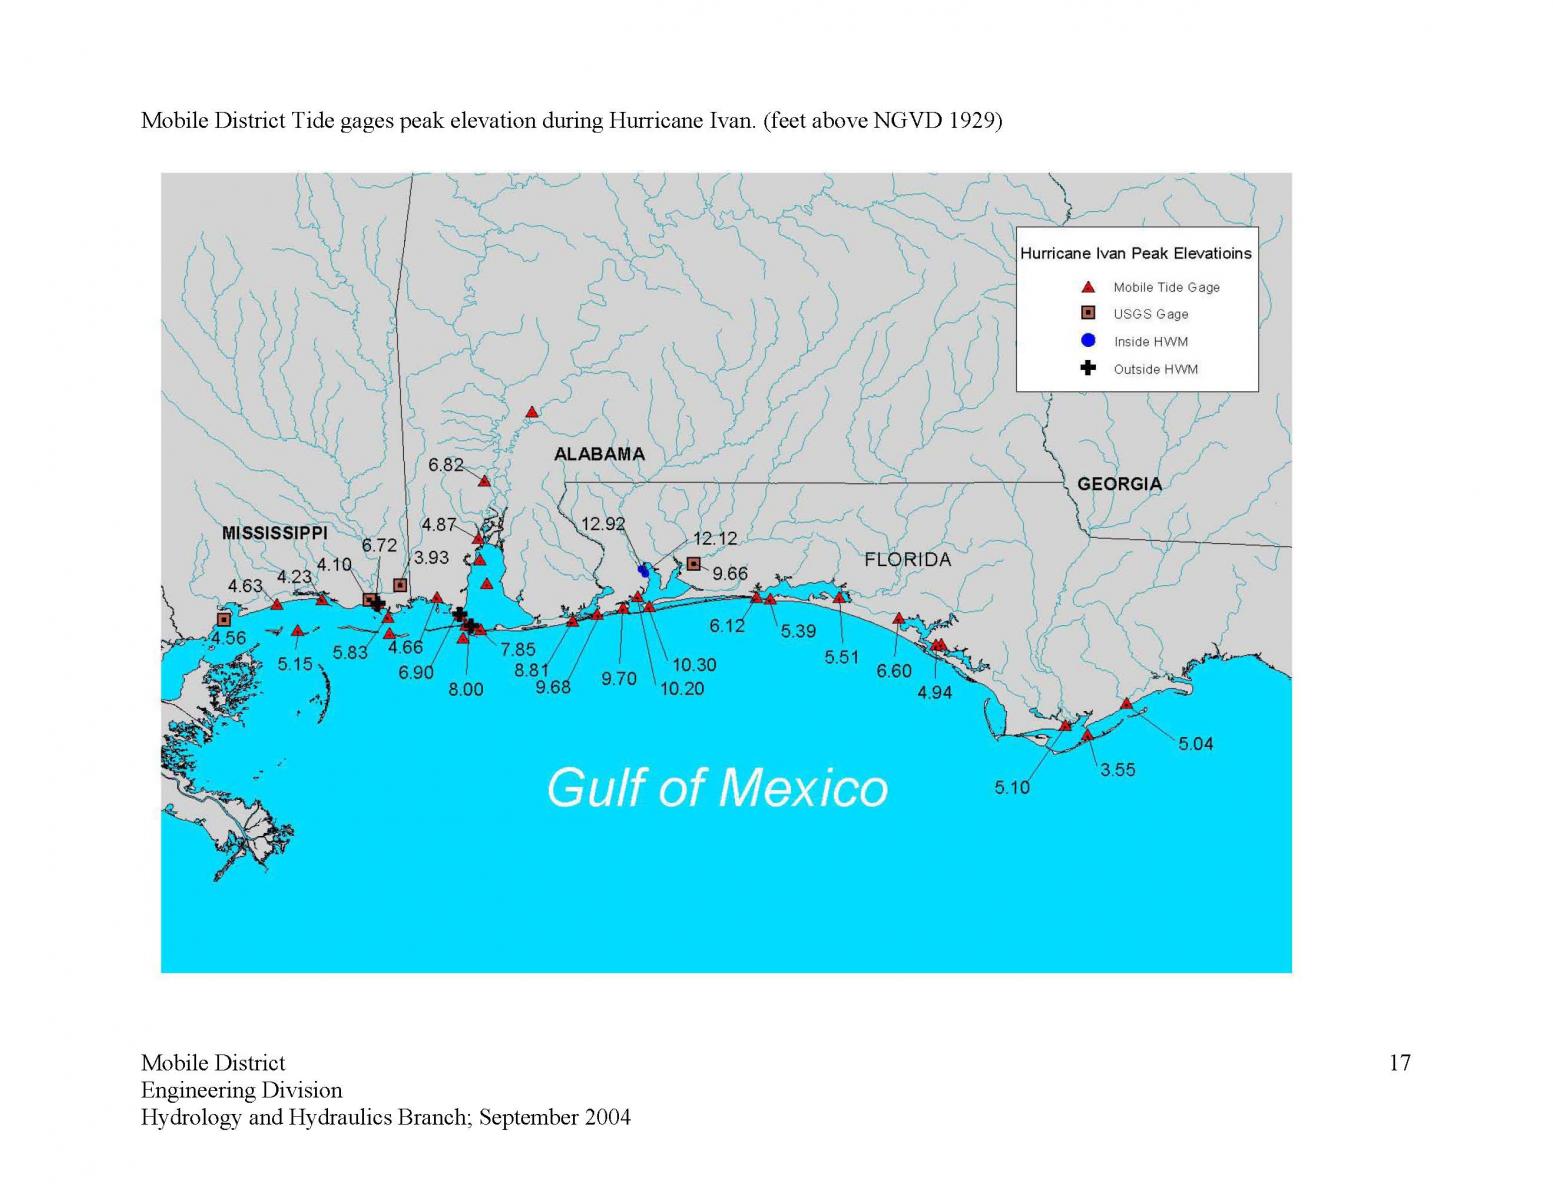
Table 3 shows regional storm surge information obtained from various tide gauges. The maximum surge along this stretch of coastline ranged from 10-15 feet. Fortunately, for downtown Mobile, AL, the center of Ivan passed to the east preventing nearly 16 to 18 feet of devastating storm surge, which would have happened if Ivan would have made landfall west of Mobile Bay
Table 3 - Observed storm surge data during Hurricane Ivan. Courtesy of US Army Corps of Engineers, Mobile District.
1 USGS gage 2 Outside High Water Mark 3 Inside High Water Mark
Tide Gage Designation
Peak During
Ivan (ft-NGVD)Peak During
Georges (ft-NGVD)Peak During
Opal (ft-NGVD)Peak During
Frederic (ft-NGVD)1Mississippi Sound at Waveland, MS (USGS)
4.56
Gulfport Harbor at Gulfport, MS (540)
4.63
7.05
2.98
Mississippi Sound at Ship Island
5.15
Biloxi Bay at Point Cadet
4.23
7.17
Back Bay Biloxi at Biloxi, MS
8.05
1West Pascagoula River at Hwy 90 at Gautier, MS
4.10
2Pascagoula River (NOAA) at Pascagoula, MS
6.72
8.36
5.78
Mississippi Sound at Pascagoula PI- Rear Range
5.83
Mississippi Sound at Petit Bois Island
4.83
1Escatawpa River at I-10 nr Orange Grove, MS
3.93
Middle Gage at Bayou LaBatre
4.66
8.27
2Mobile Bay at Cedar Point, AL
6.90
5.60
3Dauphin Island Bay at Dauphin Island
7.80
5.00
4.50
7.80
2Mobile Bay at Dauphin Island (USCG)
8.00
4.59
Mobile River at Mobile, AL
4.87
8.94
Mobile River at Bucks, AL (Barry Steam Plant)
6.82
Mobile Bay at Ft Morgan Front Range
7.85
Mobile Bay at Middle Bay Light House
Perdido Pass Orange Beach, AL
8.81
5.58
5.40
7.10
GIWW at Pensacola Gulf Beach, FL
9.68
3Pensacola Bay at Ft. McRee, FL (USCG)
9.70
7.50
3Pensacola Bay at Pensacola, FL (NOAA)
10.20
6.20
3Escambia Bay West Bank at HWY 90
12.92
3Escambia Bay West Bank 1.5 miles N of I-10
12.12
3GIWW at Gulf Breeze, FL
10.30
6.30
1Yellow River near Milton, FL
9.66
Fort Walton Brooks Bridge
6.12
5.80
Destin at Choctawhachee Bay (USCG)
5.39
4.60
6.80
3.28
GIWW at Choctawhachee Bay (HWY 331)
5.51
GIWW at West Bay, FL (HWY 79)
6.60
St Andrew Bay at Panama City, FL
4.94
3.51
Watson Bayou at Panama City, FL
6.92
Apalachicola River at Apalachicola, FL
5.10
4.52
6.40
GIWW at St. George Island, FL
3.55
Carrabelle River at Carrabelle, FL
5.04
4.58
5.54
RAINFALL
Regarding rainfall, the highest amounts occurred east of Ivan's center as it moved northward into southwestern Alabama.
Storm Total Precipitation measured by the Mobile, Alabama WSR-88D. The time span of rainfall ranges from September 14th at 734pm to September 16th at 429pm. The absence of shower and storm activity prior to the arrival of Ivan's significant rainbands means that this time period captured nearly all the event rainfall associated with Ivan. The radar-estimated data shows a large swath of greater than 5 inches of rain over coastal Alabama and the extreme western Florida Panhandle.
Fortunately, due to Ivan's relatively fast northerly motion (13-16mph) after landfall, rainfall amounts were limited compared to some past tropical systems (eg. Hurricane Danny 1997 which deposited nearly 43 inches of rain over a two day period while over southwestern Mobile Bay). A narrow swath of heavy rain occurred about 15 miles either side of a line from Orange Beach, AL to Barrineau Park, FL to Atmore, AL to just west of Monroeville, AL. Along this line, radar estimated between 10-15 inches of rain. Rainfall amounts were much less west of I-65 in Alabama where 2-4 inches of rain fell.
Table 4 - 48 hour rainfall totals ending 7pm CDT on September 16 for select locations.
NOTE: lesser amounts were west of Ivan's track
Location 48hr Rainfall (in.) ending
September 16 - 7pm CDTLocation 48hr Rainfall (in.) ending
September 16 - 7pm CDTPensacola, FL (WEAR Studios)
15.79
Niceville, FL
6.55
Silverhill, AL (3S)
10.16
Mobile, AL (7S KMOB)
6.53
Andalusia, AL (HAM)
9.96
Munson, FL
6.50
Mobile, AL (2S KMOB)
9.90
Mobile, AL (3S KMOB)
6.30
Mossy Head, FL (10S)
8.92
Coden, AL (NWS COOP)
6.30
Crestview, FL (HAM)
8.40
Ft. Walton, FL (HAM)
6.06
Seminole, FL (5 NE)
8.10
Harold, FL (10S)
5.72
Mobile, AL (10S KMOB)
8.00
Mobile, AL (Bates Field, KMOB)
5.56
Pensacola Naval Air Station (NPA)
8.00
Semmes, AL
5.00
Daphne, AL
7.50
Richton, MS (NWS COOP)
4.50
Valparaiso, FL (Eglin AFB, KVPS)
7.43
Thomasville, AL (NWS COOP)
4.20
Evergreen, AL (NWS COOP)
7.25
Dothan, AL (KDHN)
3.21
Alberta, AL
6.85
Troy, AL (KTOI)
2.90
Animations
Animated Radar Imagery
Animated Satellite Imagery
Colorized IR Satellite Loop
Imagery
📸 NWS Mobile Storm Survey Photos
Interactive Map of Hurricane Ivan Track
NOAA Coastal Aerial Photos
USGS Oblique Aerial Photos
NASA 3D Tropical Rainfall Measuring Mission (TRMM) into Ivan
NASA 3D Tropical Rainfall Structure with Cloud Overlay
Pre- and Post-Ivan 3D Topography - Orange Beach & Gulf Shores, AL
Before and After Photos from Gulf Shores and Pensacola (NASA)
More Information (Technical Papers and Assessments)
NWS Mobile Post-Tropical Cyclone Report (PSH) - Hurricane Ivan
NHC Advisory Archive
NHC Tropical Cyclone Report - Hurricane Ivan
NWS Ivan Local Write-Ups and Webpages:
NWS Jackson
NWS Birmingham
NWS Huntsville
NWS Nashville
NWS Blacksburg
Acknowledgements: Page created by Jeffrey Medlin (MIC), Ray Ball (ITO), and Gary Beeler (former WCM) with contributions from members of the NWS Mobile staff. MVERIFY buoy and C-MAN time series provided by David Eversole (senior forecaster). Updated by Morgan Barry (senior forecaster) and Don Shepherd (senior forecaster).
LAST UPDATED: September 2024


