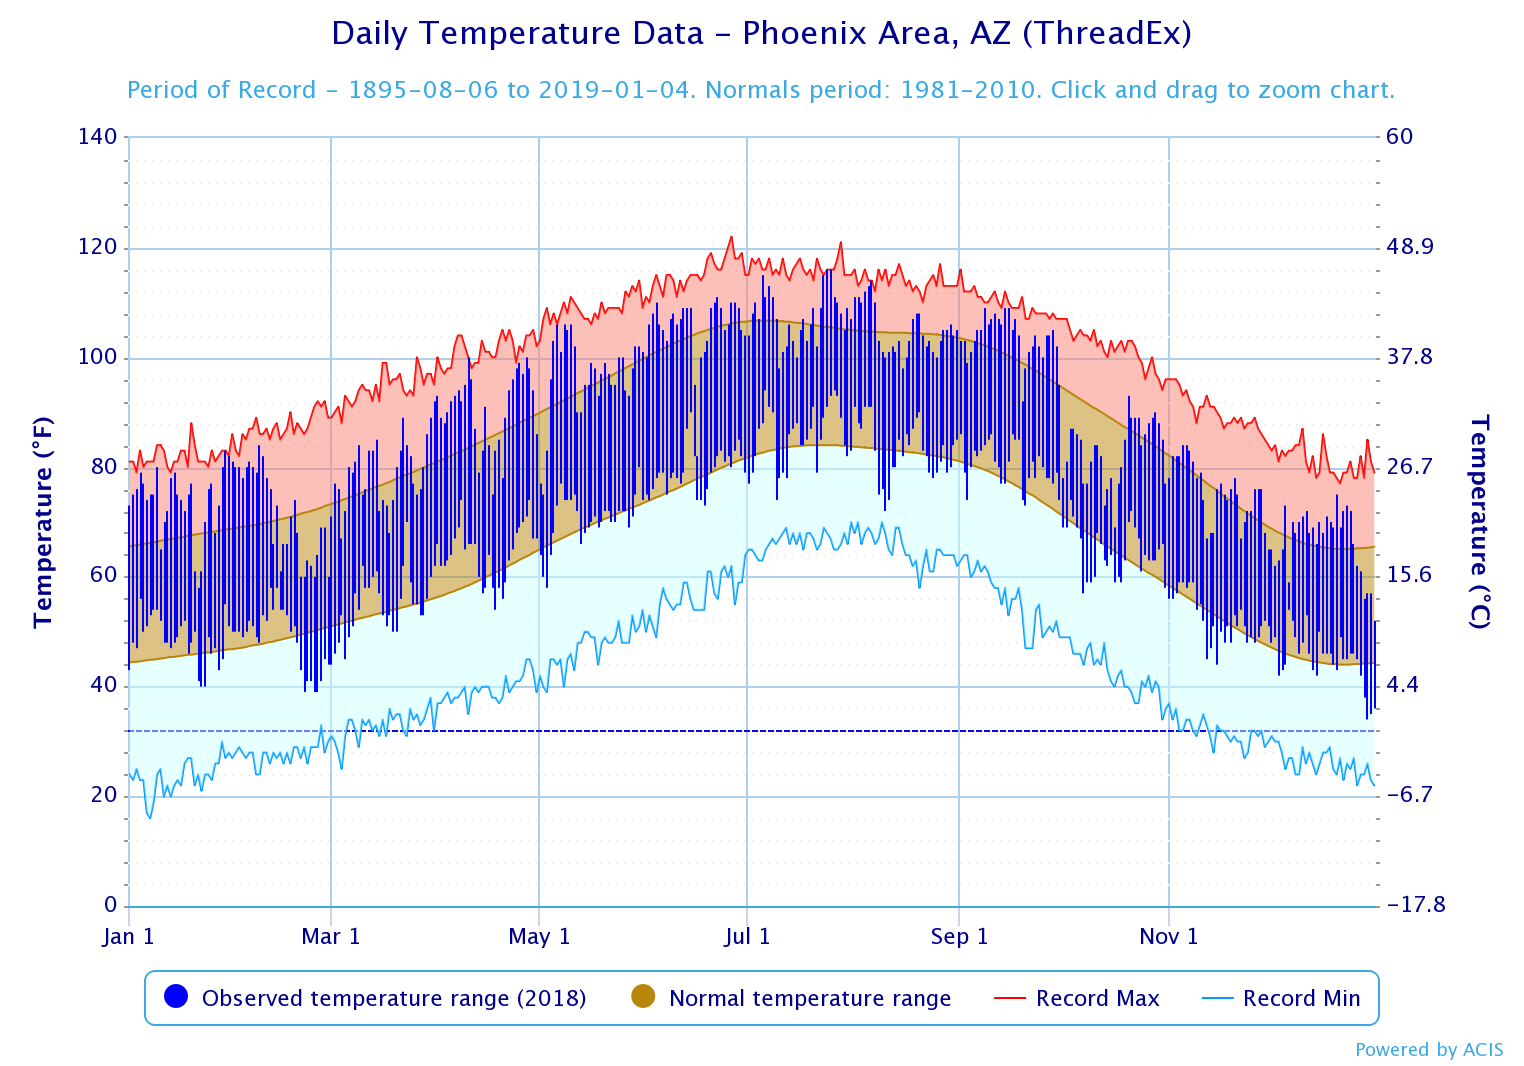
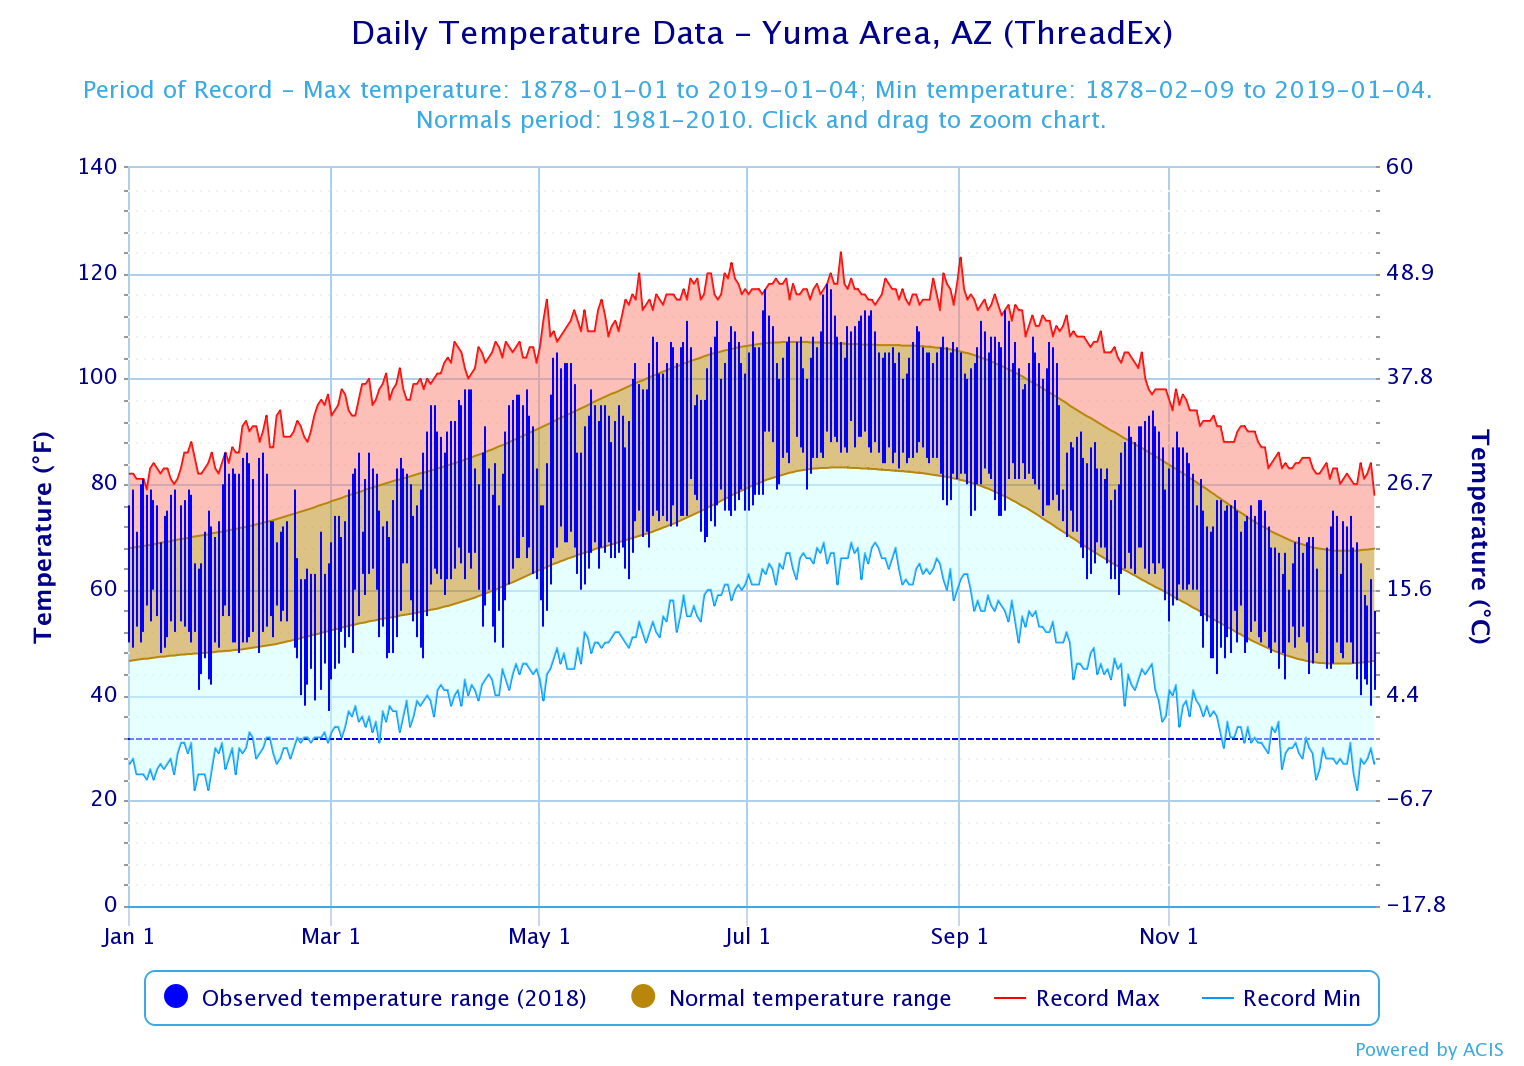
The year 2018 ended up being the 7th warmest year recorded in the history of central Arizona (Phoenix), and the 8th warmest recorded for southwest Arizona (Yuma). In fact, the year will likely go down as one of the top 5 warmest for the state as a whole after all data are compiled. Records for Phoenix began in 1896, first taken in downtown and since moved to Sky Harbor airport in the 1950s. Records in Yuma began in 1878.
2018 continued the trend of 2017 with abnormally hot and dry weather persisting through the first half of the year. With minimal snowfall over northern Arizona and only a few days of light rain elsewhere, severe to extreme drought spread across the region by the spring.
Monsoon season started somewhat slow for southern and central Arizona, however the first in several rounds of strong storms erupted in mid July. On July 9th, a massive dust storm rolled all the way from Phoenix to Yuma. Isolated storms periodically impacted the region through the remainder of July including several clusters of severe storms on July 30th. Storms continued to produce damage through the beginning of August with another large dust storm and bursts of severe winds on the 2nd.
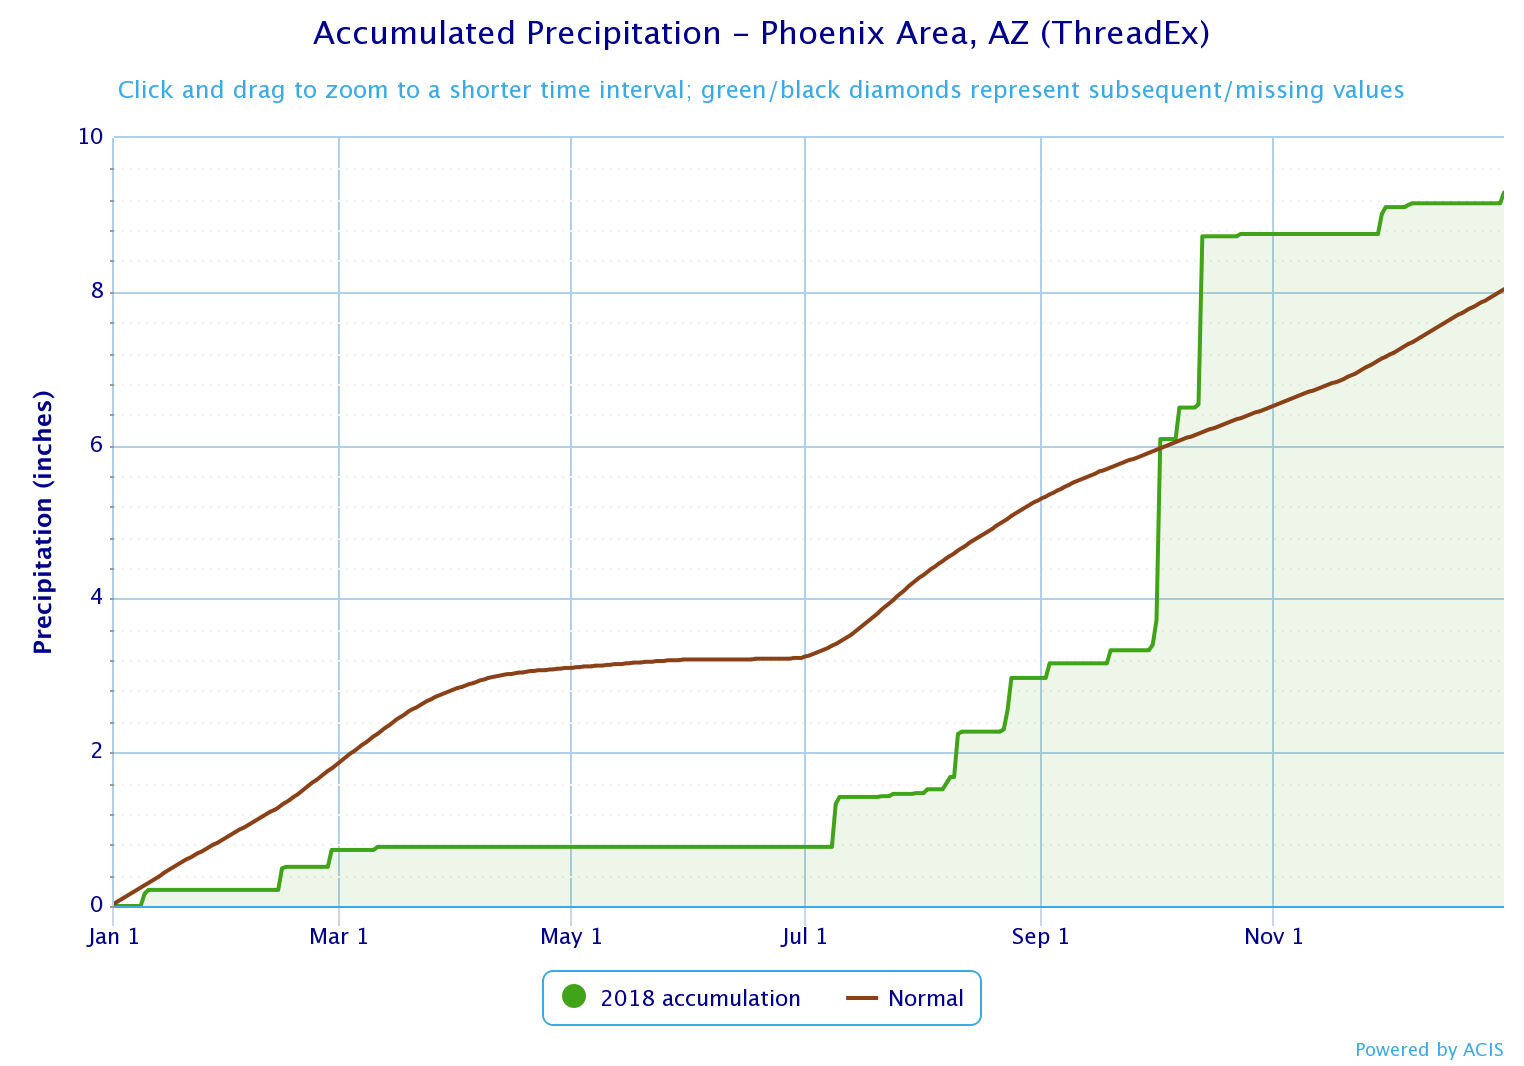
Despite all the pronounced dry weather during the first part of 2018, most will likely remember the few days with excessive, record setting rainfall this past year. One event occurred in the late evening hours of August 9th where isolated instances of incredibly heavy rainfall was reported in the Phoenix metro. However, the greatest impact in area and magnitude occurred on Oct 2nd resulting from the remnants of Hurricane Rosa. This event set a daily record for the wettest day in the month of October, and further rainfall the next couple weeks culminated in the wettest October on record for Phoenix. And not to be outdone, a small tornado actually formed in Glendale AZ on October 23rd.
|
|
2018
|
Value
|
Rank
|
|
Avg High
|
|
|
|
Avg Low
|
|
|
|
Avg Temp
|
|
|
|
Rain
|
|
|
|
2018
|
Value
|
Rank
|
|
Avg High
|
|
|
|
Avg Low
|
|
|
|
Avg Temp
|
|
|
|
Rain
|
|
|
***Please note all climatic data are considered preliminary until validated by the National Centers for Environmental Information***
|
Phoenix Annual Temperature Rankings (Warmest Years)
| Year |
Avg Daily Temp |
| 2017 |
77.3
|
| 2014 |
77.1
|
| 1989 |
76.9
|
| 2016 |
76.7
|
| 2015 |
76.7
|
| 2012 |
76.7
|
| 2018 |
76.4
|
| 2007 |
76.4
|
| 2003 |
76.3
|
| 2009 |
76.0
|
|
| Year |
Avg Max Temp |
| 1989 |
89.8
|
| 2017 |
89.1
|
| 2014 |
88.9
|
| 2012 |
88.7
|
| 2016 |
88.5
|
| 1934 |
88.3
|
| 2018 |
88.1
|
| 2015 |
88.0
|
| 2002 |
88.0
|
| 1988 |
88.0
|
|
| Year |
Avg Min Temp |
| 2017 |
65.4
|
| 2015 |
65.4
|
| 2014 |
65.4
|
|
2016
|
65.0
|
| 2003 |
64.9
|
| 2007 |
64.8
|
|
2018
|
64.7
|
| 2012 |
64.7
|
| 2001 |
64.4
|
| 2005 |
64.3
|
|
|
|
Avg Max Temp
|
Highest
Temp
|
Avg Min Temp
|
Lowest Temp
|
Avg Temp
|
Rank (1=Warmest, 122=Coldest)
|
| Jan |
73.9
|
83 on the 29th
|
48.5
|
40 on the 22nd & 23rd
|
61.2 /+4.8
|
3rd
|
| Feb |
71.1
|
84 on the 8th
|
48.4
|
39 on the 24th & 25th
|
59.8 /+0.1
|
Tied 34th
|
| Mar |
78.8
|
92 on the 31st
|
54.9
|
44 on the 1st
|
66.8 /+1.6
|
17th
|
| Apr |
90.6
|
100 on the 10th & 27th
|
64.3
|
54 on the 18th
|
77.4 /+4.7
|
3rd
|
| May |
96.6
|
106 on the 8th & 10th
|
70.5
|
58 on the 3rd
|
83.5 /+1.4
|
12th
|
| Jun |
105.4
|
111 on the 22nd
|
79.3
|
73 on the 18th
|
92.4 /+1.6
|
17th
|
| Jul |
107.6
|
116 on the 24th & 25th
|
85.5
|
74 on the 9th
|
96.5 /+1.7
|
Tied 7th
|
| Aug |
105.0
|
114 on the 6th
|
83.1
|
72 on the 10th
|
94.0 /+0.4
|
Tied 20th
|
| Sep |
103.5
|
109 on the 14th & 15th
|
80.2
|
73 on the 20th
|
91.9 /+3.4
|
2nd
|
| Oct |
83.0
|
93 on the 20th
|
64.5
|
57 on the 7th
|
73.8 /-2.9
|
Tied 56th
|
| Nov |
75.4
|
84 on the 5th & 6th
|
52.2
|
44 on the 15th
|
63.8 /-0.3
|
Tied 31st
|
| Dec |
66.5
|
75 on the 20th
|
45.0
|
34 on the 29th
|
55.7 /+0.3
|
Tied 36th
|
(*** click on month for more comprehensive monthly summary ***)
| Date |
Record |
Previous Record |
| Jan 29 |
83 - tied record
|
83 in 1935
|
| Jan 30 |
82 - tied record
|
82 in 1935
|
| Apr 10 |
100 - tied record
|
100 in 1989
|
| May 6 |
106
|
105 in 1947
|
| Jul 23 |
115
|
114 in 2014
|
| Jul 24 |
116 - tied record
|
116 in 2014
|
| Jul 25 |
116
|
115 in 1943
|
| Aug 6 |
114 - tied record
|
114 in 1995
|
| No Record Lows were set in 2018 |
Yuma Annual Temperature Rankings (Warmest Years)
| Year |
Avg Daily Temp |
| 2017 |
77.5 |
| 2016 |
77.2
|
| 2008 |
77.1
|
| 1996 |
77.0
|
| 1995 |
76.8
|
| 1981 |
76.8
|
| 2012 |
76.6
|
| 2018 |
76.5
|
| 1989 |
76.5
|
| 1958 |
76.2
|
|
| Year |
Avg Max Temp |
| 1981 |
91.0
|
| 1950 |
91.0
|
| 1958 |
90.6
|
| 1989 |
90.5
|
| 1954 |
90.5
|
| 1959 |
90.2
|
| 1962 |
90.1
|
|
1960
|
90.1
|
|
2008
|
90.1
|
|
2017
|
90.0
|
|
| Year |
Avg Min Temp |
| 2017 |
64.9 |
| 2016 |
64.7
|
| 1996 |
64.4
|
| 2008 |
64.2
|
| 2005 |
64.2
|
| 2003 |
64.2
|
| 2018 |
64.1
|
| 2004 |
64.0
|
| 1997 |
63.9
|
|
1995
|
63.9
|
|
|
|
Avg Max Temp
|
Highest
Temp
|
Avg Min Temp
|
Lowest Temp
|
Avg Temp
|
Rank (1=Warmest, 140=Coldest)
|
| Jan |
75.0
|
86 on the 29th
|
50.9
|
41 on the 21st
|
63.0 /+4.4
|
4th
|
| Feb |
73.5
|
86 on the 4th & 9th
|
48.0
|
36 on the 25th
|
60.8 /-1.1
|
Tied 60th
|
| Mar |
79.6
|
95 on the 30th & 31st
|
54.2
|
43 on the 1st
|
66.9 /-0.3
|
39th
|
| Apr |
90.1
|
98 on the 11th & 27th
|
61.6
|
49 on the 20th
|
75.8 / +2.8
|
13th
|
| May |
94.3
|
105 on the 6th
|
65.8
|
53 on the 2nd
|
80.1 /-1.2
|
37th
|
| Jun |
103.9
|
111 on the 13th & 22nd
|
74.2
|
68 on the 2nd
|
89.1 /+0.1
|
Tied 29th
|
| Jul |
108.2
|
118 on the 24th
|
84.6
|
75 on the 1st
|
96.4 /+1.9
|
Tied 4th
|
| Aug |
106.6
|
113 on the 4th & 6th
|
84.7
|
76 on the 28th
|
95.7 /+1.4
|
Tied 10th
|
| Sep |
104.5
|
113 on the 14th
|
79.0
|
74 on the 13th & 25th
|
91.8 /+2.8
|
5th
|
| Oct |
86.4
|
94 on the 27th
|
65.7
|
58 on the 31st
|
76.0 /-1.5
|
Tied 51st
|
| Nov |
77.8
|
90 on the 3rd
|
53.0
|
44 on the 15th
|
65.4 /-0.3
|
Tied 40th
|
| Dec |
67.0
|
75 on the 19th
|
46.8
|
38 on the 30th
|
56.8 /-0.6
|
Tied 63rd
|
(*** click on month for more comprehensive monthly summary ***)
| Date |
Record |
Previous Record |
| Jan 5 |
81
|
80 in 1918
|
| Jan 29 |
86
|
84 in 1986
|
| Jul 6 |
117
|
116 in 1942 & 1905
|
| Jul 24 |
118
|
117 in 2014 & 1943
|
| Sep 14 |
113
|
112 in 2000
|
| No Record Lows were set in 2018 |
|
Arizona 2018 Average
Maximum Temperature 
|
Arizona 2018 Maximum Temp Departure from normal 
|
|
Arizona 2018 Average
Minimum Temperature 
|
Arizona 2018 Minimum Temp
Departure from normal
|
|
Arizona 2018 Average Temperature
|
Arizona 2018 Average Temp
Departure from normal 
|
| 2018 Phoenix Precipitation Statistics |
| |
Precip Total |
Departure |
Rank (1=Wettest, 123=Driest) |
| Jan |
0.21
|
-0.70
|
90th
|
| Feb |
0.52
|
-0.40
|
63rd
|
| Mar |
0.04
|
-0.95
|
106th
|
| Apr |
0.00
|
-0.28
|
Tied 123rd
|
| May |
0.00
|
-0.11
|
Tied 123rd
|
| Jun |
T
|
-0.02
|
Tied 123rd
|
| Jul |
0.70
|
-0.35
|
65th
|
| Aug |
1.50
|
+0.50
|
26th
|
| Sep |
0.43
|
-0.21
|
62nd
|
| Oct |
5.35
|
+4.77
|
1st
|
| Nov |
0.35
|
-0.30
|
Tied 64th
|
| Dec |
0.19
|
-0.69
|
Tied 86th
|
(*** click on month for more comprehensive monthly summary ***)
| Phoenix Record Daily Rainfall for 2018 |
| Date |
Record |
Previous Record |
| Jul 9 |
0.56
|
0.44 in 1996
|
| Aug 10 |
0.56 |
0.32 in 1958 |
| Oct 2 |
2.36 |
0.60 in 1981 |
| Oct 7 |
0.41 |
0.30 in 1924 |
| Oct 13 |
2.19 |
0.16 in 1933 |
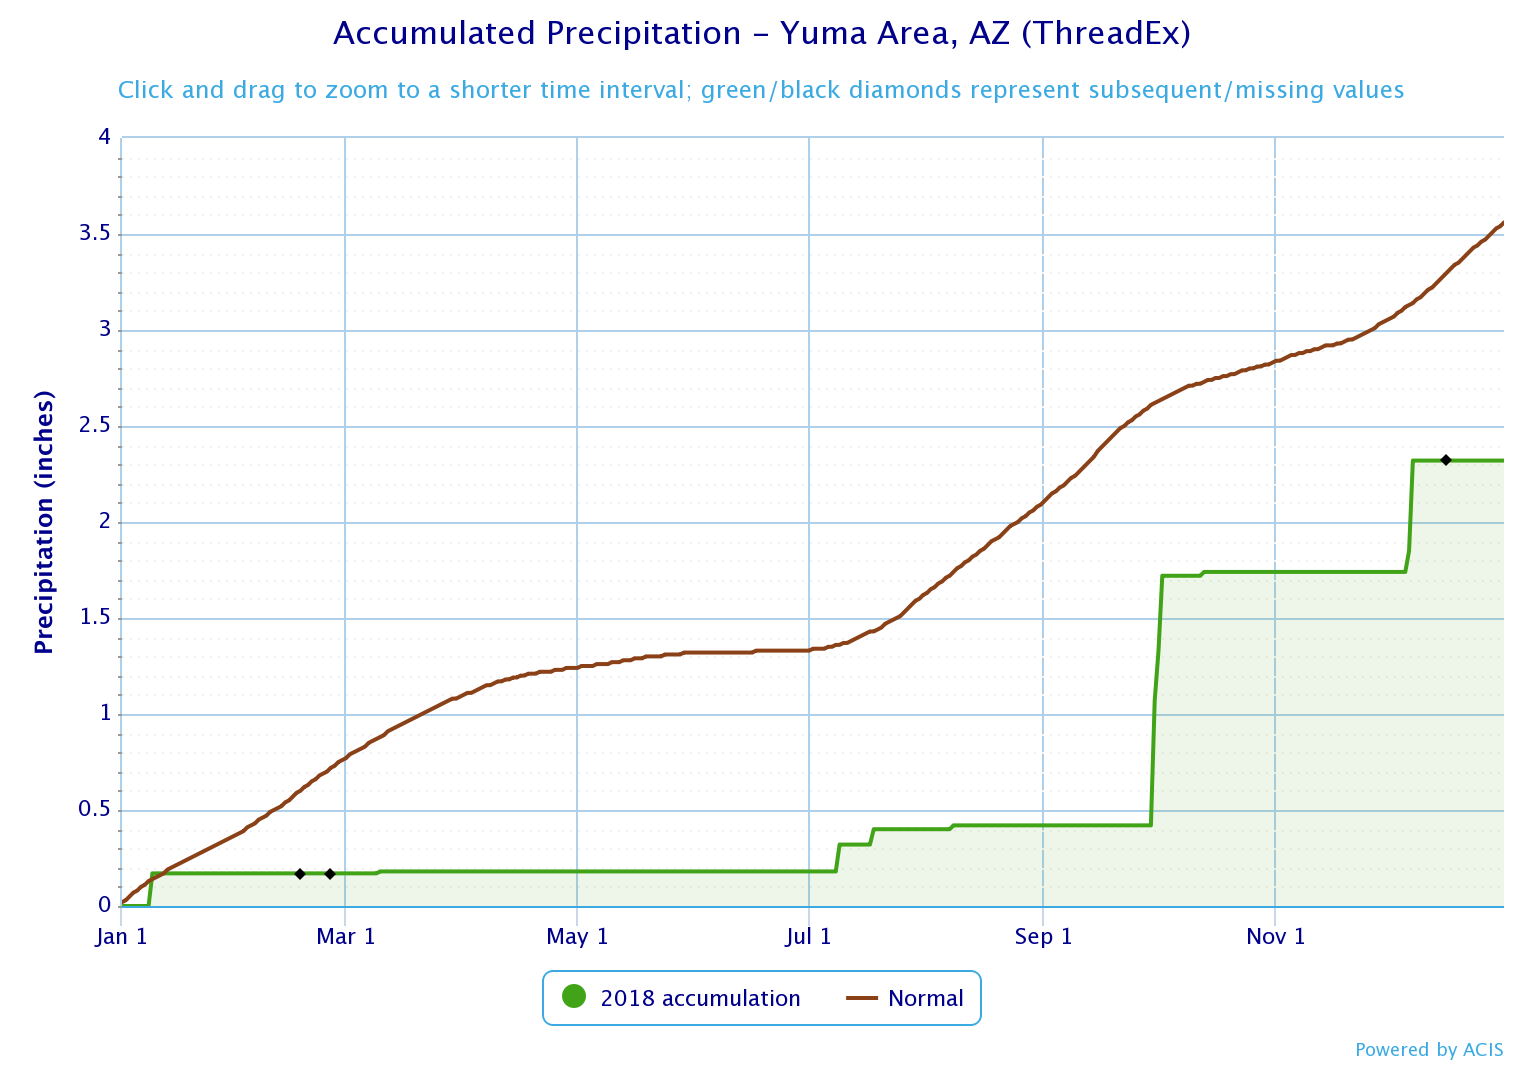
| 2018 Yuma Precipitation Statistics |
| |
Precip Total |
Departure |
Rank (1=Wettest, 141=Driest) |
| Jan |
0.17
|
-0.20
|
72nd
|
| Feb |
T
|
-0.39
|
Tied 125th
|
| Mar |
0.01
|
-0.32
|
Tied 104th
|
| Apr |
0.00
|
-0.15
|
Tied 141st
|
| May |
0.00
|
-0.08
|
Tied 141st
|
| Jun |
T
|
-0.01
|
Tied 141st
|
| Jul |
0.22
|
-0.07
|
35th
|
| Aug |
0.02
|
-0.45
|
Tied 106th
|
| Sep |
0.65
|
+0.12
|
25th
|
| Oct |
0.67
|
+0.46
|
20th
|
| Nov |
T
|
-0.22
|
Tied 141st
|
| Dec |
0.58
|
+0.07
|
41st
|
(*** click on month for more comprehensive monthly summary ***)
| Yuma Record Daily Rainfall for 2018 |
| Date |
Record |
Previous Record |
| Jun 15 |
T - tied record
|
T in 1958
|
| Jul 9 |
0.14
|
0.05 in 1963
|
| Oct 2 |
0.39 |
0.12 in 1954 |
|
Arizona 2018
Precipitation
|
Arizona 2018 Precip Departure from normal 
|
Arizona 2018 Precip Percent Normal 
|
CLIMATE REPORT
NATIONAL WEATHER SERVICE PHOENIX AZ
446 PM MST SAT JAN 26 2019
...................................
...THE PHOENIX AZ CLIMATE SUMMARY FOR THE YEAR OF 2018...
CLIMATE NORMAL PERIOD 1981 TO 2010
CLIMATE RECORD PERIOD 1895 TO 2019
WEATHER OBSERVED NORMAL DEPART LAST YEAR`S
VALUE DATE(S) VALUE FROM VALUE
NORMAL
.............................................................
TEMPERATURE (F)
RECORD
HIGH 122 06/26/1990
LOW 16 01/07/1913
HIGHEST 116 07/25 114 2
07/24
LOWEST 34 12/29 35 -1
AVG. MAXIMUM 88.1 86.7 1.4
AVG. MINIMUM 64.7 63.5 1.2
MEAN 76.4 75.1 1.3
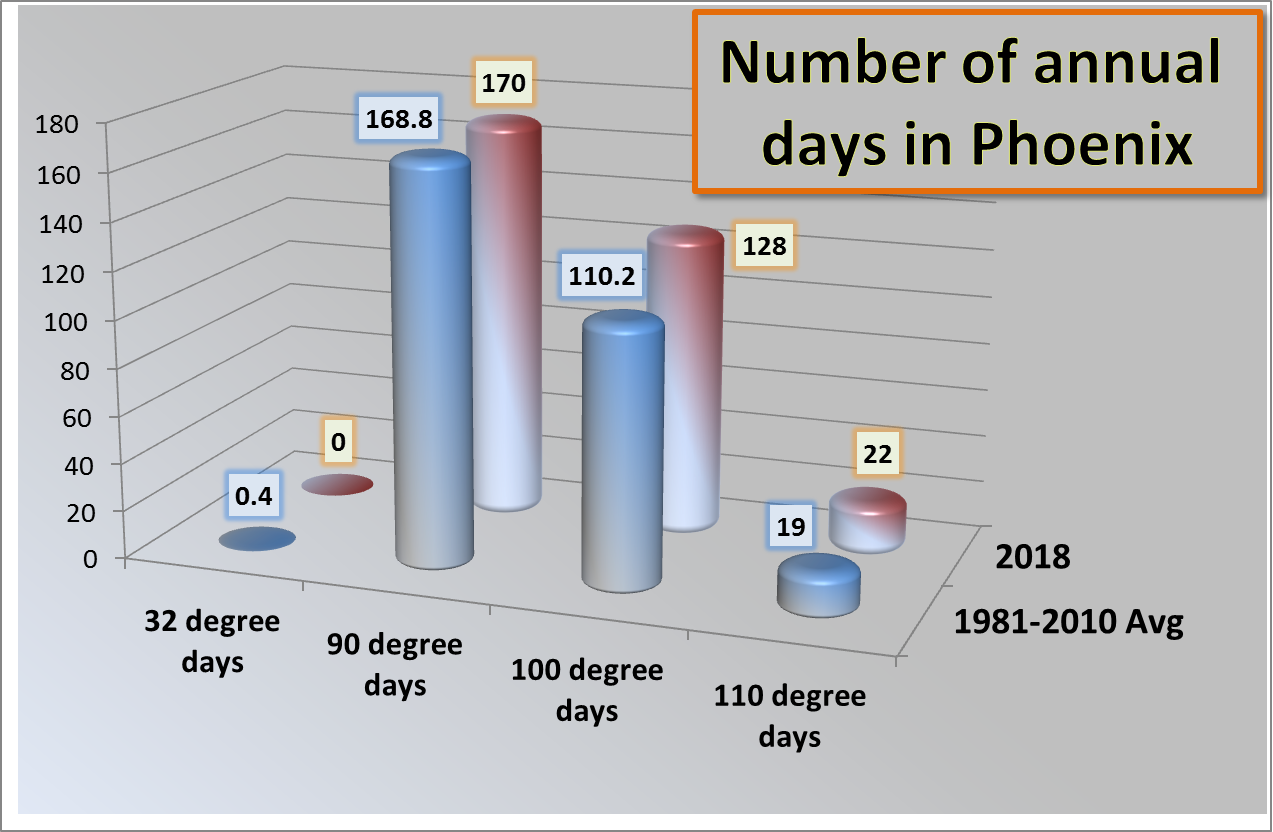
DAYS MAX >= 90 170 168.8 1.2
DAYS MAX <= 32 0 0.0 0.0
DAYS MIN <= 32 0 0.4 -0.4
DAYS MIN <= 0 0 0.0 0.0
PRECIPITATION (INCHES)
RECORD
MAXIMUM 19.73 1905
MINIMUM 2.82 2002
1956
TOTALS 9.29 8.03 1.26
DAYS >= .01 33 36.6 -3.6
DAYS >= .10 15 18.7 -3.7
DAYS >= .50 4 4.5 -0.5
DAYS >= 1.00 2 1.3 0.7
GREATEST
24 HR. TOTAL 2.36 10/02 TO 10/02
DEGREE_DAYS
HEATING TOTAL 660 935 -275
SINCE 7/1 355 401 -46
COOLING TOTAL 4943 4608 335
SINCE 1/1 4943 4607 336
..............................................................
WIND (MPH)
AVERAGE WIND SPEED 6.4
HIGHEST GUST SPEED/DIRECTION 71/050 DATE 07/09
AVERAGE RH (PERCENT) 34
WEATHER CONDITIONS. NUMBER OF DAYS WITH
THUNDERSTORM 24 HEAVY RAIN 11
RAIN 12 LIGHT RAIN 35
FOG W/VIS <= 1/4 MILE 0
- INDICATES NEGATIVE NUMBERS.
R INDICATES RECORD WAS SET OR TIED.
MM INDICATES DATA IS MISSING.
T INDICATES TRACE AMOUNT.
CLIMATE REPORT
NATIONAL WEATHER SERVICE PHOENIX AZ
446 PM MST SAT JAN 26 2019
...................................
...THE YUMA AZ CLIMATE SUMMARY FOR THE YEAR OF 2018...
CLIMATE NORMAL PERIOD 1981 TO 2010
CLIMATE RECORD PERIOD 1876 TO 2019
WEATHER OBSERVED NORMAL DEPART
VALUE DATE(S) VALUE FROM
NORMAL
................................................
TEMPERATURE (F)
RECORD
HIGH 124 07/28/1995
LOW 22 01/24/1937
12/26/1911
01/20/1883
HIGHEST 118 07/24 115 3
LOWEST 36 02/25 36 0
AVG. MAXIMUM 89.0 88.3 0.7
AVG. MINIMUM 64.1 63.4 0.7
MEAN 76.5 75.9 0.6
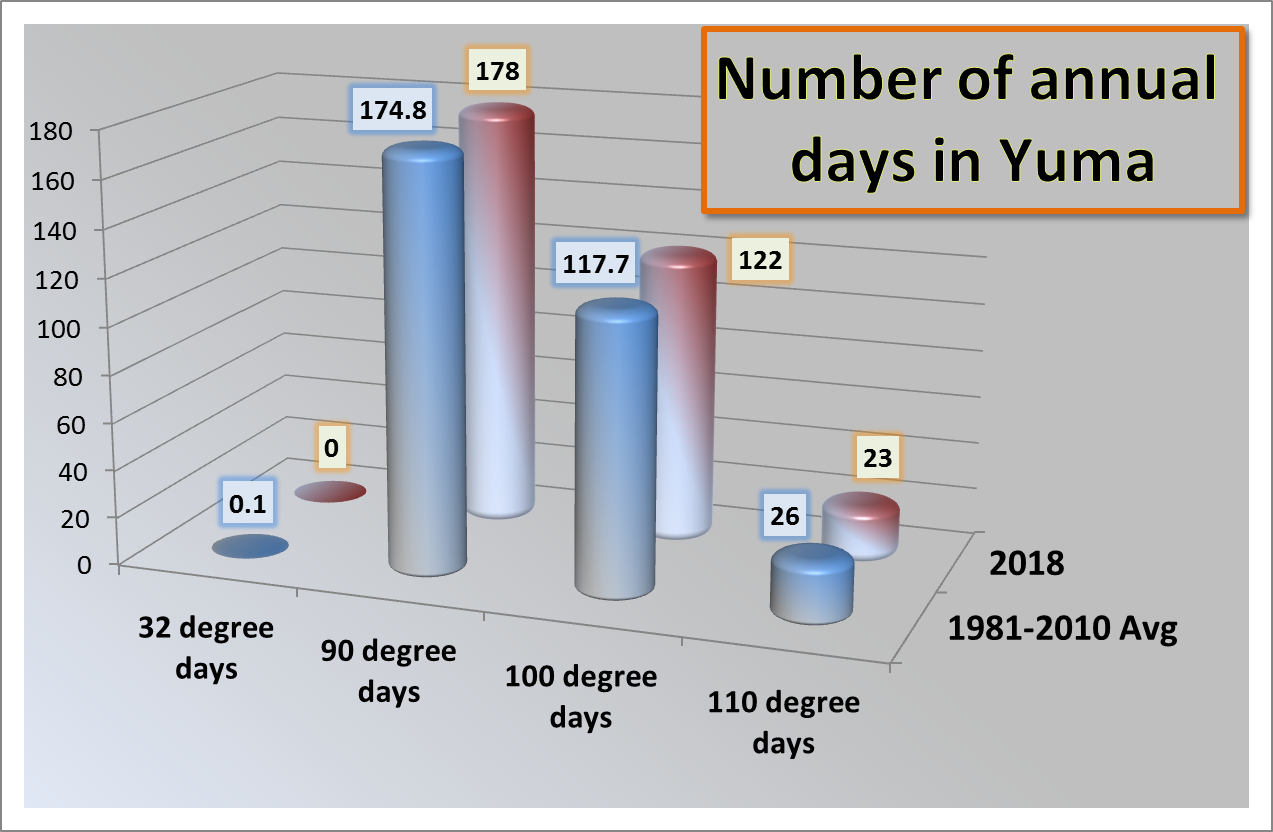
DAYS MAX >= 90 178 174.8 3.2
DAYS MAX <= 32 0 0.0 0.0
DAYS MIN <= 32 0 0.1 -0.1
DAYS MIN <= 0 0 0.0 0.0
PRECIPITATION (INCHES)
RECORD
MAXIMUM 11.41 1905
MINIMUM 0.03 2002
TOTALS 2.32 3.56 -1.24
DAYS >= .01 11 17.4 -6.4
DAYS >= .10 7 8.6 -1.6
DAYS >= .50 1 1.9 -0.9
DAYS >= 1.00 0 0.5 -0.5
GREATEST
24 HR. TOTAL 0.65 09/30 TO 10/01
DEGREE_DAYS
HEATING TOTAL 548 687 -139
SINCE 7/1 281 304 -23
COOLING TOTAL 4834 4650 184
SINCE 1/1 4834 4651 183
.................................................
WIND (MPH)
AVERAGE WIND SPEED 7.2
HIGHEST GUST SPEED/DIRECTION 54/140 DATE 09/30
AVERAGE RH (PERCENT) 36
WEATHER CONDITIONS. NUMBER OF DAYS WITH
THUNDERSTORM 14 HEAVY RAIN 4
RAIN 6 LIGHT RAIN 17
FOG W/VIS <= 1/4 MILE 0
- INDICATES NEGATIVE NUMBERS.
R INDICATES RECORD WAS SET OR TIED.
MM INDICATES DATA IS MISSING.
T INDICATES TRACE AMOUNT.