|
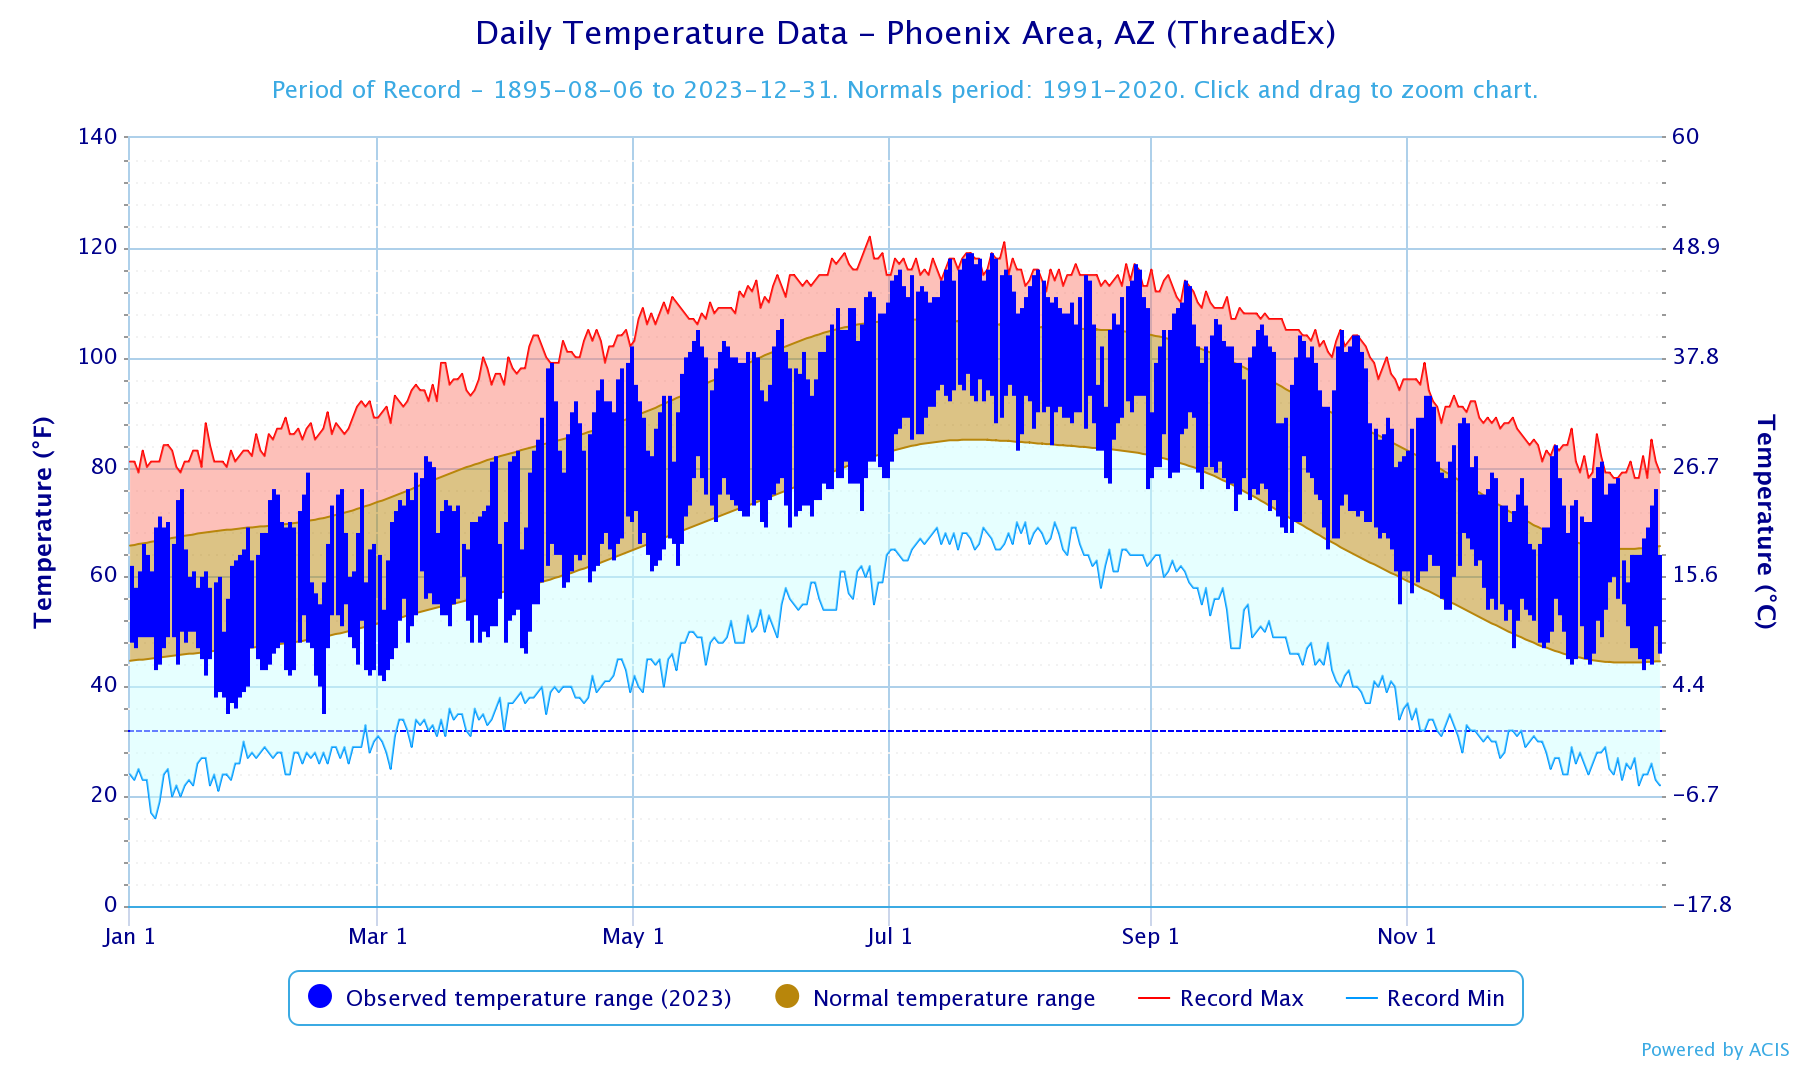
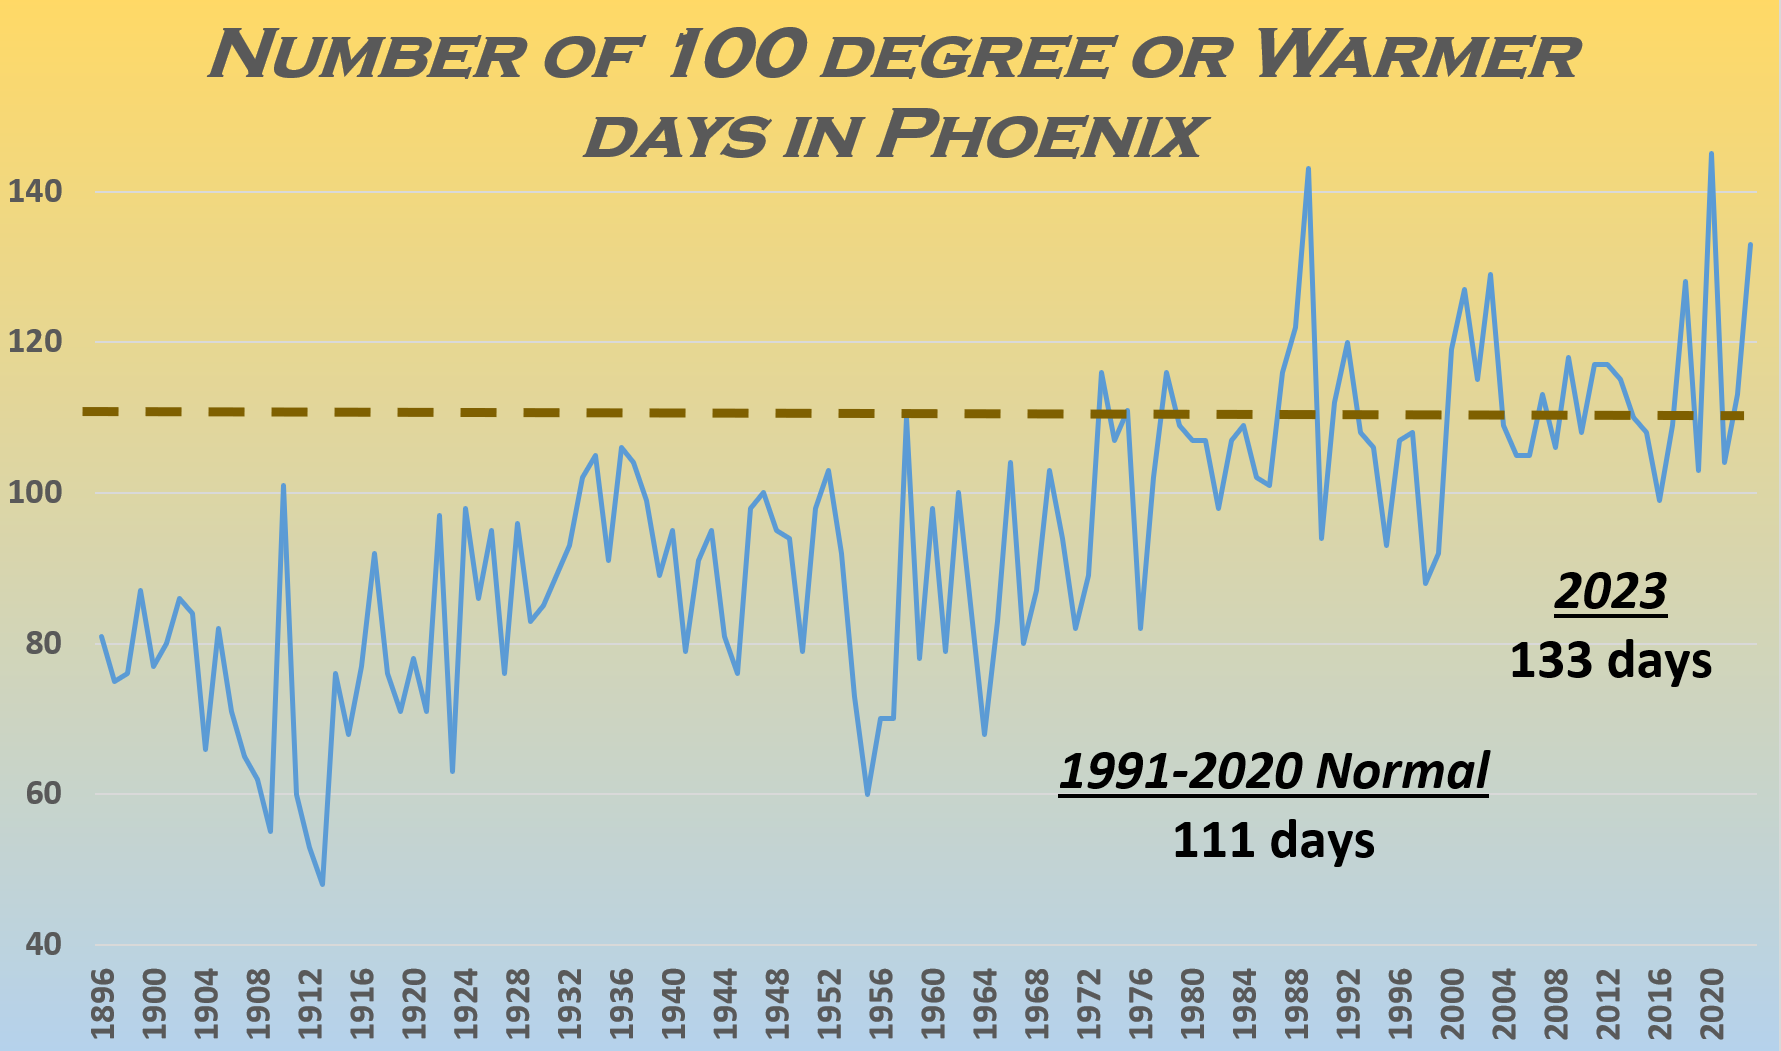
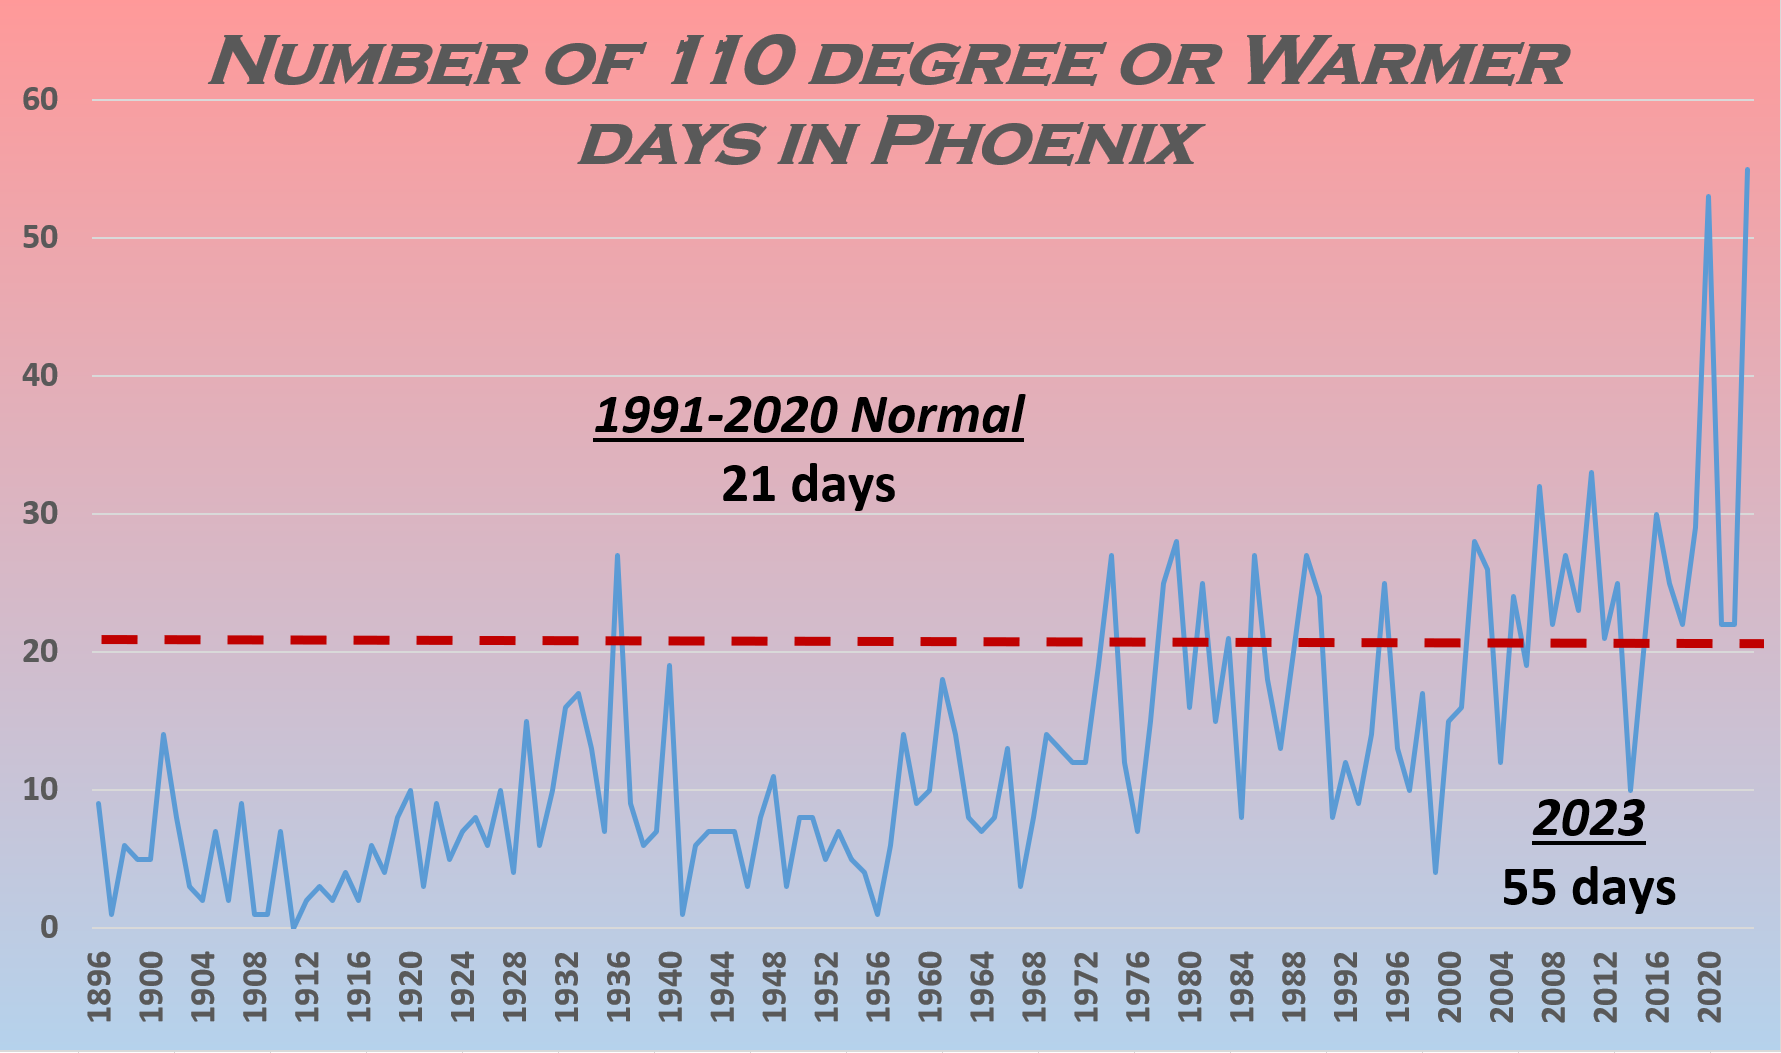
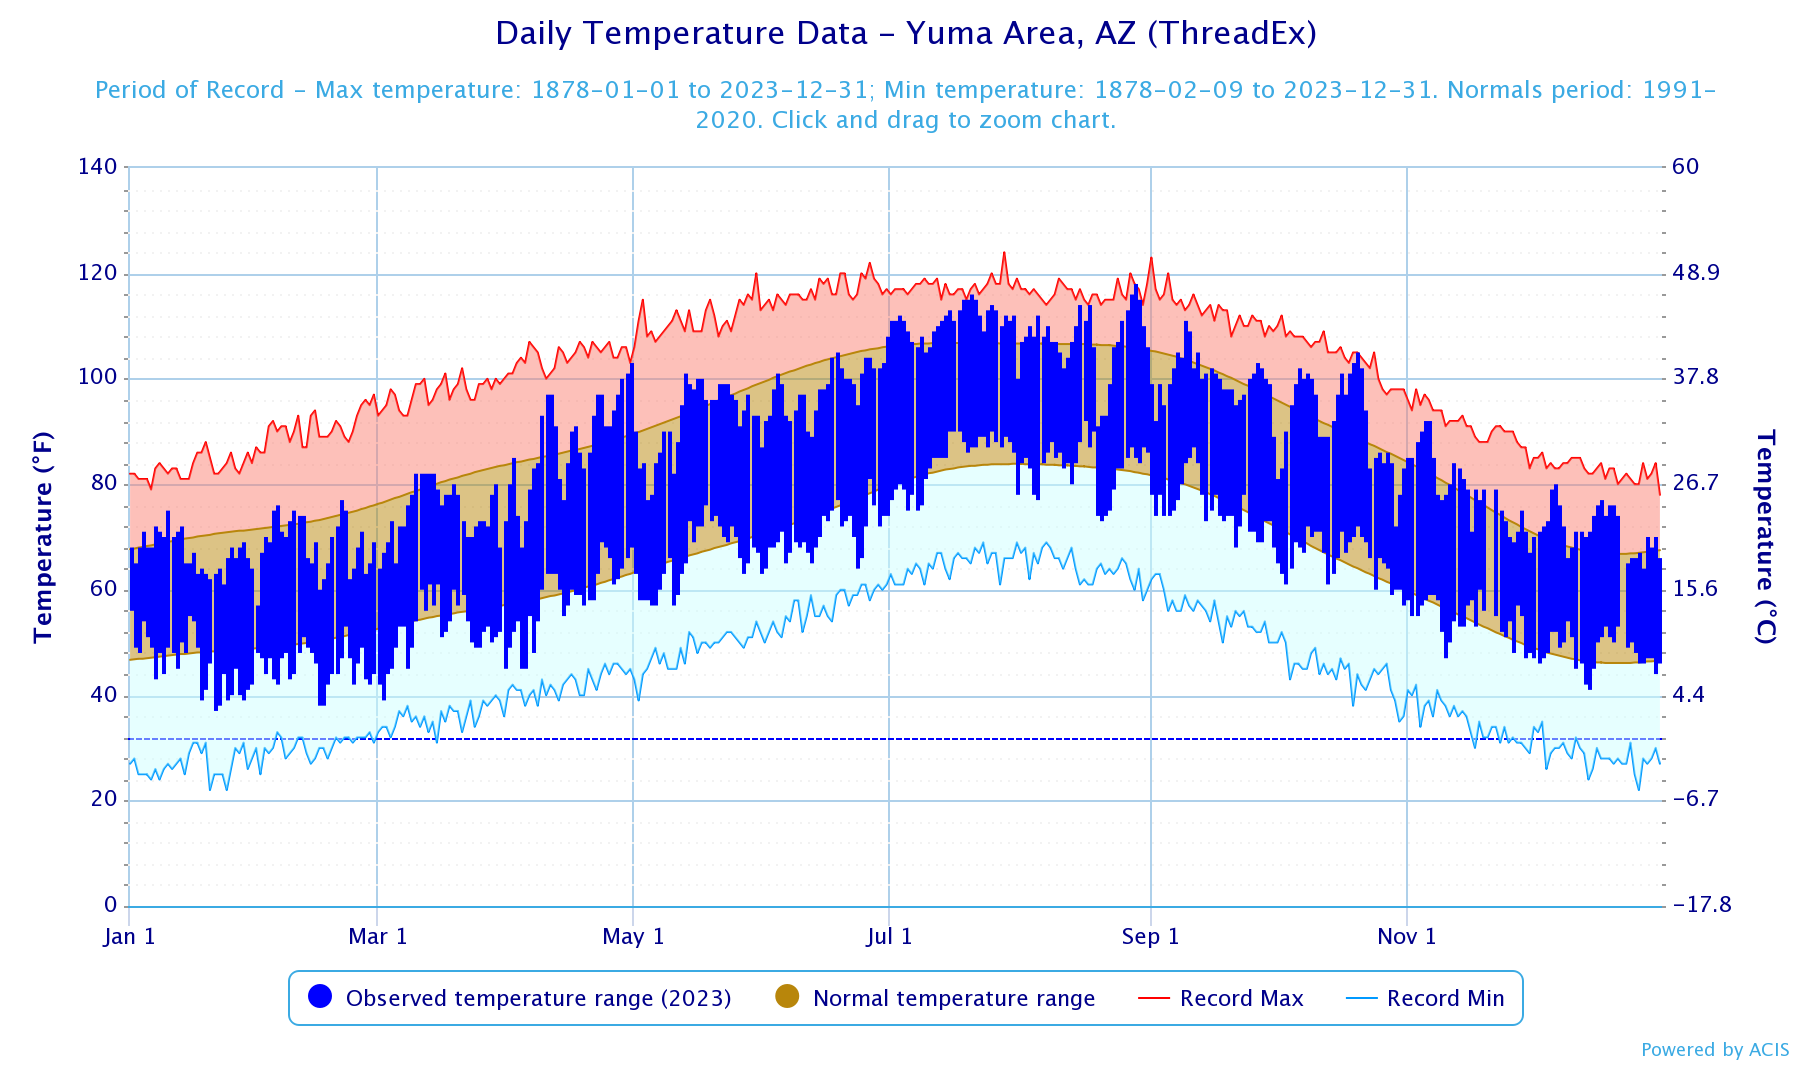
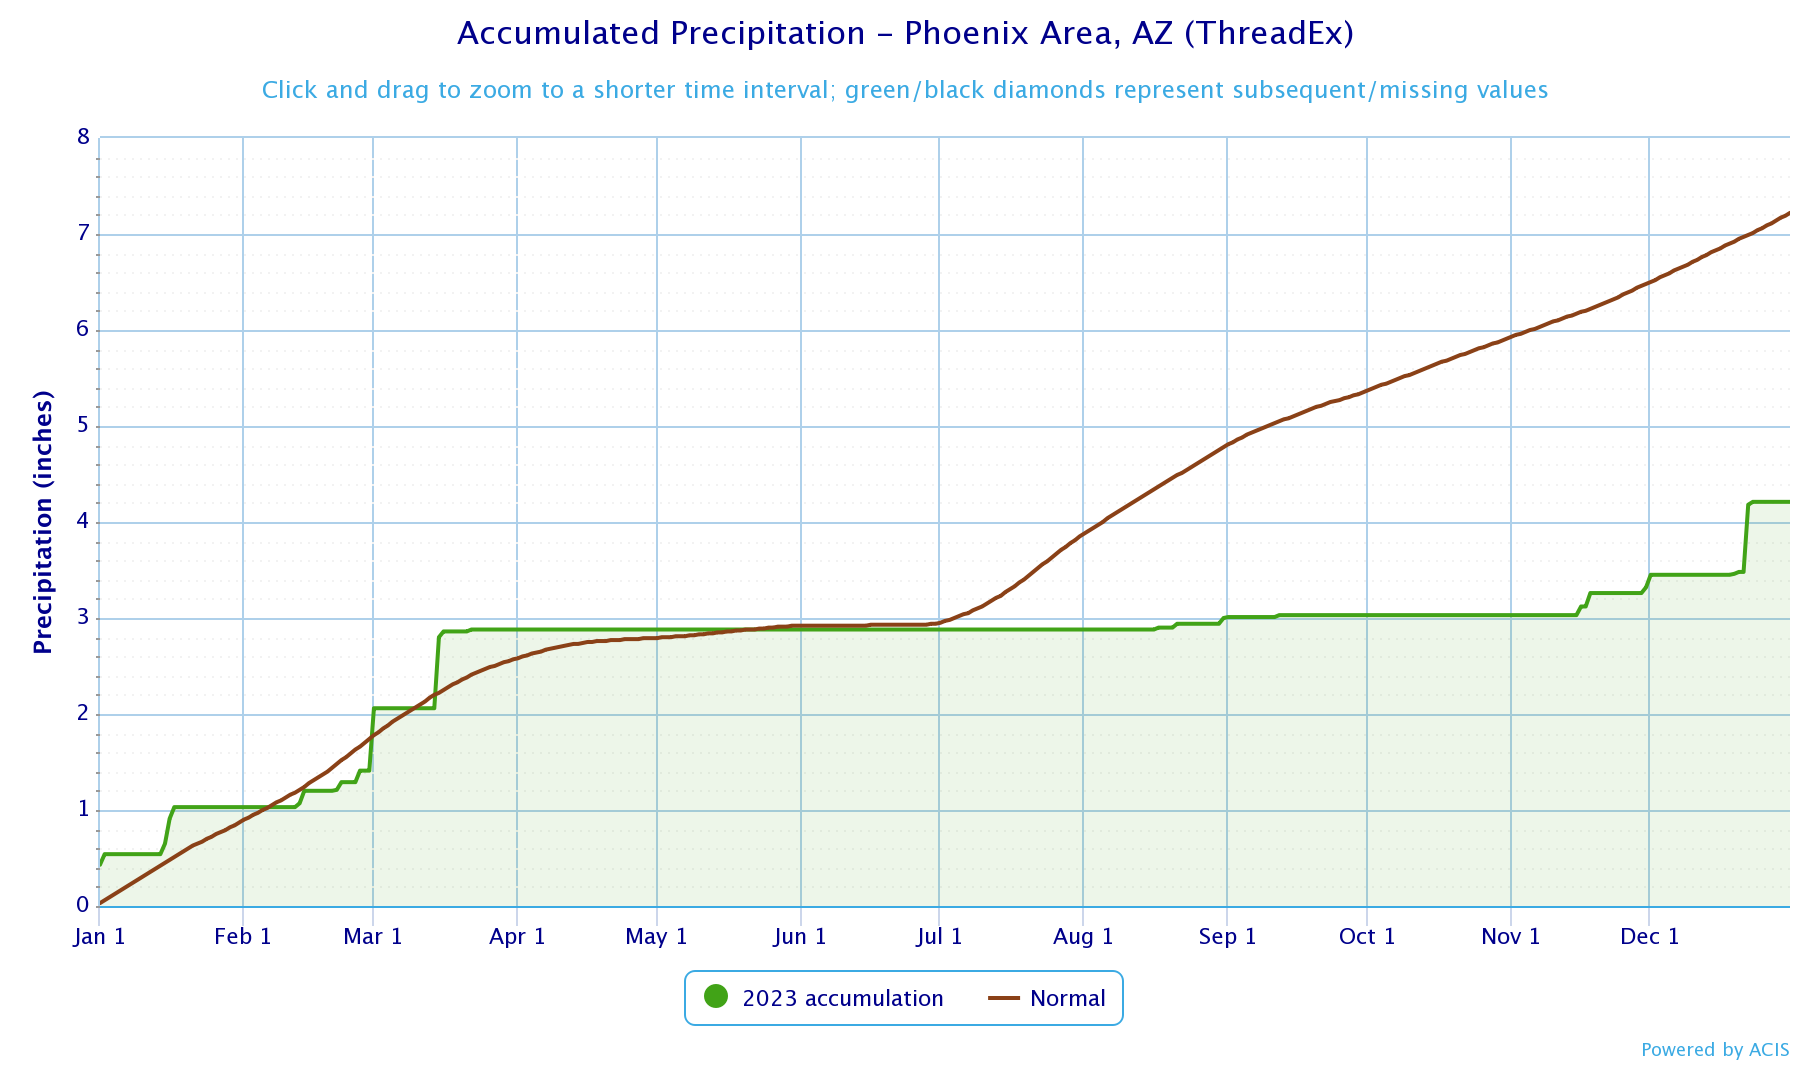
The year 2023 ended up being the 4th warmest year recorded in the history of Phoenix, Arizona, and tied for 41st warmest in Yuma. Extensive missing temperature data at El Centro precludes any definitive ranking this year. Rainfall in Phoenix for the year was much below average, and ranked as the 15th driest. Equipment failures at Yuma failed to record events required to make an annual total. Records for Phoenix began in 1896, first taken in downtown and since moved to Sky Harbor airport in the 1950s. Records in Yuma began in 1878. A persistent La Nina pattern from 2022 continued into 2023 marking the third consecutive winter of La Nina. However, unlike the typical dry La Nina pattern common in the Southwest, this La Nina episode produced unusually wet conditions lasting into the spring. In fact, one unusually strong weather disturbance in the beginning of March brought snow levels as low as 2000ft and light snow reported in the foothills north of Phoenix. With the higher frequency of storm systems, cloud cover, and rain, average temperatures during the first half of the year were largely below normal. The start of the 2023 summer monsoon marked a distinct change in the overall pattern as the cooler and wetter conditions experienced earlier in the year turned dry and hot. In addition to numerous daily record highs throughout the summer, the month of July ended as the hottest month ever recorded in the city of Phoenix with an average monthly temperature above 100 degrees (the first time the 100 degree threshold has ever been reached with respect to monthly average temperature). Only a handful of thunderstorm days impacted the region during the monsoon, and the recording station at Phoenix Sky Harbor airport reported its driest monsoon on record at only 0.15". The most active days actually occurred towards the end of the monsoon season with one transition event on September 12th producing extensive damaging winds. A more extensive review of Monsoon 2023 can be found here. La Nina conditions had deteriorated quickly in the spring, then an El Nino episode rapidly evolved during the summer. This El Nino has continued to strengthen through the fall and winter reaching a "strong" category. While El Nino's can sometimes support cooler and wetter weather in the Southwest during the winter, 2023 ended similar to the latter half of the year in a drier and warmer regime.
|
***Please note all climatic data are considered preliminary until validated by the National Centers for Environmental Information*** |
Phoenix Annual Temperature Rankings (Warmest Years)
|
|
|
|---|
|
|
Avg Max Temp |
Highest
Temp |
Avg Min Temp
|
Lowest Temp
|
Avg Temp
|
Rank (1=Warmest, 128=Coldest)
|
|---|---|---|---|---|---|---|
| Jan |
63.4
|
76 on the 13th
|
44.4
|
35 on the 24th
|
53.9 /-2.9
|
61st
|
| Feb |
68.1
|
79 on the 12th
|
46.1
|
35 on the 16th
|
57.1 /-2.8
|
68th
|
| Mar |
72.2
|
82 on the 12th & 29th
|
51.5
|
41 on the 2nd
|
61.8 /-4.5
|
63rd
|
| Apr |
88.0
|
102 on the 30th
|
60.5
|
46 on the 5th
|
74.3 /+1.1
|
18th
|
| May |
96.0
|
105 on the 16th
|
70.6
|
61 on the 5th
|
83.3 /+1.3
|
16th
|
| Jun |
103.3
|
112 on the 26th
|
75.6
|
69 on the 1st & 7th
|
89.5 /-1.9
|
41st
|
| Jul |
114.7
|
119 on the 20th & 25th
|
90.8
|
81 on the 1st
|
102.7 /+7.2
|
1st
|
| Aug |
109.5
|
117 on the 28th
|
88.0
|
76 on the 31st
|
98.8 /+4.4
|
2nd
|
| Sep |
103.4
|
114 on the 9th
|
78.9
|
72 on the 21st & 29th
|
91.2 /+2.0
|
6th
|
| Oct |
94.2
|
99 on the 3rd
|
69.7
|
53 on the 25th
|
81.9 /+4.5
|
3rd
|
| Nov |
80.6
|
93 on the 5th & 6th
|
58.1
|
47 on the 26th
|
69.4/+4.3
|
4th
|
| Dec |
71.6
|
84 on the 6th
|
49.3
|
43 on the 27th
|
60.5/+4.7
|
2nd
|
(*** click on month for more comprehensive monthly summary ***)
| Record Highs Set in 2023 |
|---|
| Date | Record | Previous Record |
|---|---|---|
| Apr 11 |
99
|
98 in 1989
|
| Apr 30 |
102- tied record
|
102 in 1943
|
| Jul 13 |
114 - tied record
|
114 in 2020
|
| Jul 14 |
116 - tied record
|
116 in 2003
|
| Jul 15 | 118 | 117 in 1998 |
| Jul 17 | 116 - tied record | 116 in 2005 |
| Jul 18 | 118 | 115 in 1989 |
| Jul 19 | 119 | 116 in 1989 |
| Jul 20 | 119 | 114 in 1978 |
| Jul 22 | 118 | 116 in 2006 |
| Jul 24 | 116 - tied record | 116 in 2018 |
| Jul 25 | 119 | 116 in 2018 |
| Jul 26 | 118 | 116 in 1995 |
| Jul 29 | 115 - tied record | 115 in 2020 |
| Aug 5 | 116 | 115 in 2019 |
| Aug 6 | 114 - tied record | 114 in 2018 |
| Aug 16 | 115 - tied record | 115 in 2020 |
| Aug 27 | 114 | 113 in 2020 |
| Aug 28 | 117 | 113 in 2009 |
| Aug 29 | 116 | 113 in 2009 |
| Sep 8 | 110 - tied record | 110 in 1979 |
| Sep 9 | 114 | 111 in 2021 |
| Sep 10 | 113 | 111 in 1990 |
| Oct 16 | 105 | 102 in 2020 |
| Oct 19 | 104 | 101 in 2003 |
| Oct 20 | 104 | 103 in 2003 |
| Dec 5 | 82 - tied record | 82 in 1939 |
| Dec 6 | 84 | 83 in 1939 |
| Dec 21 | 78 | 77 in 1985 |
| No Record Lows were set in 2023 |
|---|
Yuma Annual Temperature Rankings (Warmest Years)
|
|
|
|---|
|
|
Avg Max Temp |
Highest
Temp |
Avg Min Temp
|
Lowest Temp
|
Avg Temp
|
Rank (1=Warmest, 147=Coldest)
|
|---|---|---|---|---|---|---|
| Jan |
66.8
|
75 on the 10th
|
45.8
|
37 on the 21st
|
56.3 /-2.5
|
67th
|
| Feb |
69.2
|
77 on the 20th
|
45.2
|
38 on the 15th & 16th
|
57.2 /-4.7
|
117th
|
| Mar |
74.7
|
82 on the 13th & 14th
|
51.8
|
39 on the 2nd
|
63.3 /-4.3
|
99th
|
| Apr |
88.2
|
103 on the 30th
|
58.7
|
45 on the 4th & 5th
|
73.4 / +0.3
|
42nd
|
| May |
92.2
|
101 on the 13th
|
65.7
|
57 on the 5th & 6th
|
79.0 /-1.6
|
63rd
|
| Jun |
98.4
|
108 on the 30th
|
70.5
|
64 on the 1st & 23rd
|
84.5 /-4.6
|
110th
|
| Jul |
110.7
|
116 on the 20th
|
84.3
|
75 on the 5th & 7th
|
97.5 /+2.9
|
1st
|
| Aug |
107.4
|
118 on the 28th
|
83.2
|
73 on the 20th
|
95.3 /+0.5
|
18th
|
| Sep |
100.1
|
111 on the 9th
|
75.6
|
68 on the 21st & 30th
|
87.8 /-1.7
|
57th
|
| Oct |
91.9
|
105 on the 20th
|
65.9
|
57 on the 31st
|
78.9 /+0.9
|
25th
|
| Nov |
79.0
|
92 on the 5th & 6th
|
54.3
|
47 on the 10th and 29th
|
66.6 /+0.5
|
26th
|
| Dec |
71.3
|
80 on the 6th
|
48.4
|
41 on the 14th
|
59.8 /+2.5
|
14th
|
(*** click on month for more comprehensive monthly summary ***)
| Record Highs Set in 2023 |
|---|
| Date | Record | Previous Record |
|---|---|---|
| Apr 30 |
103 - tied record
|
103 in 1943
|
| Jul 19 |
115 - tied record
|
115 in 2000
|
| Aug 17 |
114 - tied record
|
114 in 2020
|
| Aug 28 |
118 - tied record
|
118 in 1981
|
| Oct 20 | 105 - tied record | 105 in 2003 |
| No Record Lows were set in 2023 |
|---|

El Centro Annual Temperature Rankings (Warmest Years)
|
|
|
|---|
|
|
Avg Max Temp |
Highest
Temp |
Avg Min Temp
|
Lowest Temp
|
Avg Temp
|
Rank (1=Warmest, 97=Coldest)
|
|---|---|---|---|---|---|---|
| Jan |
66.5
|
73 on the 10th
|
43.2
|
35 on the 22nd
|
54.9 /-1.1
|
49th
|
| Feb |
68.8
|
79 on the 21st
|
41.6
|
32 on the 16th
|
55.2 /-4.2
|
65th
|
| Mar |
74.2
|
83 on the 12th & 13th
|
49.6
|
37 on the 3rd
|
61.9 /-3.4
|
72nd
|
| Apr |
87.8
|
103 on the 29th
|
54.9
|
40 on the 6th
|
71.3 / +0.4
|
39th
|
| May |
92.6
|
103 on the 13th
|
62.4
|
53 on the 6th
|
77.5 /-0.7
|
52nd
|
| Jun |
98.3
|
109 on the 30th
|
67.3
|
60 on the 12th
|
82.8 /-4.0
|
88th
|
| Jul |
M
|
Missing
|
M
|
Missing
|
M / M
|
Missing
|
| Aug |
M
|
116 on the 28th & 29th
|
M
|
71 on the 4th & 22nd
|
M / M
|
Missing
|
| Sep |
99.2
|
111 on the 9th
|
71.6
|
62 on the 21st
|
85.4 /-1.8
|
65th
|
| Oct |
91.8
|
103 on the 20th
|
61.4
|
46 on the 31st
|
76.6/ +1.4
|
28th
|
| Nov |
77.9
|
90 on the 6th
|
49.4
|
40 on the 26th
|
63.7 /+0.4
|
41st
|
| Dec |
71.3
|
79 on the 5th & 6th
|
44.1
|
36 on the 10th
|
57.7 /+2.8
|
13th
|
(*** click on month for more comprehensive monthly summary ***)
| Record Highs Set in 2023 |
|---|
| Date | Record | Previous Record |
|---|---|---|
| Jul 15 |
116 - tied record
|
116 in 2019
|
| Jul 18 |
117 - tied record
|
117 in 2009
|
| Jul 20 |
118
|
117 in 1978
|
| Oct 20 | 103 - tied record | 103 in 2003 |
| Record Lows Set in 2023 |
|---|
| Date | Record | Previous Record |
|---|---|---|
| Apr 6 | 40 | 41 in 1929 |
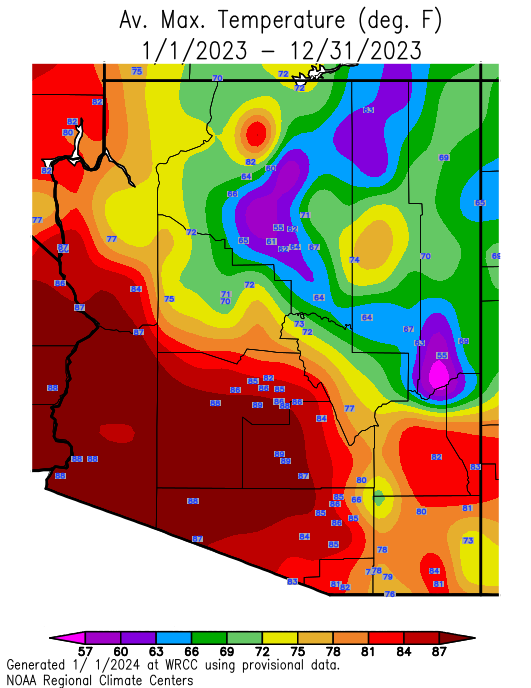
| Arizona Statewide Temperature Maps (Data courtesy of Western Region Climate Center) |
|---|
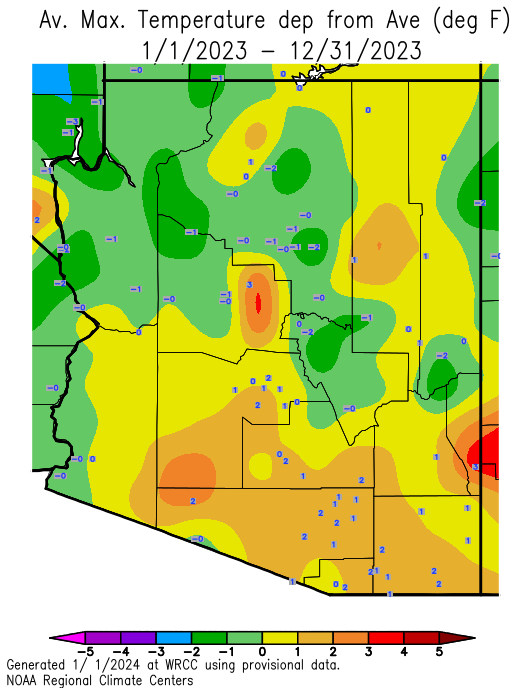
|
Arizona 2023 Average
Maximum Temperature
 |
Arizona 2023 Maximum Temp Departure from normal
 |
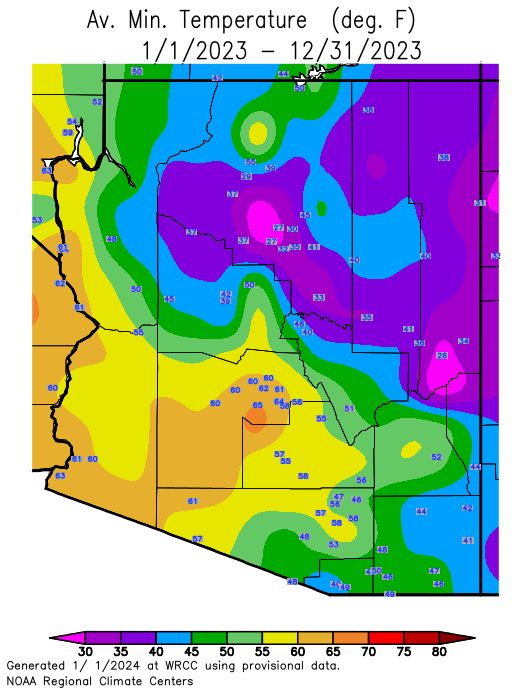
|
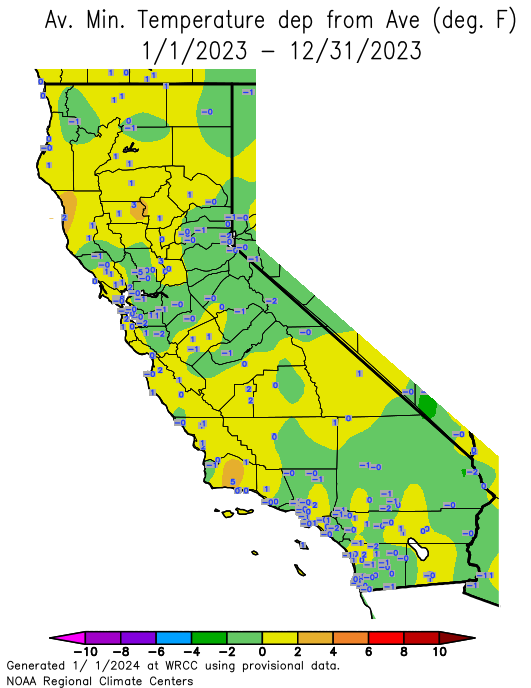
Arizona 2023 Average
Minimum Temperature
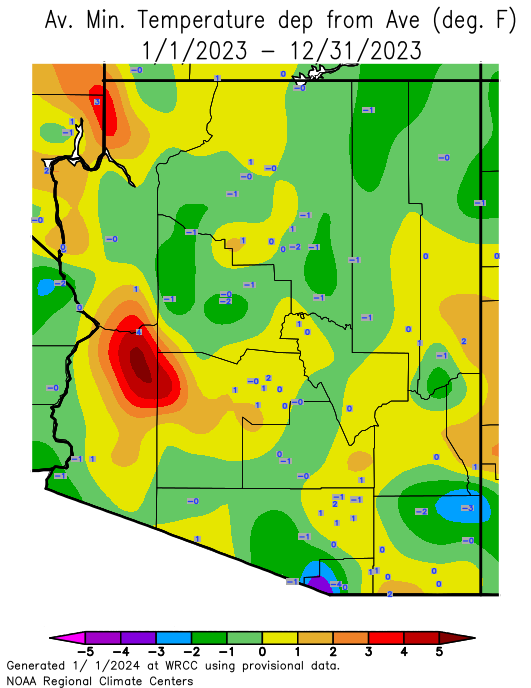
 |
Arizona 2023 Minimum Temp
Departure from normal
 |
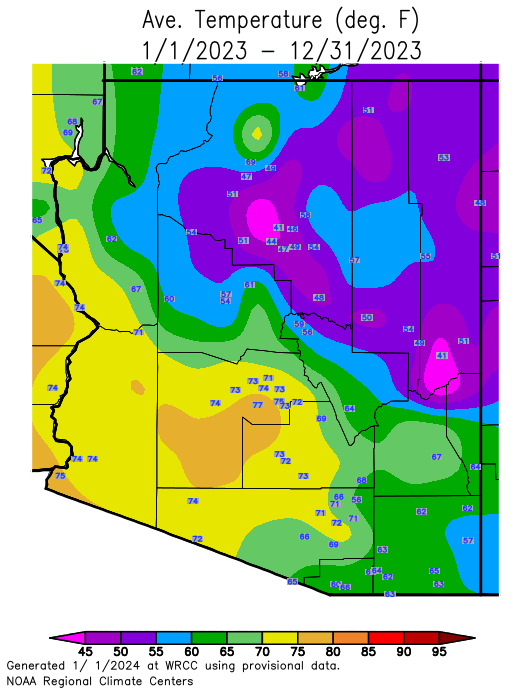
|
Arizona 2023 Average Temperature
 |
Arizona 2023 Average Temp
Departure from normal
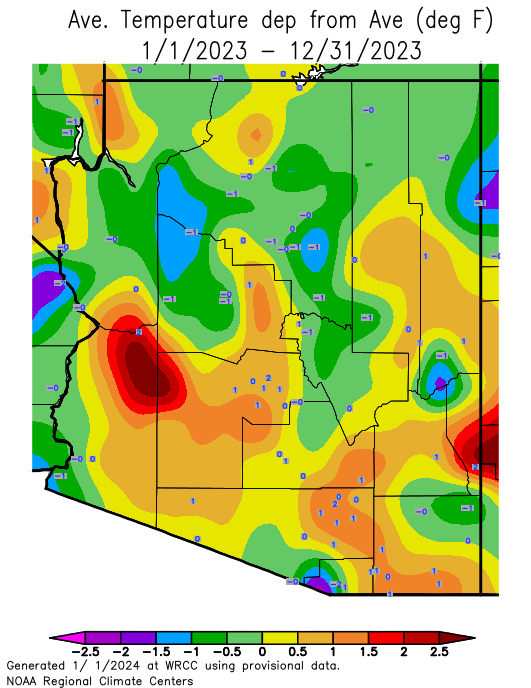 |
| California Statewide Temperature Maps (Data courtesy of Western Region Climate Center) |
|---|
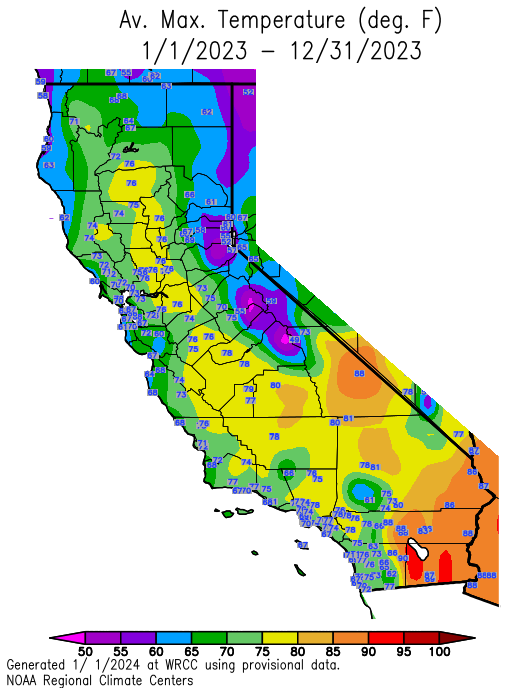
|
California 2023 Average
Maximum Temperature
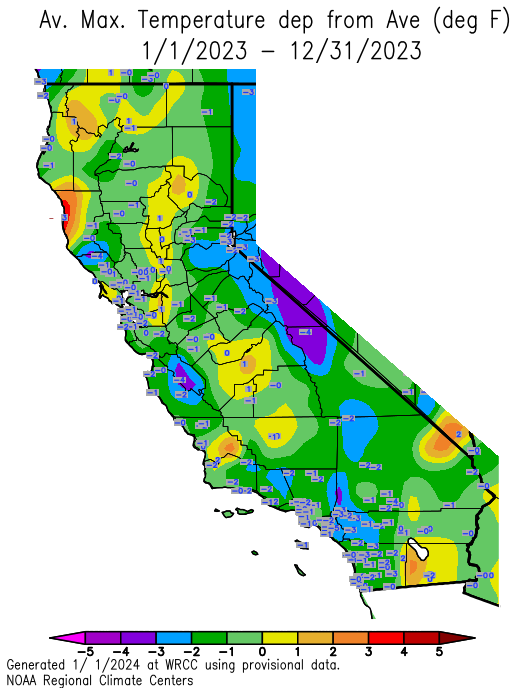
 |
California 2023 Maximum Temp Departure from normal
 |
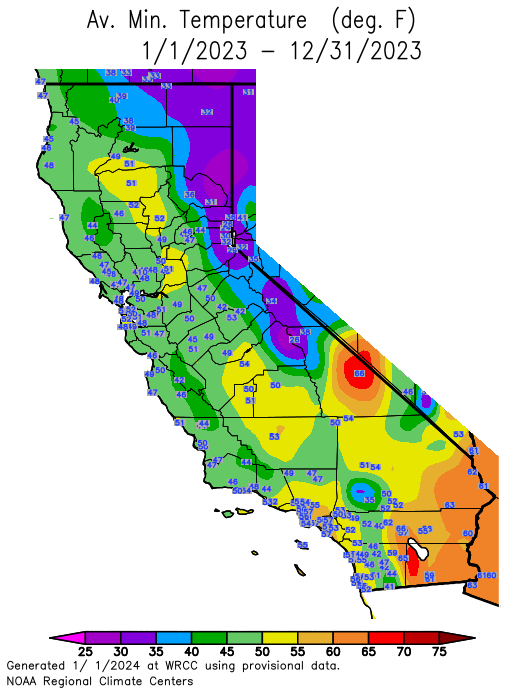
|
California 2023 Average
Minimum Temperature
 |
California 2023 Minimum Temp
Departure from normal
 |
|
California 2023 Average Temperature
 |
California 2023 Average Temp
Departure from normal
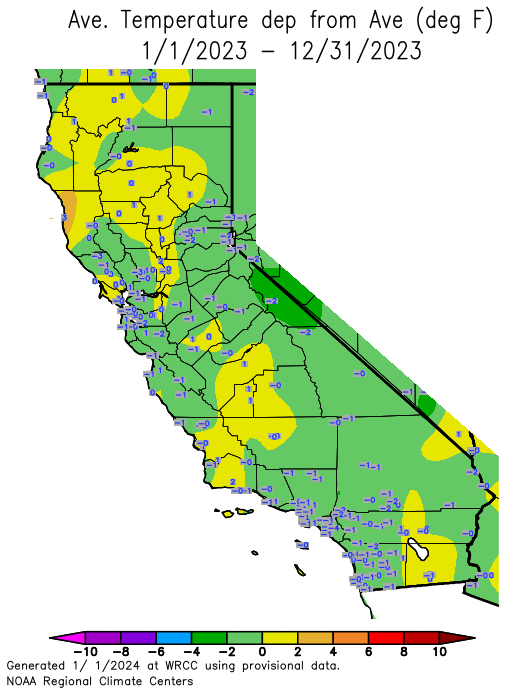 |
| 2023 Phoenix Precipitation Statistics |
|---|
| Precip Total | Departure | Rank (1=Wettest, 128=Driest) | |
|---|---|---|---|
| Jan |
1.03
|
+0.16
|
38th
|
| Feb |
0.38
|
-0.49
|
73rd
|
| Mar |
1.47
|
+0.64
|
21st
|
| Apr |
0.00
|
-0.22
|
128th
|
| May |
Trace
|
-0.13
|
128th
|
| Jun |
0.00
|
-0.02
|
128th
|
| Jul |
Trace
|
-0.91
|
128th
|
| Aug |
0.12
|
-0.81
|
114th
|
| Sep |
0.03
|
-0.54
|
105th
|
| Oct |
0.00
|
-0.56
|
128th
|
| Nov |
0.29
|
-0.28
|
67th
|
| Dec |
0.89
|
+0.15
|
47th
|
(*** click on month for more comprehensive monthly summary ***)
| Phoenix Record Daily Rainfall for 2023 |
|---|
| Date | Record | Previous Record |
|---|---|---|
| Jan 1 |
0.43
|
0.22 in 1906
|
| 2023 Yuma Precipitation Statistics |
|---|
| Precip Total | Departure | Rank (1=Wettest, 147=Driest) | |
|---|---|---|---|
| Jan |
0.16
|
-0.23
|
75th
|
| Feb |
0.14
|
-0.24
|
66th
|
| Mar |
0.29
|
-0.10
|
47th
|
| Apr |
0.00
|
-0.14
|
147th
|
| May |
0.00
|
-0.06
|
147th
|
| Jun |
0.00
|
-0.01
|
147th
|
| Jul |
0.00
|
-0.24
|
147th
|
| Aug |
Missing
|
Missing
|
Missing
|
| Sep |
1.71 |
+1.03 |
8th |
| Oct |
0.00
|
-0.13
|
147th
|
| Nov |
0.32
|
+0.09
|
30th
|
| Dec |
Missing
|
Missing
|
Missing
|
(*** click on month for more comprehensive monthly summary ***)
| Yuma Record Daily Rainfall for 2023 |
|---|
| Date | Record | Previous Record |
|---|---|---|
| Sep 2 |
1.67
|
1.49 in 1967
|
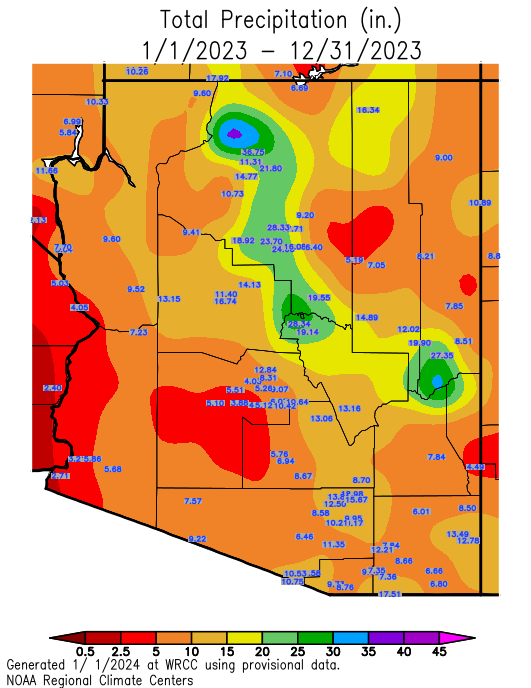
| Arizona Statewide Precipitation Maps (Data courtesy of Western Region Climate Center) |
|---|
|
Arizona 2023
Precipitation
 |
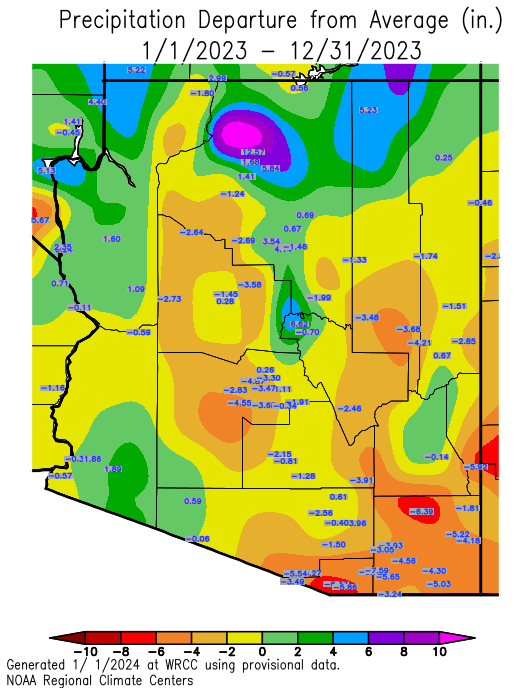
Arizona 2023 Precip Departure from normal
 |
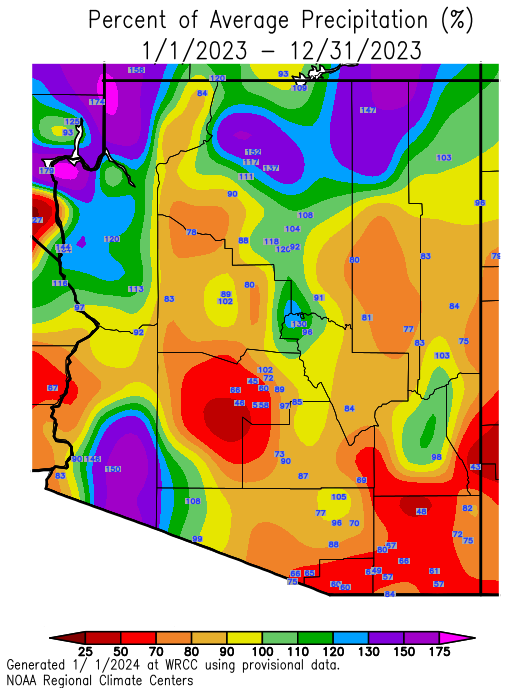
Arizona 2023 Precip Percent Normal
 |
| California Statewide Precipitation Maps (Data courtesy of Western Region Climate Center) |
|---|
|
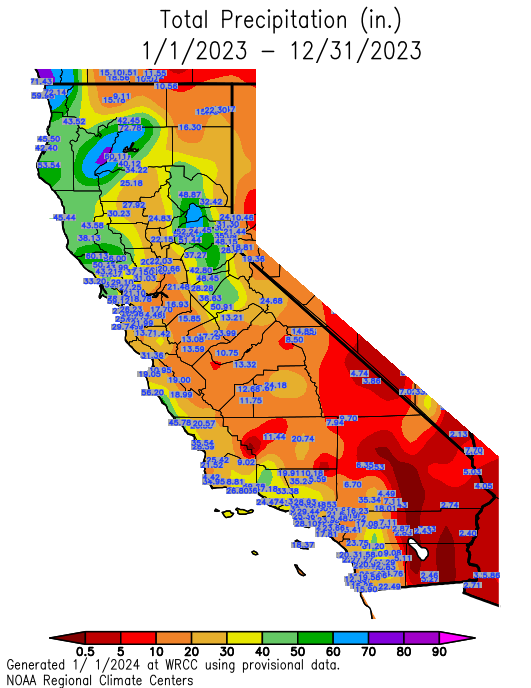
California 2023
Precipitation
 |
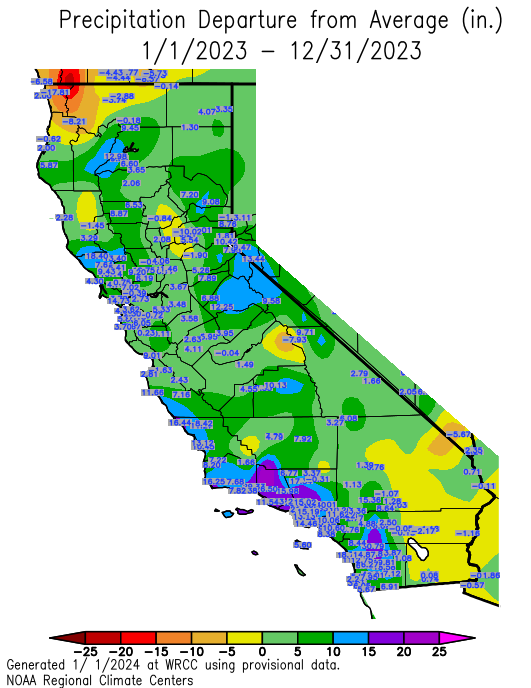
California 2023 Precip Departure from normal
 |
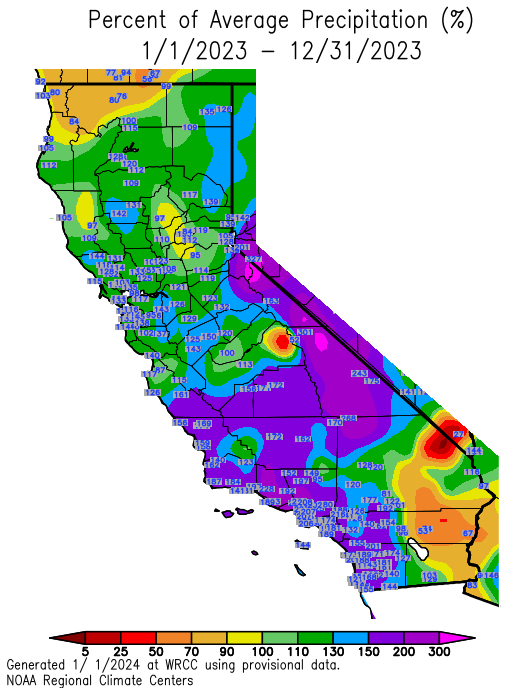
California 2023 Precip Percent Normal
 |
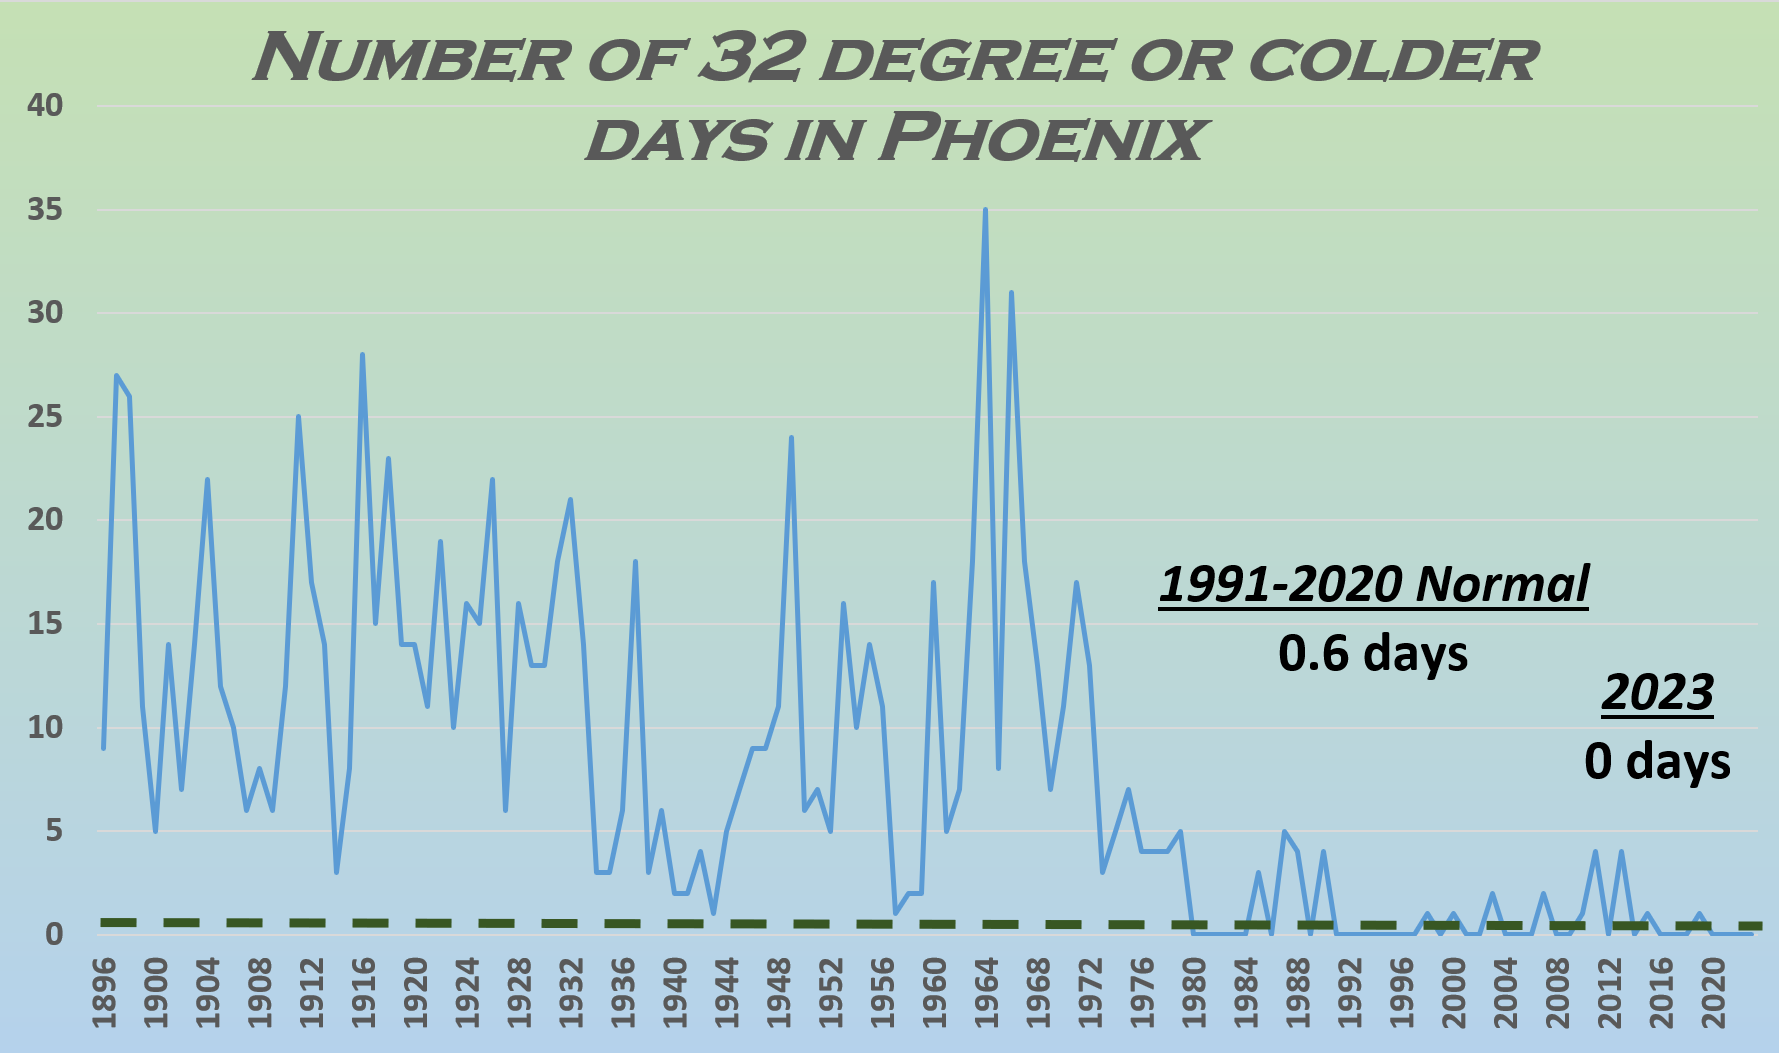
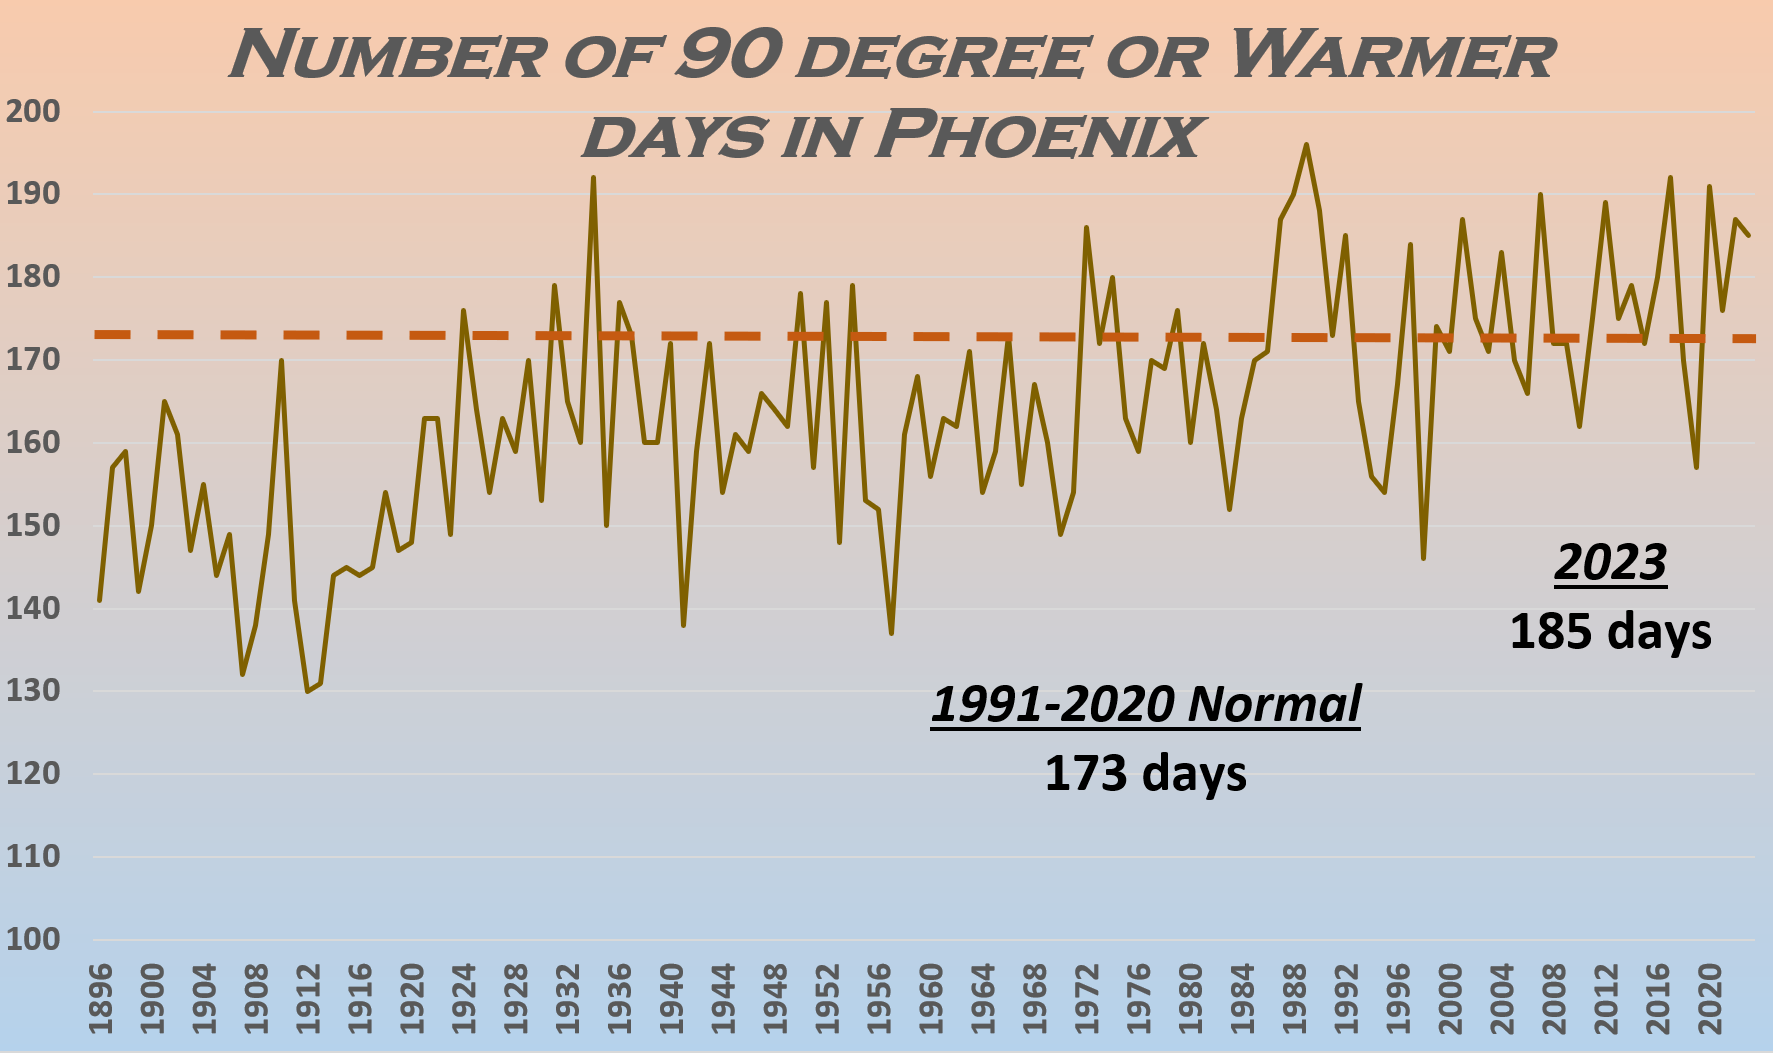
CLIMATE REPORT
NATIONAL WEATHER SERVICE PHOENIX AZ
712 AM MST TUE JAN 02 2024

...................................

...THE PHOENIX AZ CLIMATE SUMMARY FOR THE YEAR OF 2023...

CLIMATE NORMAL PERIOD 1991 TO 2020
CLIMATE RECORD PERIOD 1895 TO 2024

WEATHER         OBSERVED          NORMAL  DEPART   LAST YEAR'S
                VALUE   DATE(S)   VALUE   FROM     VALUE
                                          NORMAL
..............................................................
TEMPERATURE (F)
RECORD
 HIGH            122   06/26/1990
 LOW              16   01/07/1913
HIGHEST          119   07/19        114       5
                       07/20
                       07/25
LOWEST            35   01/24         35       0
                       02/16
AVG. MAXIMUM    88.8               87.1     1.7
AVG. MINIMUM    65.3               64.1     1.2
MEAN            77.0               75.6     1.4
DAYS MAX >= 90   185              173.4    11.6
DAYS MAX <= 32     0                0.0     0.0
DAYS MAX >= 100  133
DAYS MAX >= 110   55
DAYS MIN <= 32     0                0.6    -0.6
DAYS MIN <= 0      0                0.0     0.0
DAYS MIN >= 90    35

PRECIPITATION (INCHES)
RECORD
 MAXIMUM       19.73   1905
 MINIMUM        2.82   2002
TOTALS          4.21               7.22   -3.01
DAYS >= .01       27               33.4    -6.4
DAYS >= .10       12               17.2    -5.2
DAYS >= .50        3                4.1    -1.1
DAYS >= 1.00       0                0.9    -0.9
GREATEST
 24 HR. TOTAL   0.80   03/15 TO 03/16


DEGREE DAYS
HEATING TOTAL    844                874     -30
 SINCE 7/1       168                378    -210
COOLING TOTAL   5363               4765     598
 SINCE 1/1      5363               4764     599
..............................................................

WIND (MPH)
AVERAGE WIND SPEED              6.6
HIGHEST GUST SPEED/DIRECTION    73/190    DATE  08/31

AVERAGE RH (PERCENT)     31

WEATHER CONDITIONS. NUMBER OF DAYS WITH
THUNDERSTORM             14     HEAVY RAIN                 5
RAIN                      8     LIGHT RAIN                34
FOG W/VIS <= 1/4 MILE     1
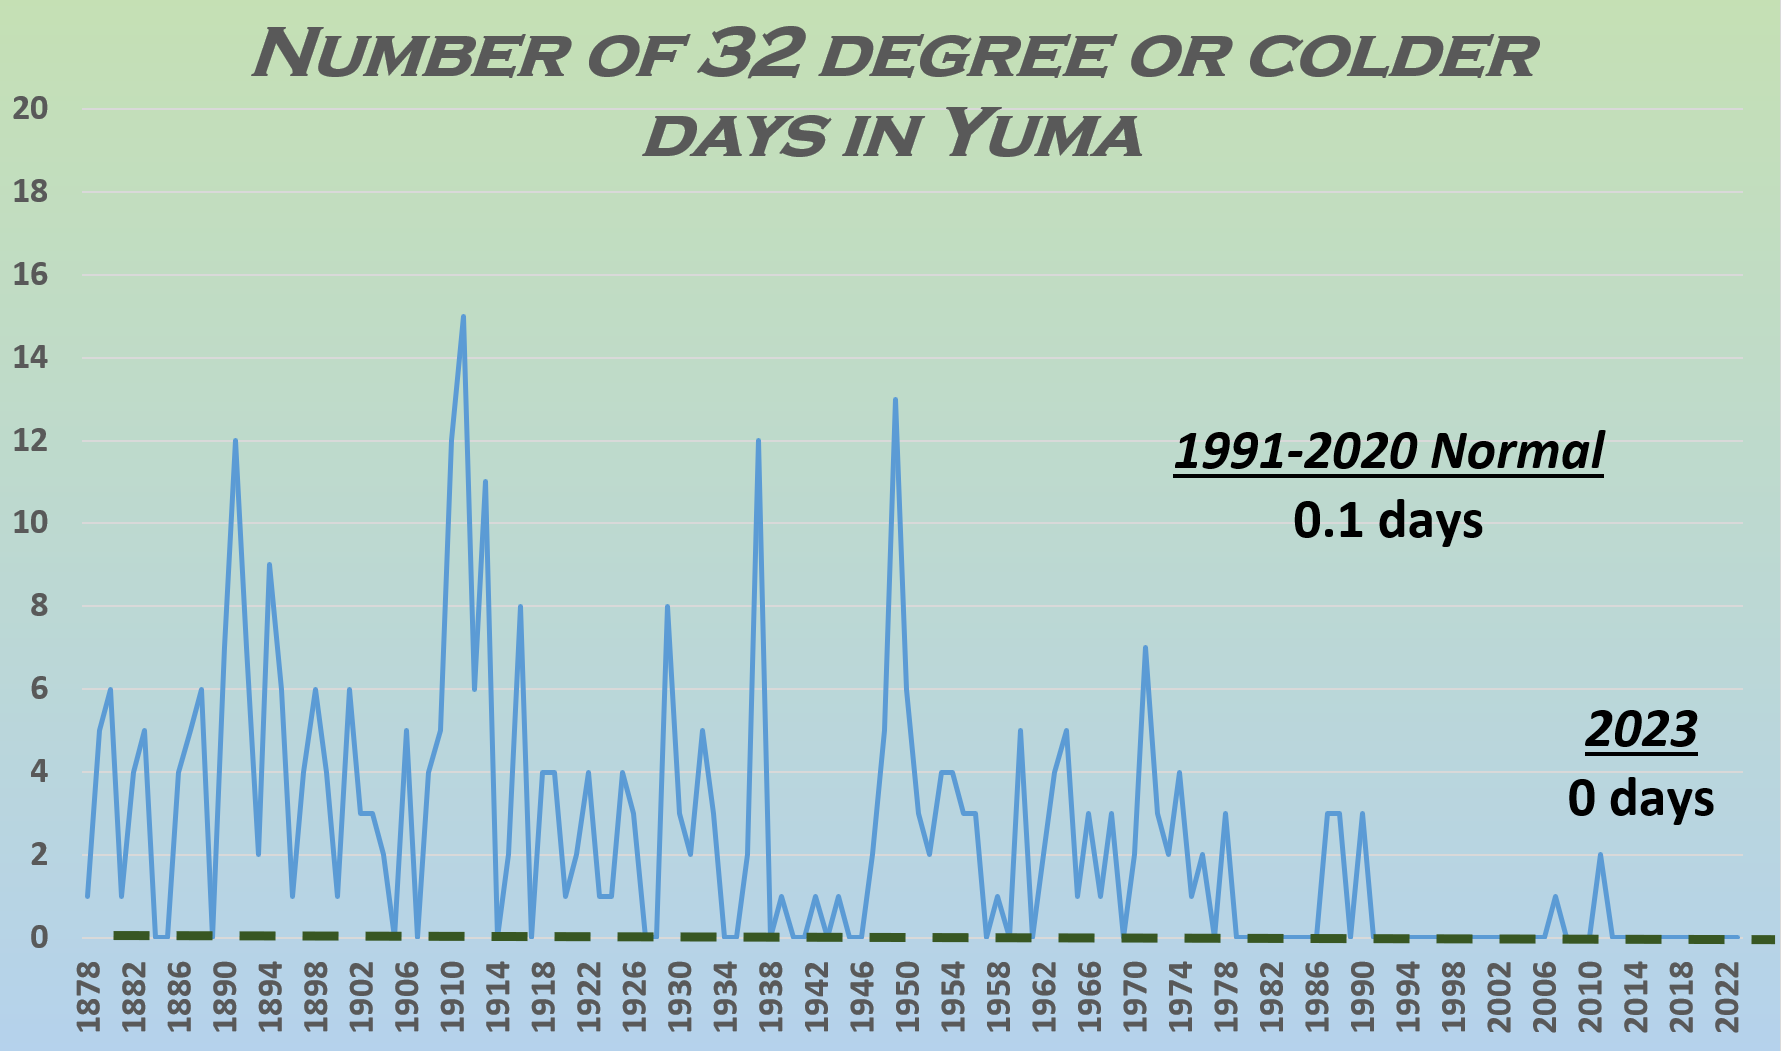
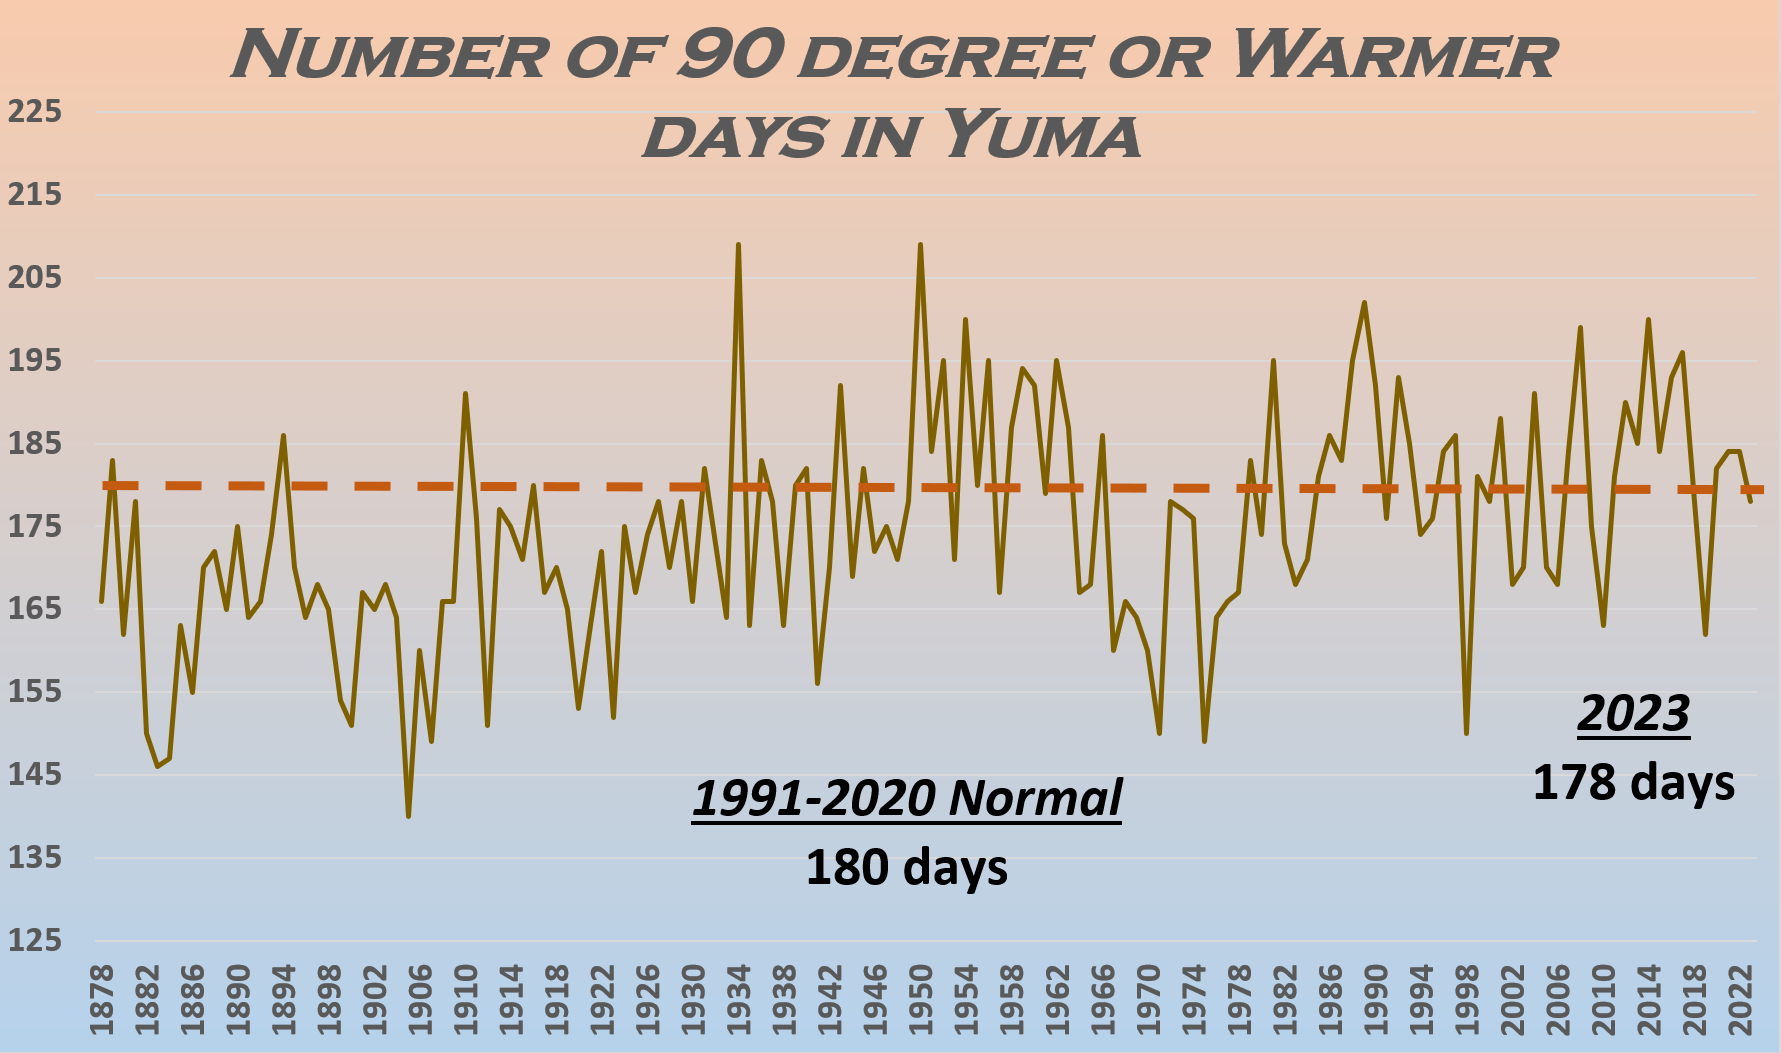
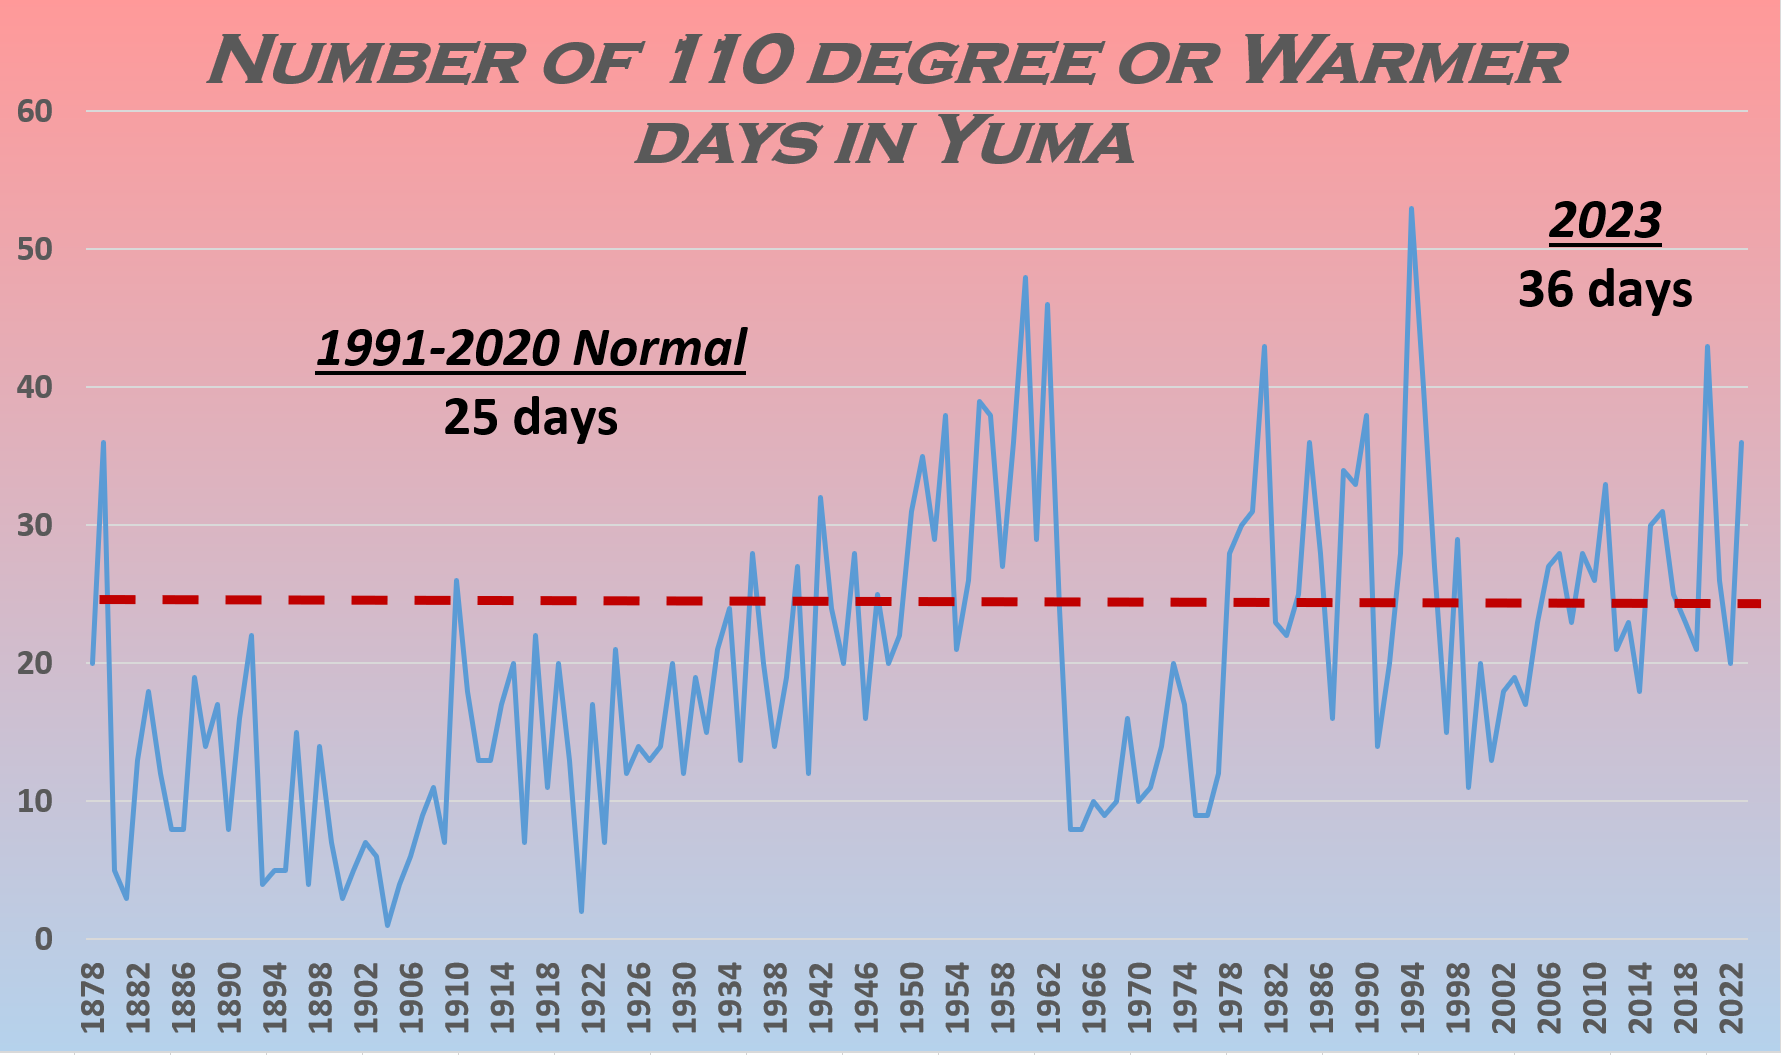
CLIMATE REPORT
NATIONAL WEATHER SERVICE PHOENIX AZ
712 AM MST TUE JAN 02 2024

...................................

...THE YUMA AZ CLIMATE SUMMARY FOR THE YEAR OF 2023...

CLIMATE NORMAL PERIOD 1991 TO 2020
CLIMATE RECORD PERIOD 1876 TO 2024

WEATHER         OBSERVED          NORMAL  DEPART   LAST YEAR'S
                VALUE   DATE(S)   VALUE   FROM     VALUE
                                          NORMAL
..............................................................
TEMPERATURE (F)
RECORD
 HIGH            124   07/28/1995
 LOW              22   01/24/1937
                       12/26/1911
                       01/20/1883
HIGHEST          118   08/28        115       3
LOWEST            37   01/21         36       1
AVG. MAXIMUM    87.5               88.1    -0.6
AVG. MINIMUM    62.4               63.8    -1.4
MEAN            75.0               75.9    -0.9
DAYS MAX >= 90   178              180.8    -2.8
DAYS MAX <= 32     0                0.0     0.0
DAYS MAX >= 100  103
DAYS MAX >= 110   36
DAYS MIN <= 32     0                0.1    -0.1
DAYS MIN <= 0      0                0.0     0.0
DAYS MIN >= 90     6

PRECIPITATION (INCHES)
RECORD
 MAXIMUM       11.41   1905
 MINIMUM        0.03   2002
TOTALS            MM               3.28      MM
DAYS >= .01       18               16.6     1.4
DAYS >= .10        4                7.9    -3.9
DAYS >= .50        2                1.4     0.6
DAYS >= 1.00       1                0.4     0.6
GREATEST
 24 HR. TOTAL   1.71   09/01 TO 09/02


DEGREE DAYS
HEATING TOTAL    762                679      83
 SINCE 7/1       181                306    -125
COOLING TOTAL   4499               4705    -206
 SINCE 1/1      4499               4704    -205
..............................................................

WIND (MPH)
AVERAGE WIND SPEED              7.0
HIGHEST GUST SPEED/DIRECTION    69/140    DATE  08/20

AVERAGE RH (PERCENT)     37

WEATHER CONDITIONS. NUMBER OF DAYS WITH
THUNDERSTORM             11     HEAVY RAIN                 2
RAIN                      6     LIGHT RAIN                17
FOG W/VIS <= 1/4 MILE     2
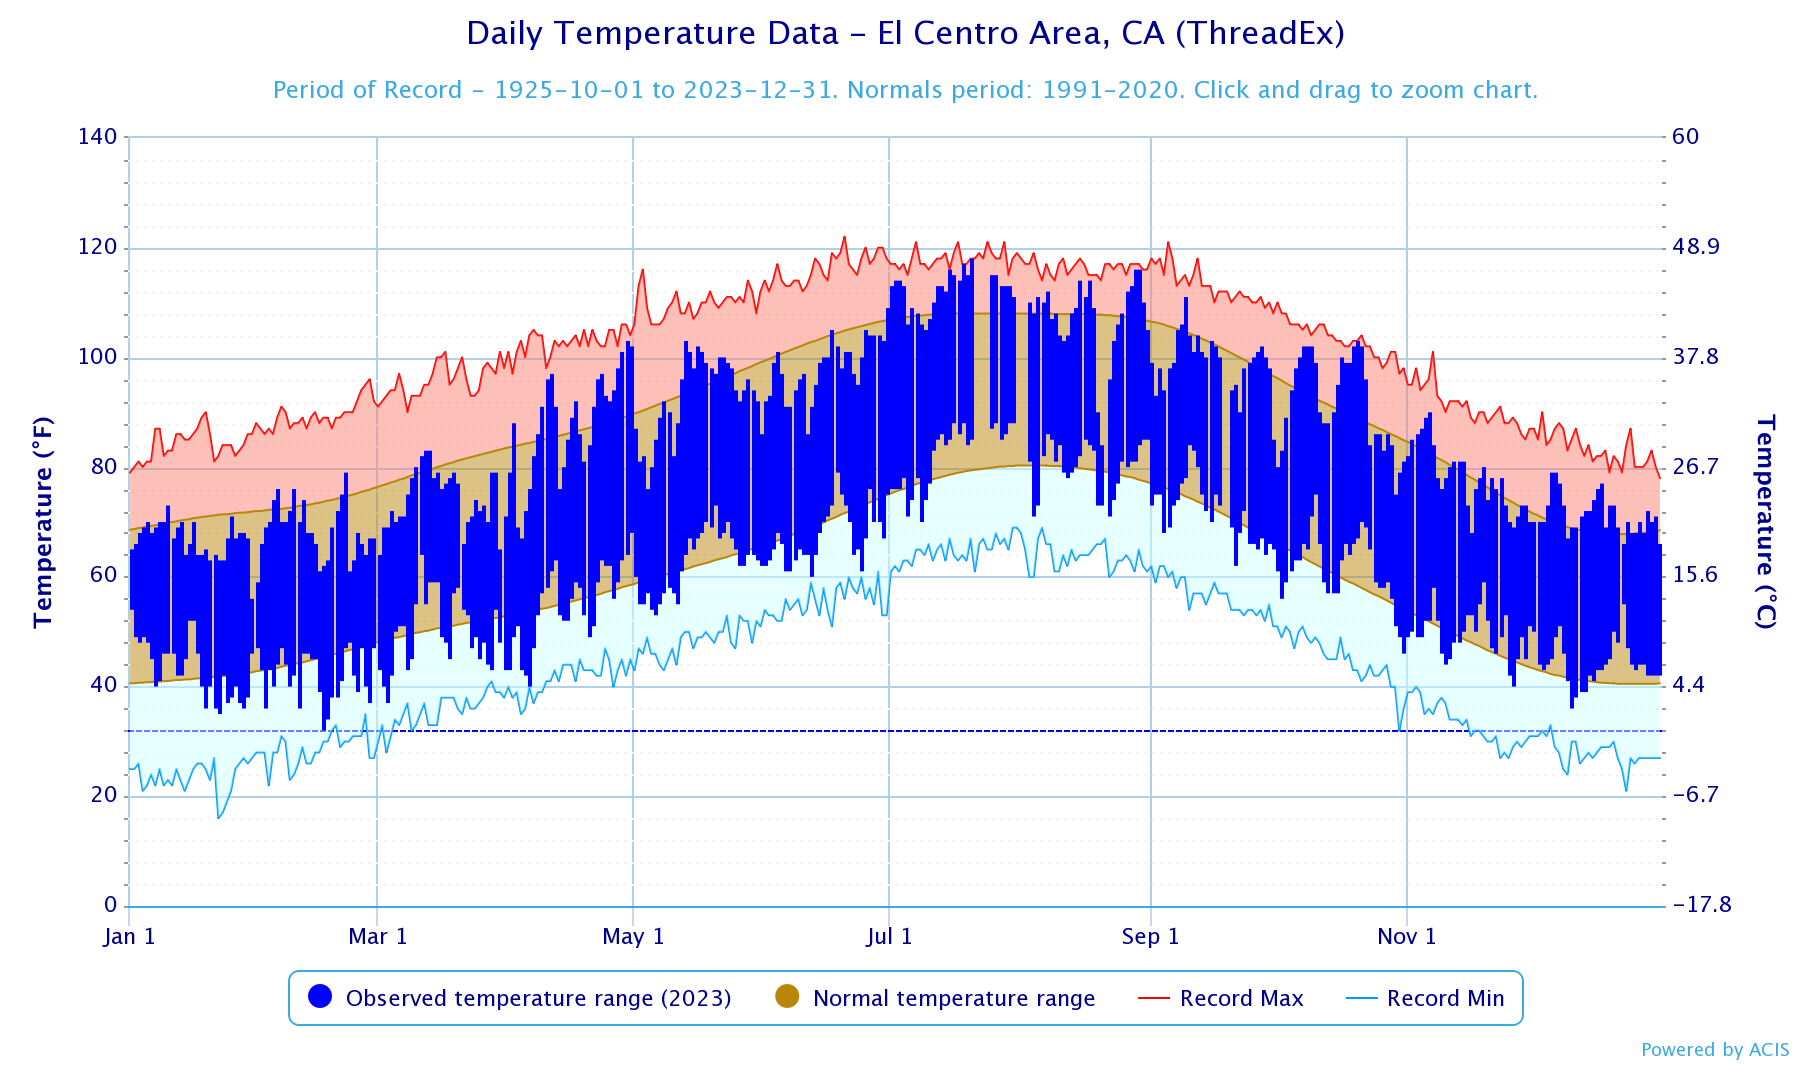
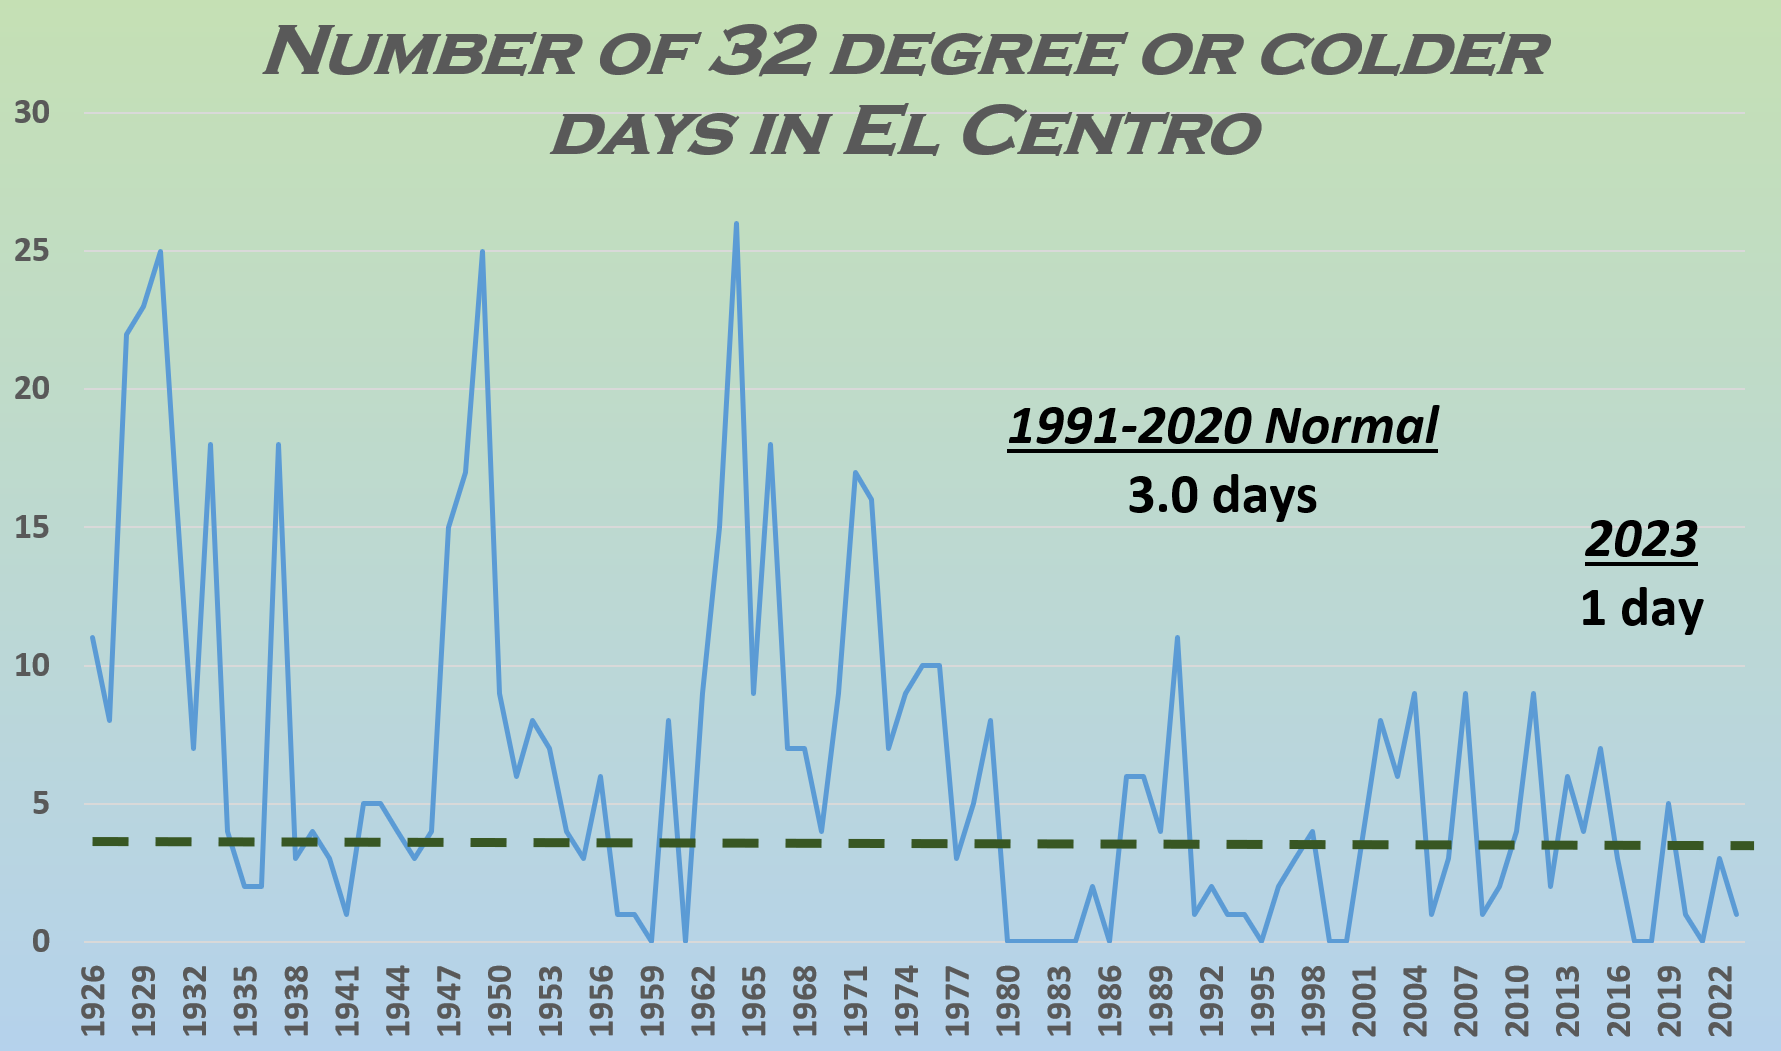
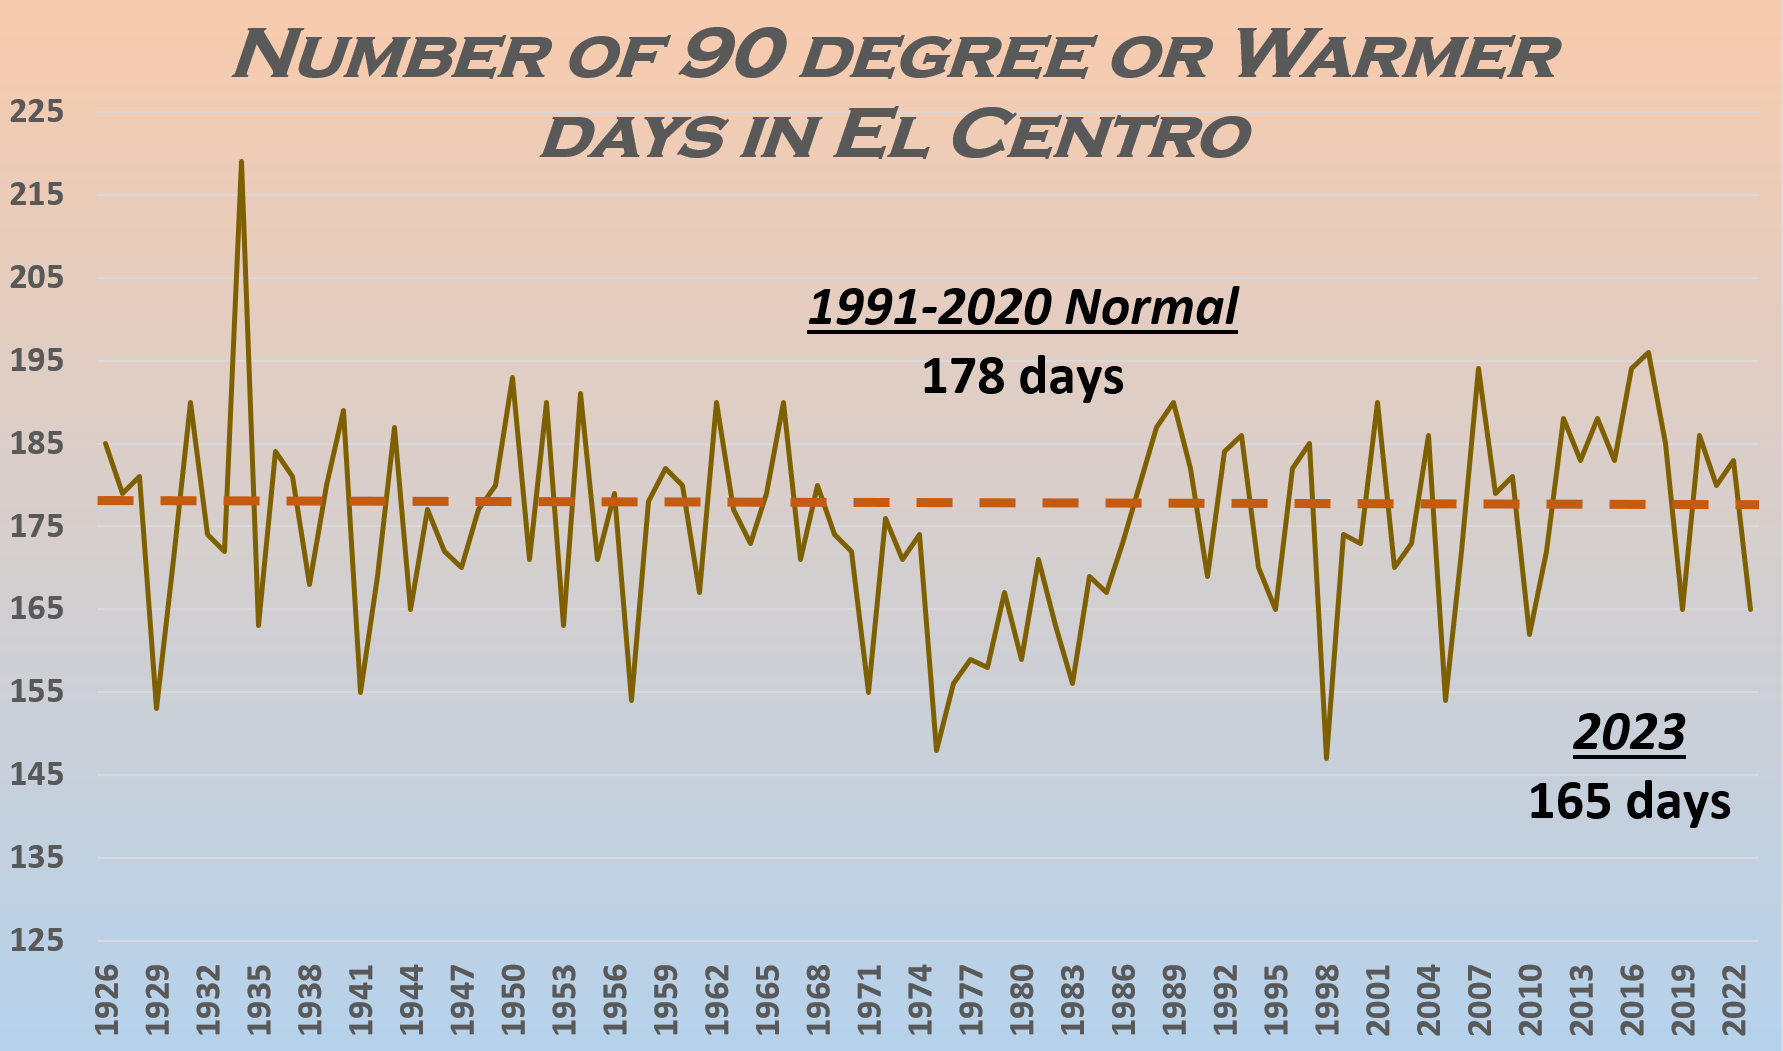
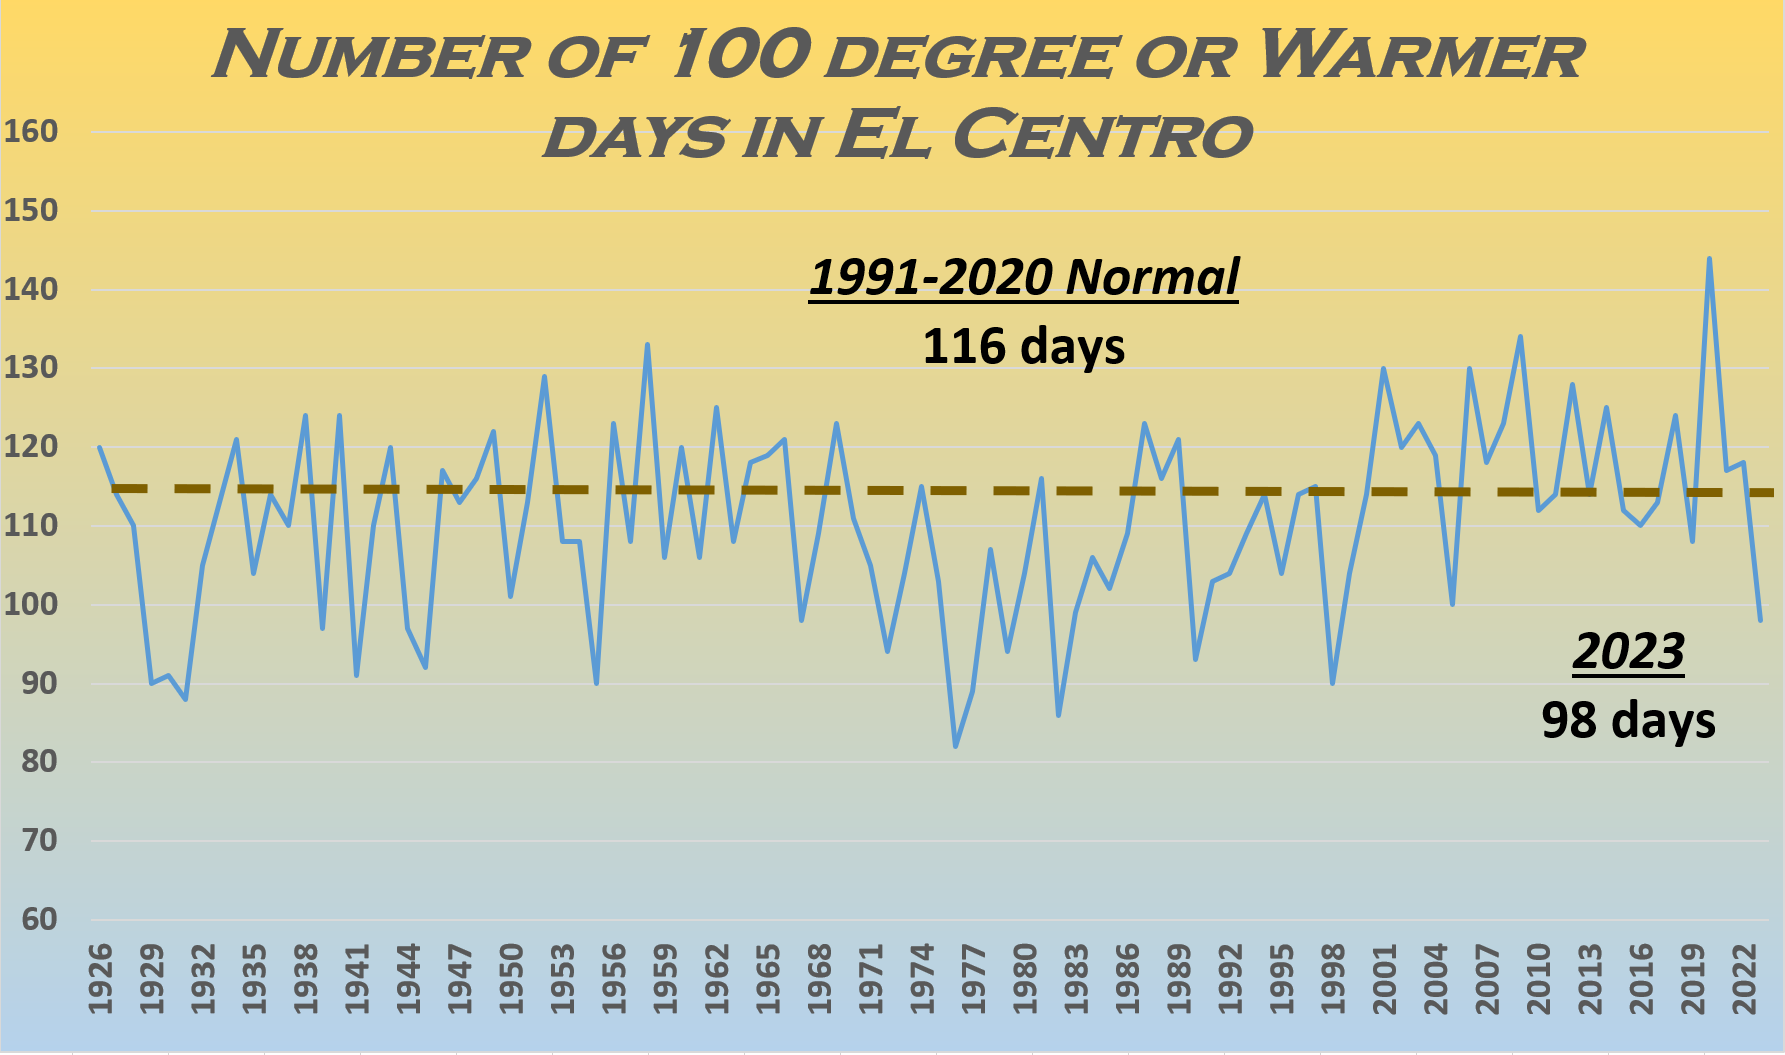
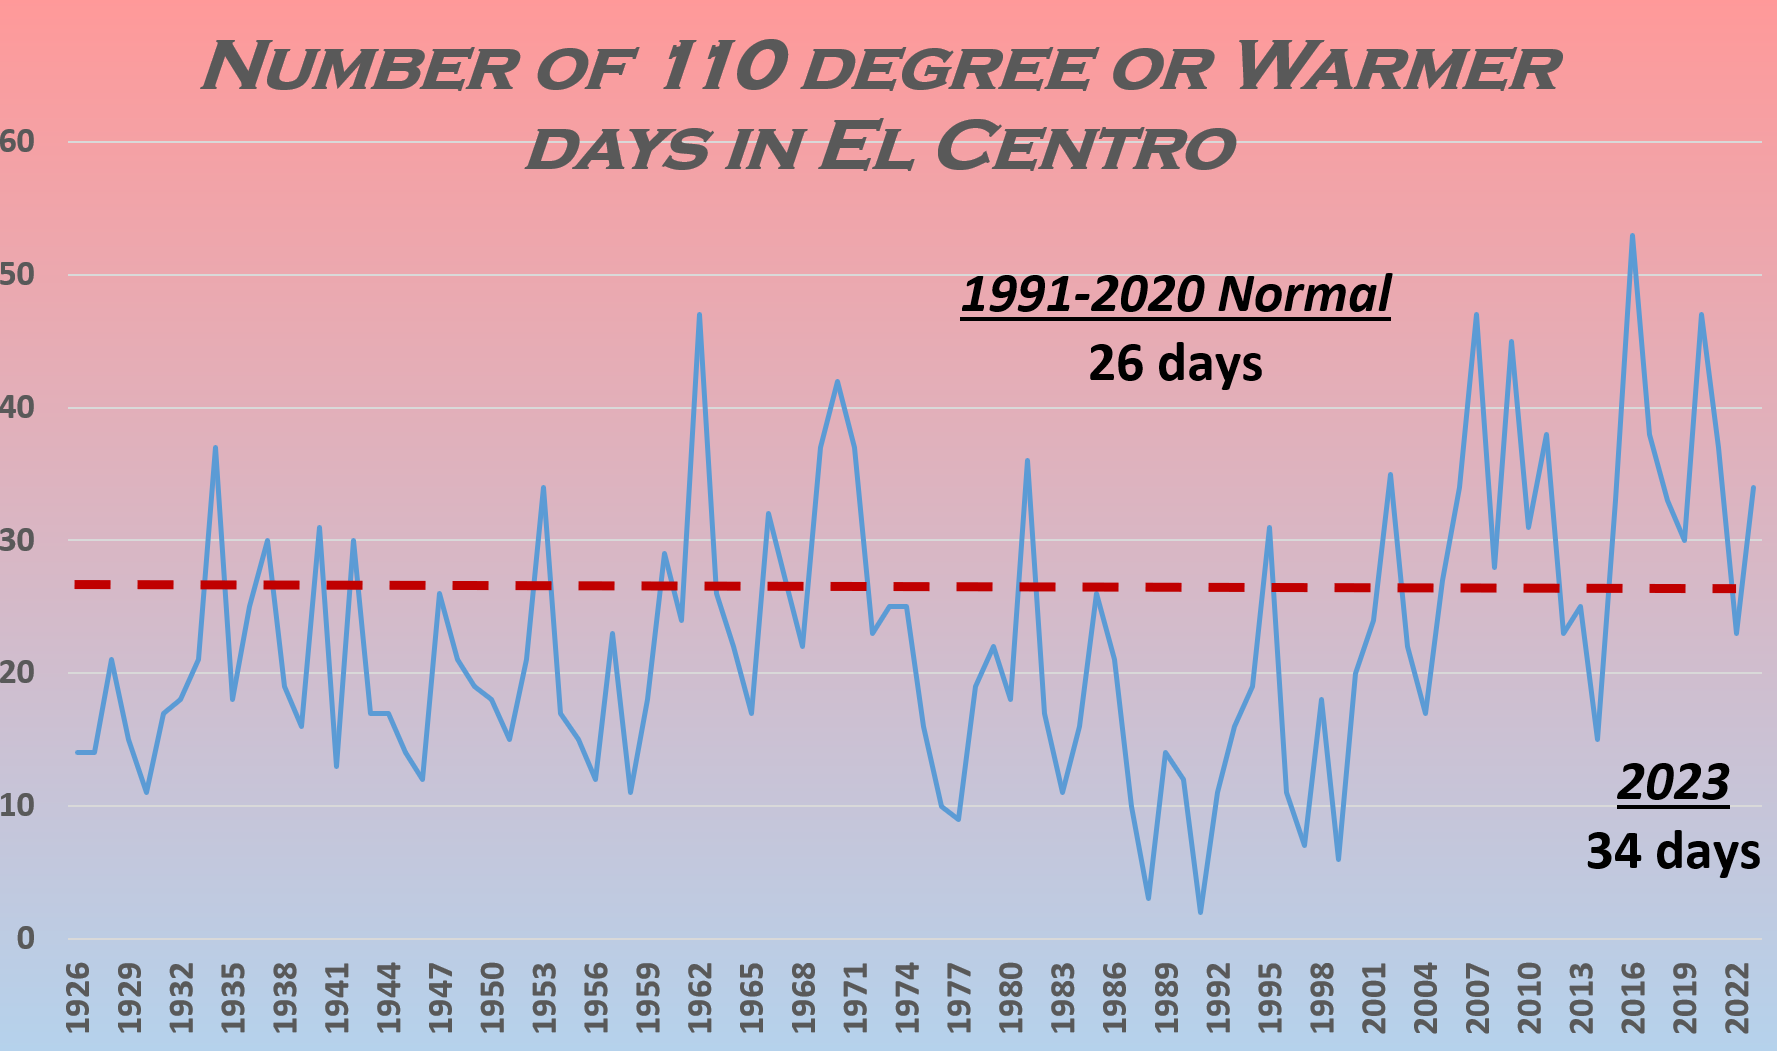
CLIMATE REPORT
NATIONAL WEATHER SERVICE PHOENIX AZ
712 AM MST TUE JAN 02 2024

...................................

...THE IMPERIAL CA CLIMATE SUMMARY FOR THE YEAR OF 2023...

CLIMATE NORMAL PERIOD 1991 TO 2020
CLIMATE RECORD PERIOD 1925 TO 2024

WEATHER         OBSERVED          NORMAL  DEPART   LAST YEAR'S
                VALUE   DATE(S)   VALUE   FROM     VALUE
                                          NORMAL
..............................................................
TEMPERATURE (F)
RECORD
 HIGH            122   06/20/2017
 LOW              16   01/22/1937
HIGHEST          118   07/20        116       2
LOWEST            32   02/16         31       1
AVG. MAXIMUM      MM               88.6      MM
AVG. MINIMUM      MM               58.7      MM
MEAN              MM               73.7      MM
DAYS MAX >= 90    MM              181.1      MM
DAYS MAX <= 32     0                0.0     0.0
DAYS MAX >= 100   MM
DAYS MAX >= 110   MM
DAYS MIN <= 32     1                4.1    -3.1
DAYS MIN <= 0      0                0.0     0.0
DAYS MIN >= 90     0


DEGREE DAYS
HEATING TOTAL   1025                966      59
 SINCE 7/1       292                430    -138
COOLING TOTAL   3838               4162    -324
 SINCE 1/1      3838               4162    -324
..............................................................

WIND (MPH)
AVERAGE WIND SPEED              7.5
HIGHEST GUST SPEED/DIRECTION    66/140    DATE  08/20

AVERAGE RH (PERCENT)     40

WEATHER CONDITIONS. NUMBER OF DAYS WITH
THUNDERSTORM              6     HEAVY RAIN                 2
RAIN                      4     LIGHT RAIN                20
FOG W/VIS <= 1/4 MILE     3

