
Severe thunderstorms today may produce damaging winds, large hail, tornadoes, and flooding over parts of the Plains into the Missouri Valley. On Sunday, scattered severe thunderstorms capable of damaging wind gusts are expected across the Mid-Atlantic vicinity. Hazardous heat will continue in the South, Southwest and central California this weekend building across the Pacific Northwest Sunday. Read More >

...Highlights of 2024...

| Element | Jan | Feb | Mar | Apr | May | Jun | Jul | Aug | Sep | Oct | Nov | Dec | Year |
| Average High | 34.0 | 42.7 | 48.7 | 58.5 | 64.6 | 85.4 | 90.00 | 88.4 | 82.4 | 68.2 | 45.7 | 45.3 | 62.8 |
| Mean High (1991-2020 Normals) | 35.2 | 37.8 | 48.8 | 56.3 | 66.8 | 79.6 | 89 | 86.7 | 75.6 | 59.7 | 45.9 | 34.7 | 59.7 |
| Average Low | 10.7 | 20.6 | 23.3 | 28.7 | 35.0 | 47.3 | 50.3 | 51.5 | 44.2 | 31.8 | 23.6 | 21.6 | 32.4 |
| Mean Low (1991-2020 Normals) | 15 | 15.4 | 22.7 | 28.2 | 37.1 | 45.4 | 53 | 51.4 | 42.2 | 30.9 | 22 | 14.8 | 31.5 |
| Average Temperature | 22.3 | 31.7 | 36.0 | 43.6 | 49.8 | 66.3 | 70.1 | 70.0 | 63.3 | 50.0 | 34.7 | 33.4 | 47.6 |
| Mean Average Temperature (1991-2020 Normals) | 25.1 | 26.6 | 35.8 | 42.3 | 52 | 62.5 | 71 | 69 | 58.9 | 45.3 | 34 | 24.8 | 45.6 |
| Departure from Normal | -2.8 | 5.1 | 0.2 | 1.3 | -2.2 | 3.8 | -0.9 | 1.0 | 4.4 | 4.7 | 0.7 | 8.6 | 2.0 |
|
Rank: 85 years of record (P.O.R 12/1939-2024) |
32 | 74 | 55 | 52 | 20 | 73 | 28 | 53 | 81 | 70 | 54 | 84 | 80 |
 |
|||||||||||||
| Highest Daily Maximum | 56 | 60 | 63 | 75 | 86 | 98 | 100 | 99 | 94 | 85 | 62 | 57 | 100 |
| Date of Occurrence | 31 | 6 | 18 | 12,13,14 | 29 | 23 | 11,25 | 3,6 | 2 | 2,4 | 11,12 | 21 | 6/11,25 |
| Lowest Daily Minimum | -37 | -16 | 13 | 18 | 19 | 36 | 39 | 34 | 30 | 21 | 3 | 8 | -37 |
| Date of Occurrence | 13 | 16 | 25 | 21 | 2 | 1 | 8 | 30 | 14,22 | 23 | 24 | 31 | 1/13 |
| Number of Days with: | Jan | Feb | Mar | Apr | May | Jun | Jul | Aug | Sep | Oct | Nov | Dec | |
| Maximum >= 90° | 0 | 0 | 0 | 0 | 0 | 7 | 16 | 6 | 0 | 0 | 0 | 0 | 43 |
| Maximum <= 32° | 12 | 5 | 1 | 0 | 0 | 0 | 0 | 0 | 0 | 0 | 1 | 2 | 21 |
| Minimum <= 32° | 28 | 27 | 28 | 19 | 8 | 0 | 0 | 0 | 3 | 18 | 25 | 30 | 186 |
| Minimum <= 0° | 8 | 2 | 0 | 0 | 0 | 0 | 0 | 0 | 0 | 0 | 0 | 0 | 10 |
| Record High Temperatures Set or Tied | 1 | 0 | 0 | 1 | 0 | 0 | 1 | 2 | 1 | 1 | 1 | 3 | 11 |
| Record Low Temperatures Set or Tied | 0 | 0 | 0 | 0 | 1 | 1 | 0 | 2 | 0 | 0 | 0 | 0 | 4 |
Daily Records:
Record High Temperatures:
May: 23 on the 4thJanuary: 53 on the 29th (tie)April: 75 on the 12th (tie)July: 100 on the 25thAugust: 99 on the 3rd. 96 on the 21st.September: 91 on the 29th (also the latest 90 degree day on record)October: 85 on the 4thNovember: 60 on the 23rd (tie)December: 56 on the 20th (tie). 57 on the 21st. 51 on the 29th (tie)Record Low Temperatures:
June: 37 on the 29thAugust: 36 on the 29th. 34 on the 30th (tie)
| Warmest Months of September on Record | |||||||
| Rank | Year | Average Temperature °F | |||||
| 1 | 1998 | 64.7 | |||||
| 2 | 2015 | 64.4 | |||||
| 3 | 1940 | 64.3 | |||||
| 4 | 1963 | 64.1 | |||||
| 5 | 2024 | 63.3 | |||||
| 6 | 1969,1990,1952 | 63.2 | |||||
| 9 | 1948 | 63.1 | |||||
| 10 | 1994 | 62.8 | |||||
| Warmest Months of December on Record | |||||||
| Rank | Year | Average Temperature °F | |||||
| 1 | 1980 | 34.3 | |||||
| 2 | 2024 | 33.4 | |||||
| 3 | 1946 | 33.0 | |||||
| 4 | 2023 | 32.0 | |||||
| 5 | 1957/1994 | 31.8 | |||||
| 6 | 1950 | 31.2 | |||||
| 7 | 1962 | 30.4 | |||||
| 8 | 1959 | 30.3 | |||||
| 9 | 2021 | 30.1 | |||||
| 10 | 1999 | 29.9 | |||||
| Top Ten Warmest Years on Record | |||||||
| Rank | Year | Average Temperature °F | |||||
| 1 | 1994 | 49.1 | |||||
| 2 | 2012 | 48.7 | |||||
| 3 | 1954 | 48.3 | |||||
| 4 | 1981 | 48.1 | |||||
| 5 | 1992 | 48.0 | |||||
| 6 | 2024 | 47.6 | |||||
| 7 | 1940, 1953, 1963 | 47.3 | |||||
| 10 | 2015, 2006, 1999 | 47.1 | |||||
| Top Ten Coldest Years on Record | |||||||
| Rank | Year | Average Temperature °F | |||||
| 1 | 1985 | 42.5 | |||||
| 2 | 1951 | 43.1 | |||||
| 3 | 1978 | 43.2 | |||||
| 4 | 1964 | 43.5 | |||||
| 5 | 2019, 1975 | 43.6 | |||||
| 6 | 2009, 1979, 1968, 1949 | 43.8 | |||||
| 11 | 1971 | 43.9 | |||||
| 80 | 2024 | 47.6 | |||||
 |
 |
| Average Annual Temperature for Period of Record - Click on Graph to Enlarge | |
 |
Learn more about the National Weather Service's efforts to build a Weather-Ready Nation! |

| Element | Jan | Feb | Mar | Apr | May | Jun | Jul | Aug | Sep | Oct | Nov | Dec | Year |
| Total (inches) | 0.48 | 0.24 | 1.33 | 1.59 | 1.28 | 0.53 | 1.14 | 0.72 | 2.55 | 1.56 | 0.27 | 0.36 | 12.05 |
| Mean Precipitation (1991-2020 Normals) |
0.49 | 0.56 | 0.84 | 1.41 | 2.21 | 1.34 | 1.19 | 0.79 | 0.95 | 1.19 | 0.64 | 0.61 | 12.22 |
| Departure from Normal | -0.01 | -0.32 | 0.49 | 0.18 | -0.93 | -0.81 | -0.05 | -0.07 | 1.6 | 0.37 | -0.37 | -0.25 | -0.17 |
| Percent of Normal | 98 | 43 | 158 | 113 | 58 | 40 | 96 | 91 | 268 | 131 | 42 | 59 | 99 |
|
Rank - |
44 | 8 | 68 | 62 | 27 | 17 | 50 | 50 | 81 | 71 | 14 | 28 | 47 |
 |
|||||||||||||
| Greatest 24-HR Total | 0.23 | 0.08 | 0.8 | 0.46 | 0.31 | 0.27 | 0.50 | 0.44 | 2.05 | 0.63 | 0.23 | 0.15 | 2.05 |
| Dates of Occurrence | 3 | 6-7 | 6-7 | 17-18 | 18-19 | 11-12 | 29 | 27 | 16-17 | 15-16 | 28-29 | 26-27 |
9/16-17 |
| Number of Days with: | |||||||||||||
| Precipitation >= 0.01 | 9 | 5 | 10 | 9 | 11 | 7 | 7 | 5 | 6 | 11 | 5 | 6 | 91 |
| Precipitation >= 0.10 | 2 | 0 | 3 | 6 | 5 | 1 | 3 | 2 | 3 | 5 | 1 | 2 | 33 |
| Precipitation >= 1.00 | 0 | 0 | 0 | 0 | 0 | 0 | 0 | 0 | 1 | 0 | 0 | 0 | 1 |
| Days with Thunderstorms | 0 | 0 | 2 | 0 | 6 | 9 | 9 | 5 | 7 | 2 | 0 | 0 | 40 |
| Daily Precipitation Records Set or Tied | 0 | 0 | 1 | 0 | 0 | 0 | 0 | 1 | 3 | 0 | 0 | 0 | 5 |
One Day Precipitation Records:
March: 0.77" on the 6th
August: 0.44" on the 27th
September: 1.24" on the 16th, 0.82" on the 17th, and 0.38" on the 23rd
|
Top Ten Driest February's on Record |
|||||||
| Rank | Year | Precipitation (inches) | |||||
| 1 | 1941 | 0.06 | |||||
| 2 | 2005 | 0.13 | |||||
| 3 | 1957 | 0.15 | |||||
| 4 | 1951 | 0.16 | |||||
| 5 | 2002 | 0.17 | |||||
| 6 | 1981 | 0.23 | |||||
| 7 | 2025,1996 | 0.24 | |||||
| 9 | 2007 | 0.26 | |||||
| 10 | 1970 | 0.27 | |||||
| Top Ten Wettest September's on Record | |||||||
| Rank | Year | Precipitation (inches) | |||||
| 1 | 1982 | 3.40 | |||||
| 2 | 1973 | 3.28 | |||||
| 3 | 1989 | 3.22 | |||||
| 4 | 1950 | 3.11 | |||||
| 5 | 1995 | 2.56 | |||||
| 6 | 2025 | 2.55 | |||||
| 7 | 1961 | 2.46 | |||||
| 8 | 1965 | 2.07 | |||||
| 9 | 1959 | 1.99 | |||||
| 10 | 2004 | 1.72 | |||||
| Top Ten Driest Years on Record | |||||||
| Rank | Year | Precipitation (inches) | |||||
| 1 | 2020 | 5.79 | |||||
| 2 | 1988 | 6.56 | |||||
| 3 | 2001 | 6.76 | |||||
| 4 | 2002 | 7.05 | |||||
| 5 | 1960 | 7.34 | |||||
| 6 | 1954 | 7.70 | |||||
| 7 | 2012 | 7.88 | |||||
| 8 | 1963 | 7.90 | |||||
| 9 | 1966 | 8.14 | |||||
| 10 | 1943 | 8.91 | |||||
| 47 | 2025 | 12.05 | |||||
| Top Ten Wettest Years on Record | |||||||
| Rank | Year | Precipitation (inches) | |||||
| 1 | 1982 | 20.48 | |||||
| 2 | 1995 | 18.94 | |||||
| 3 | 1983 | 18.41 | |||||
| 4 | 1978 | 17.64 | |||||
| 5 | 1941 | 16.24 | |||||
| 6 | 1957 | 16.12 | |||||
| 7 | 1986 | 15.92 | |||||
| 8 | 1993 | 15.91 | |||||
| 9 | 2009 | 15.77 | |||||
| 10 | 2016 | 15.57 | |||||
| 40 | 2025 | 12.05 | |||||
 |
 |
| Annual Precipitation for Period of Record - Click on Graph to Enlarge | |
|
Learn more about the National Weather Service's efforts to build a Weather-Ready Nation! |

| Element | Jan | Feb | Mar | Apr | May | Jun | Jul | Aug | Sep | Oct | Nov | Dec | Year |
| Total (inches) | 6.5 | 8.8 | 2.7 | 6.6 | 3.9 | 0 | 0 | 0 | 0 | *11 | *4.9 | 1.5 | 45.9 |
| Mean Snowfall (1991-2020 Normals) | 9 | 10.9 | 10.3 | 10.5 | 2.6 | 0.1 | 0 | 0 | 1.5 | 7 | 8.9 | 11 | 71.8 |
| Departure from Normal | -2.5 | -2.1 | -7.6 | -3.9 | 1.3 | -0.1 | 0.0 | 0.0 | -1.5 | 4 | -4 | -9.5 | -25.9 |
| Percent of Normal | 72 | 81 | 26 | 63 | 150 | 0 | 0 | 0 | 0 | 157 | 55 | 14 | 64 |
| Rank - Least to Most 85 years (P.O.R 12/1939-2024) |
27 | 39 | 4 | 31 | 62 | NA | NA | NA | NA | 68 | 25 | 3 | 6 |
|
|||||||||||||
| Greatest 24-HR Total | 2.1 | 2.9 | 1.2 | 4.8 | 3.9 | 0 | 0 | 0 | 0 | 11 | 3 | 1.5 | 11 |
| Dates of Occurrence | 11 | 16 | 25 | 6 | 3 | NA | NA | NA | NA | 30 | 25 | 30 | 10/30 |
| Number of Days with: | |||||||||||||
| Snowfall >= 1.0 inch | 2 | 4 | 1 | 1 | 1 | 0 | 0 | 0 | 0 | 1 | 2 | 1 | 13 |
| Daily Snowfall Records Set or Tied | 0 | 0 | 0 | 0 | 0 | 0 | 0 | 0 | 0 | 0 | 0 | 0 | 0 |
|
* October and November snowfall estimated due to no official observer. Note: 50 months of September on record with no snowfall. |
|||||||||||||
Snowfall Ranks and Records:
March had 4th least snowfall on record
December had 3rd least snowfall on record
One Day Snowfall Records (inches):
There were no daily snowfall records set in 2024.
| Top Ten Snowiest Years on Record | |||||||
| Rank | Year | Snowfall (inches) | |||||
| 1 | 1982 | 137.6 | |||||
| 2 | 1975 | 124.0 | |||||
| 3 | 1984 | 121.2 | |||||
| 4 | 1973 | 118.3 | |||||
| 5 | 2023 | 116.1 | |||||
| 6 | 1983 | 114.2 | |||||
| 7 | 1978 | 112.7 | |||||
| 8 | 2021 | 108.1 | |||||
| 9 | 2013 | 107.5 | |||||
| 10 | 1955 | 103.3 | |||||
| 80 | 2024 | 45.9 | |||||
  |
  |
|
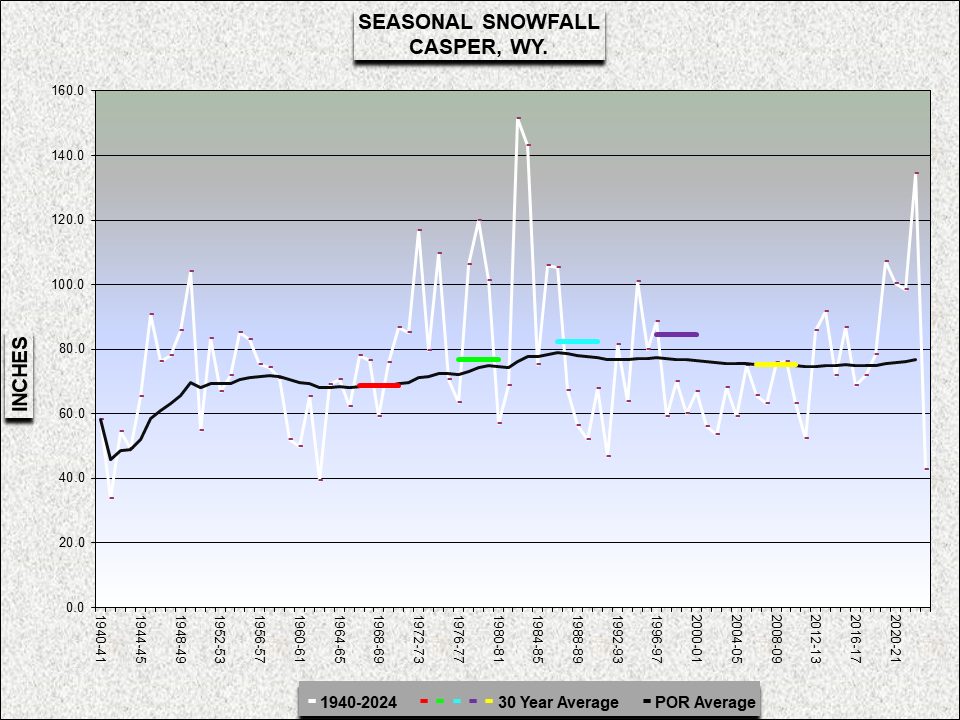
| Annual and Seasonal Snowfall for Period of Record - Click on Graph to Enlarge | ||
|
Learn more about the National Weather Service's efforts to build a Weather-Ready Nation! |

| Element | Jan | Feb | Mar | Apr | May | Jun | Jul | Aug | Sep | Oct | Nov | Dec | Year |
| Average Speed (MPH) | 12.8 | 14.9 | 13.1 | 10.7 | 10.9 | 11.5 | 8.7 | 9.9 | 10.1 | 9.8 |
13
|
14.8
|
11.7 |
| Maximum 3-sec Gust | 53 | 62 | 59 | 47 | 53 | 59 | 57 | 58 | 60 | 46 | 60 |
61
|
62 |
| Direction | 210 | 240 | 210 | 220 | 260/280 | 240 | 20 | 240 | 210 | 210 | 220 |
210
|
240 |
| Date of Occurrence | 9 | 26 | 2 | 5 | 17/29 | 24 | 6 | 25 | 18 | 27 | 13 | 8 | 2/26 |
| Number of Days with: | |||||||||||||
| 2-Min Wind >50 mph | 0 | 0 | 0 | 0 | 0 | 0 | 0 | 0 | 0 | 0 | 0 | 0 | 0 |
| Peak Wind >50 mph | 1 | 4 | 2 | 0 | 4 | 6 | 4 | 3 | 3 | 0 | 3 | 6 | 36 |
| Peak Wind >70 mph | 0 | 0 | 0 | 0 | 0 | 0 | 0 | 0 | 0 | 0 | 0 | 0 | 0 |
|
Learn more about the National Weather Service's efforts to build a Weather-Ready Nation! |

