
Major Hurricane Erin is tracking just north of the lower Bahamas today. Dangerous surf and rip current threats increase this week for most of the Atlantic coastline. Erin's outerbands may impact the Outer Banks later this week. Hot to extremely hot temperatures are forecast today and Tuesday from a part of the southern Plains into the central to lower Mississippi River Valley. Read More >
...Highlights of 2018...

| Element | Jan | Feb | Mar | Apr | May | Jun | Jul | Aug | Sep | Oct | Nov | Dec | Year |
| Average High | 33.2 | 33.4 | 48.7 | 58.5 | 67.8 | 78.7 | 88.5 | 84.5 | 78.2 | 57.5 | 40.3 | 33.2 | 58.5 |
| Mean High (1981-2010 Normals) | 33.1 | 36.5 | 47.4 | 56.4 | 66.5 | 77.5 | 86.8 | 85.0 | 72.8 | 58.5 | 42.8 | 31.8 | 58.0 |
| Average Low | 12.6 | 8.4 | 23.8 | 29.4 | 42.8 | 49.3 | 56.1 | 54.2 | 45.4 | 31.6 | 17.9 | 11.5 | 31.9 |
| Mean Low (1981-2010 Normals) | 10.2 | 13.9 | 23.6 | 31.3 | 40.1 | 48.4 | 55.6 | 54.3 | 44.4 | 32.7 | 19.7 | 9.6 | 32.1 |
| Average Temperature | 22.9 | 20.9 | 36.3 | 43.9 | 55.3 | 64.0 | 72.3 | 69.4 | 61.8 | 44.6 | 29.1 | 22.3 | 45.2 |
| Mean Temp (1981-2010 Normals) | 21.7 | 25.2 | 35.5 | 43.9 | 53.3 | 63.0 | 71.2 | 69.6 | 58.6 | 45.6 | 31.2 | 20.7 | 45.0 |
| Departure from Normal | 1.2 | -4.3 | 0.8 | 0.0 | 2.0 | 1.0 | 1.1 | -0.2 | 3.2 | -1.0 | -2.1 | 1.6 | 0.2 |
| Rank: Coldest to Warmest 127 years of record (P.O.R 1892-2018) |
89 | 35 | 89 | 75 | 100 | 92 | 97 | 85 | 109 | 45 | 37 | 73 | 91 |
 |
|||||||||||||
| Highest Daily Maximum | 52 | 54 | 64 | 76 | 83 | 92 | 98 | 98 | 90 | 81 | 62 | 48 | 98 |
| Date of Occurrence | 30 | 8 | 22 | 28 | 26 | 28 | 7,8 | 11 | 15 | 2 | 2 | 21 | 7/8, 7/9. 8/11 |
| Lowest Daily Minimum | -11 | -15 | 12 | 13 | 29 | 36 | 45 | 44 | 32 | 13 | 1 | -5 | -15 |
| Date of Occurrence | 2 | 20 | 1 | 3 | 1 | 2 | 1 | 29 | 26 | 15 | 18 | 29 | 2/20 |
| Number of Days with: | |||||||||||||
| Maximum >= 90° | 0 | 0 | 0 | 0 | 0 | 5 | 13 | 9 | 1 | 0 | 0 | 0 | 28 |
| Maximum <= 32° | 12 | 11 | 1 | 0 | 0 | 0 | 0 | 0 | 0 | 1 | 8 | 15 | 48 |
| Minimum <= 32° | 31 | 27 | 29 | 21 | 2 | 0 | 0 | 0 | 1 | 16 | 30 | 31 | 188 |
| Minimum <= 0° | 3 | 7 | 0 | 0 | 0 | 0 | 0 | 0 | 0 | 0 | 0 | 2 | 12 |
| Record High Temperatures Set or Tied | 0 | 0 | 0 | 0 | 0 | 0 | 0 | 1 | 1 | 0 | 0 | 0 | 2 |
| Record Low Temperatures Set or Tied | 0 | 0 | 0 | 0 | 0 | 0 | 0 | 0 | 0 | 0 | 0 | 0 | 0 |
Daily Records:
Record High Temperatures:
August: 98 on the 11th.
September: 88 on the 10th.Record Low Temperatures:
None.
| Top Ten Warmest Years on Record | |||||||
| Rank | Year | Average Temperature °F | |||||
| 1 | 2012 | 49.0 | |||||
| 2 | 1988, 1981 | 47.7 | |||||
| 4 | 1934 | 47.6 | |||||
| 5 | 1994 | 47.5 | |||||
| 6 | 2006 | 47.4 | |||||
| 7 | 1954 | 47.2 | |||||
| 8 | 1999 | 47.0 | |||||
| 9 | 2015 | 46.9 | |||||
| 10 | 2016, 2007, 1990 | 46.6 | |||||
| 36 | 2018 | 45.2 | |||||
| Top Ten Coldest Years on Record | |||||||
| Rank | Year | Average Temperature °F | |||||
| 1 | 1912 | 39.9 | |||||
| 2 | 1944 | 40.1 | |||||
| 3 | 1920 | 40.2 | |||||
| 4 | 1916, 1898 | 40.9 | |||||
| 6 | 1895 | 41.0 | |||||
| 7 | 1924 | 41.1 | |||||
| 8 | 1913, 1899, 1923 | 41.2 | |||||
| 91 | 2018 | 45.2 | |||||
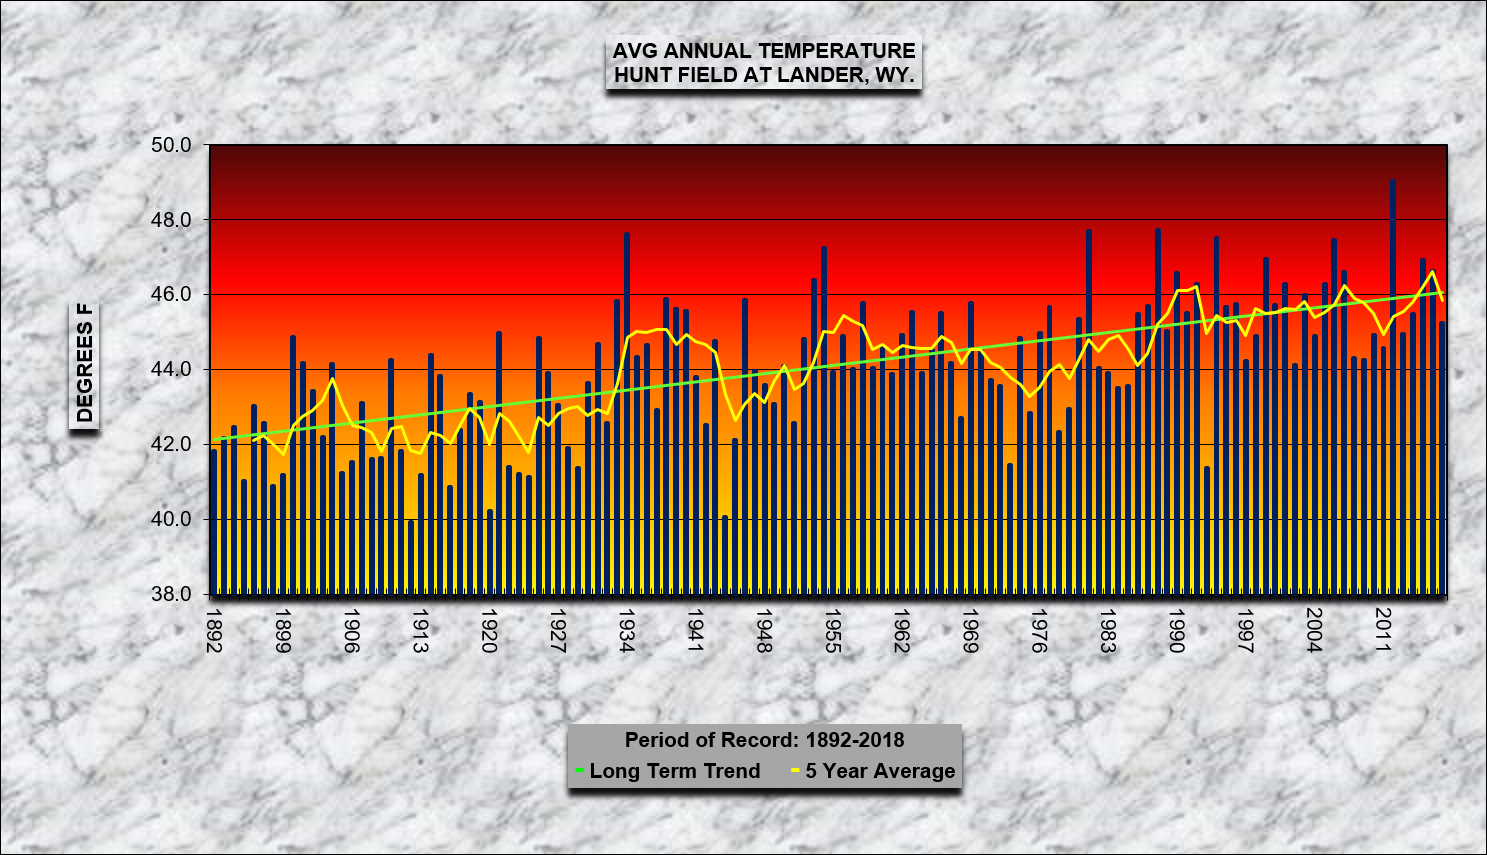 |
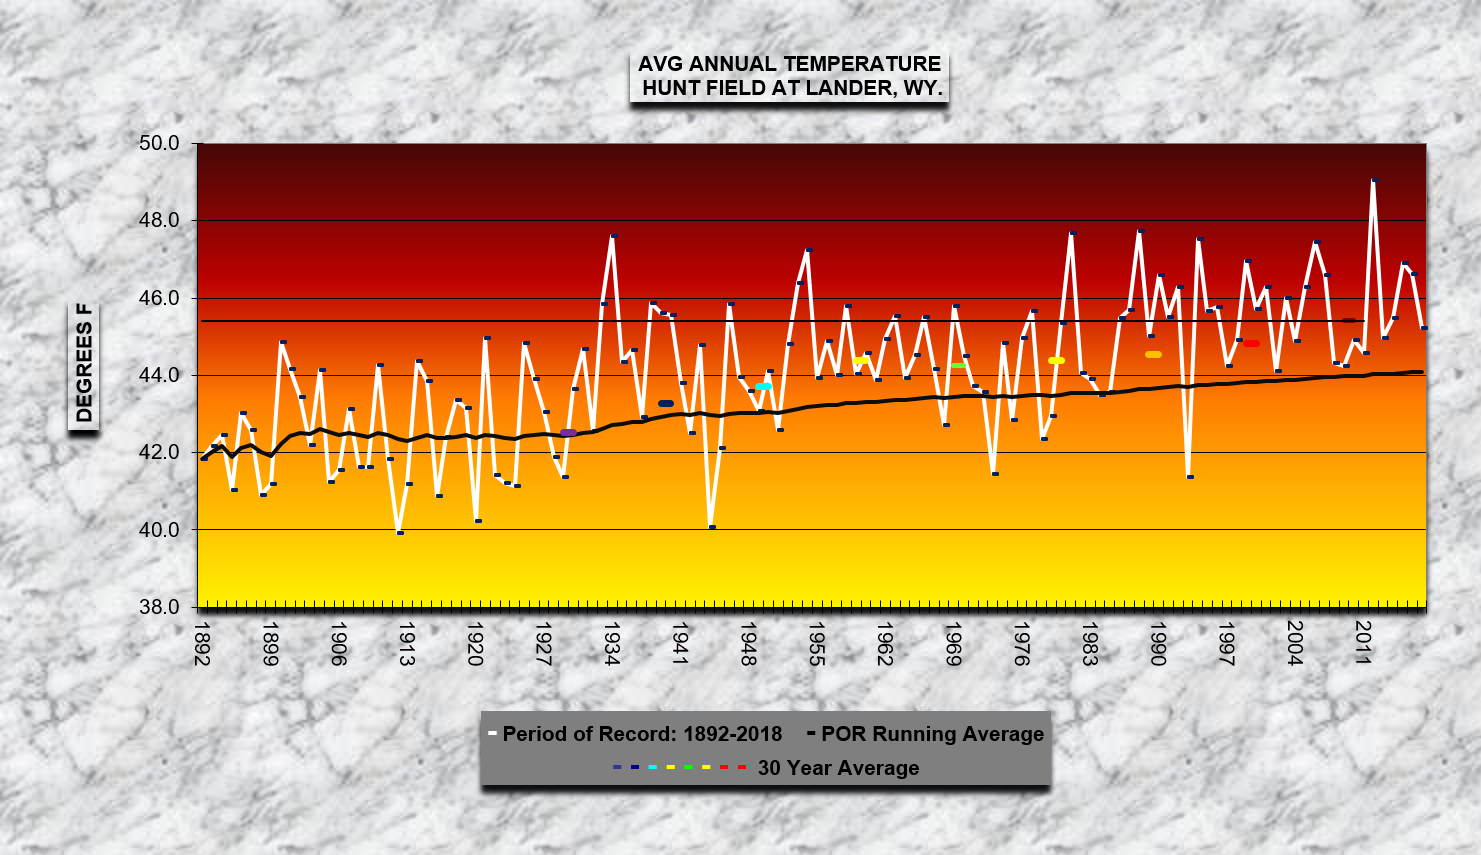 |
| Average Annual Temperature for Period of Record - Click on Graph to Enlarge | |
 |
Learn more about the National Weather Service's efforts to build a Weather-Ready Nation! |

| Element | Jan | Feb | Mar | Apr | May | Jun | Jul | Aug | Sep | Oct | Nov | Dec | Year |
| Average Speed (MPH) | 4.1 | 5.9 | 7.1 | 7.6 | 6.2 | 7.1 | 6.7 | 7.0 | 6.5 | 5.5 | 4.6 | 4.4 | 6.1 |
| Maximum 3-sec Gust | 68 | 66 | 56 | 68 | 52 | 49 | 52 | 63 | 54 | 47 | 60 | 52 | 68 |
| Direction (degrees) | 250 | 340 | 210 | 170 | 230 | 240 | 280 | 310 | 260 | 280 | 280 | 250 | 250, 170 |
| Date of Occurrence | 30 | 5 | 24 | 16 | 9 | 10 | 3 | 12 | 23 | 3 | 2 | 21 | 1/30, 4/16 |
 |
Learn more about the National Weather Service's efforts to build a Weather-Ready Nation! |

| Element | Jan | Feb | Mar | Apr | May | Jun | Jul | Aug | Sep | Oct | Nov | Dec | Year |
| Total (inches) | 0.68 | 0.94 | 1.09 | 1.49 | 4.07 | 1.66 | 0.67 | 0.21 | 0.05 | 1.10 | 0.88 | 0.58 | 13.42 |
| Mean Precip (1981-2010 Normals) | 0.41 | 0.58 | 1.16 | 1.87 | 2.20 | 1.27 | 0.78 | 0.61 | 1.05 | 1.29 | 0.86 | 0.58 | 12.66 |
| Departure from Normal | 0.27 | 0.36 | -0.07 | -0.38 | 1.87 | 0.39 | -0.11 | -0.40 | -1.00 | -0.19 | 0.02 | 0.00 | 0.76 |
| Percent of Normal | 166 | 162 | 94 | 80 | 185 | 131 | 86 | 34 | 5 | 76 | 173 | 100 | 106 |
|
Rank - Driest to Wettest |
96 | 95 | 67 | 49 | 103 | 86 | 70 | 33 | 10 | 65 | 85 | 71 | 69 |
| Greatest 24-HR Total | 0.54 | 0.29 | 0.67 | 1.15 | 1.49 | 1.21 | 0.39 | 0.08 | 0.02 | 0.44 | 0.29 | 0.45 | 1.49 |
| Dates of Occurrence | 20 | 19 | 26 | 30 | 11 | 17 | 11 | 20 | 7-8 | 13 | 17 | 31 | 5/11 |
| Number of Days with: | |||||||||||||
| Precipitation >= 0.01 | 4 | 7 | 4 | 9 | 13 | 7 | 7 | 6 | 3 | 7 | 6 | 3 | 76 |
| Precipitation >= 0.10 | 1 | 3 | 3 | 2 | 8 | 2 | 2 | 0 | 0 | 3 | 4 | 2 | 30 |
| Precipitation >= 1.00 | 0 | 0 | 0 | 1 | 1 | 1 | 0 | 0 | 0 | 0 | 0 | 0 | 3 |
| Days with Thunderstorms | 0 | 0 | 0 | 1 | 14 | 9 | 9 | 6 | 2 | 0 | 0 | 0 | 41 |
| Daily Precipitation Records Set or Tied | 0 | 0 | 1 | 0 | 0 | 0 | 0 | 0 | 0 | 0 | 0 | 1 | 2 |
One Day Precipitation Records (inches):
March: 0.67" on the 26th (tie).December: 0.45" on the 31st.
| Top Ten Driest Months of September on Record | |||||||
| Rank | Year | Precipitation (inches) | |||||
| 1 | 1932, 1914 | Trace | |||||
| 3 | 1992, 1979, 1969, 1952 | 0.01 | |||||
| 7 | 2010, 1928, 1922 | 0.02 | |||||
| 10 | 2018, 1917 | 0.05 | |||||
| Top Ten Driest Years on Record | |||||||
| Rank | Year | Precpitation (inches) | |||||
| 1 | 2001 | 5.30 | |||||
| 2 | 1954 | 5.37 | |||||
| 3 | 2012 | 6.60 | |||||
| 4 | 1902 | 7.25 | |||||
| 5 | 2006 | 7.42 | |||||
| 6 | 1988 | 7.63 | |||||
| 7 | 1939 | 7.95 | |||||
| 8 | 2002 | 8.09 | |||||
| 9 | 1914 | 8.32 | |||||
| 10 | 2000 | 8.61 | |||||
| 69 | 2018 | 13.42 | |||||
| Top Ten Wettest Years on Record | |||||||
| Rank | Year | Precipitation (inches) | |||||
| 1 | 1957 | 21.89 | |||||
| 2 | 1923 | 21.56 | |||||
| 3 | 2016 | 21.29 | |||||
| 4 | 1941 | 20.66 | |||||
| 5 | 1912 | 20.00 | |||||
| 6 | 1947 | 19.70 | |||||
| 7 | 1995 | 19.68 | |||||
| 8 | 1944 | 19.57 | |||||
| 9 | 1973 | 19.30 | |||||
| 10 | 1908 | 19.22 | |||||
| 59 | 2018 | 13.42 | |||||
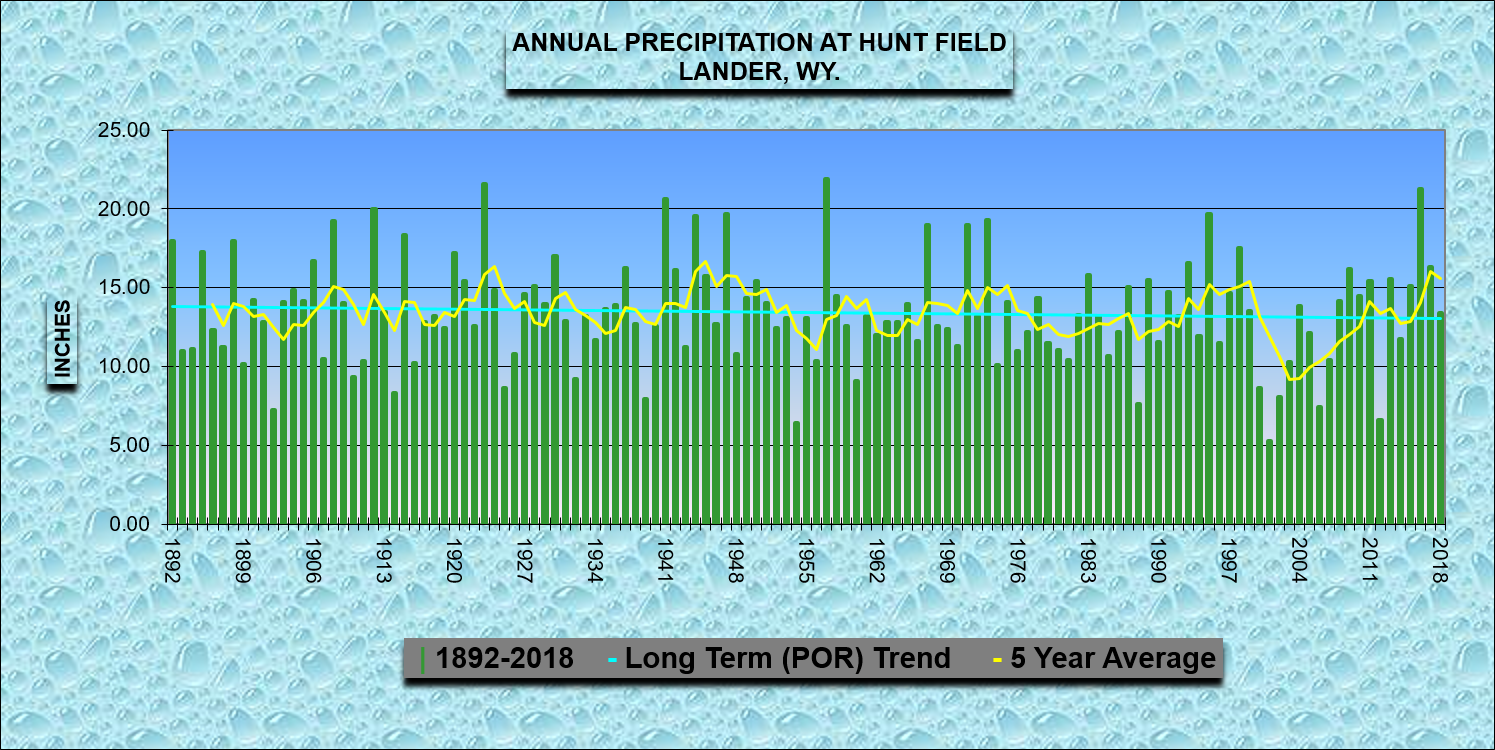 |
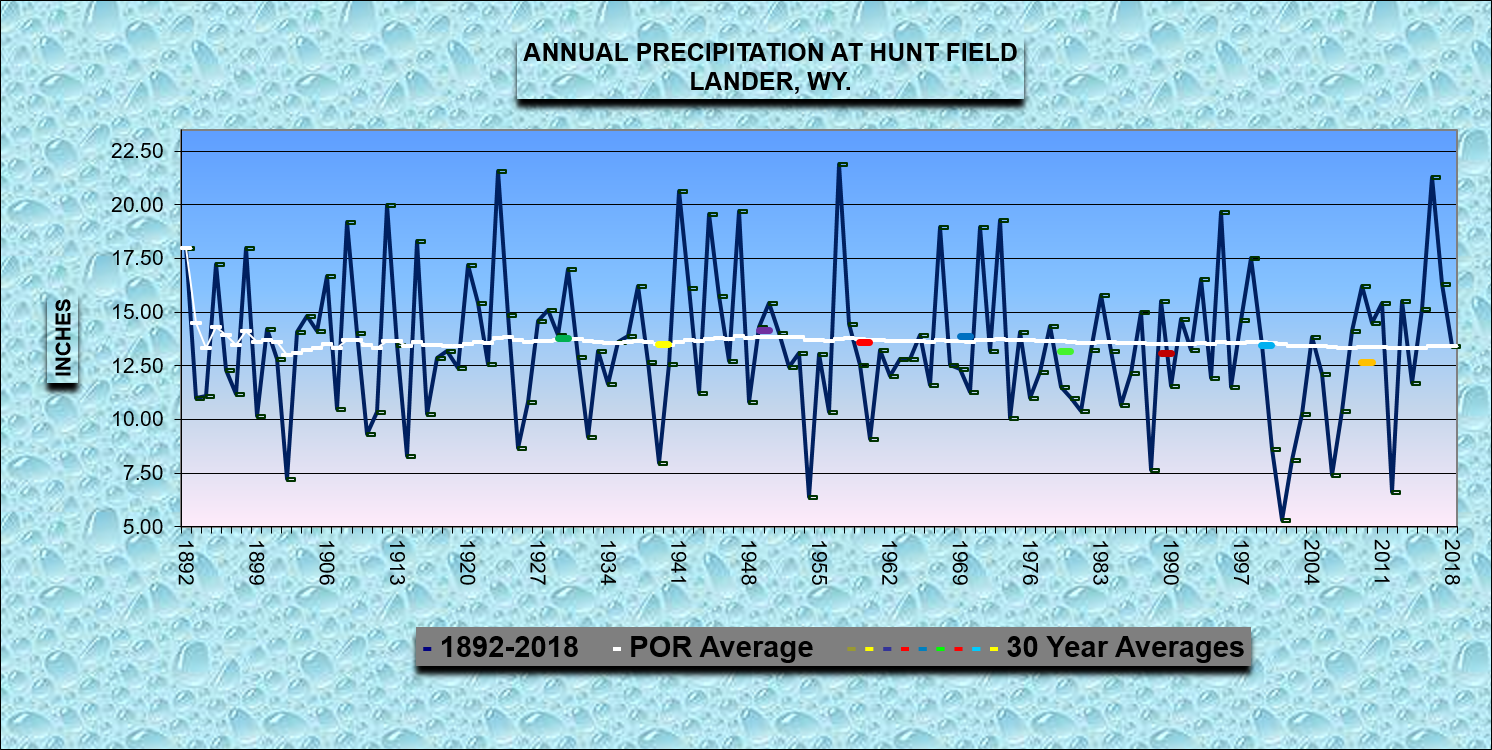 |
| Annual Precipitation for Period of Record - Click on Graph to Enlarge | |
 |
Learn more about the National Weather Service's efforts to build a Weather-Ready Nation! |

| Element | Jan | Feb | Mar | Apr | May | Jun | Jul | Aug | Sep | Oct | Nov | Dec | Year |
| Total (inches) | 11.5 | 9.3 | 8.1 | 3.1 | T | 0.0 | 0.0 | 0.0 | 0.0 | 6.8 | 11.7 | 6.8 | 57.3 |
| Average Snowfall | 7.6 | 10.3 | 16.1 | 16.8 | 4.8 | 0.1 | 0.0 | 0.0 | 2.7 | 9.8 | 13.1 | 10.1 | 91.4 |
| Departure from Normal | 3.9 | -1.0 | -8.0 | -13.7 | -4.8 | -0.1 | 0.0 | 0.0 | -2.7 | -3.0 | -1.4 | -3.3 | -34.1 |
| Percent of Normal | 151 | 90 | 50 | 18 | 0 | 0 | 0 | 0 | 0 | 69 | 89 | 67 | 63 |
| Rank - Least to Most 127 Years (P.O.R 1892-2018) |
104 | 75 | 37 | 19 | 20* | NA | NA | NA | 1* | 74 | 84 | 58 | 23 |
 |
|||||||||||||
| Greatest 24-HR Total | 8.1 | 2.8 | 6.5 | 2.0 | T | 0.0 | 0.0 | 0.0 | 0.0 | 5.1 | 3.8 | 4.2 | 8.1 |
| Dates of Occurrence | 20 | 9 | 26 | 17 | 12,27 | NA | NA | NA | NA | 13 | 17 | 31 | 1/20 |
| Number of Days with: | |||||||||||||
| Snowfall >= 1.0 inch | 3 | 5 | 2 | 1 | 0 | 0 | 0 | 0 | 0 | 1 | 5 | 2 | 19 |
| Daily Snowfall Records Set or Tied | 0 | 0 | 0 | 0 | 0 | 0 | 0 | 0 | 0 | 0 | 0 | 0 | 0 |
|
* 35 months of May with a trace or less of snowfall on record |
|||||||||||||
One Day Snowfall Records (inches):
None.
| Least Snowiest Springs (March, April, May) on Record |
|||||||
| Rank | Year | Snowfall (inches) | |||||
| 1 | 1925 | 3.6 | |||||
| 2 | 1919 | 5.9 | |||||
| 3 | 1911 | 6.4 | |||||
| 4 | 2018 | 11.2 | |||||
| 5 | 1976 | 11.3 | |||||
| 6 | 1939 | 11.4 | |||||
| 7 | 1962 | 11.5 | |||||
| 8 | 2012 | 12.2 | |||||
| 9 | 1914 | 14.1 | |||||
| Top Ten Snowiest Years on Record | |||||||
| Rank | Year | Snowfall (inches) | |||||
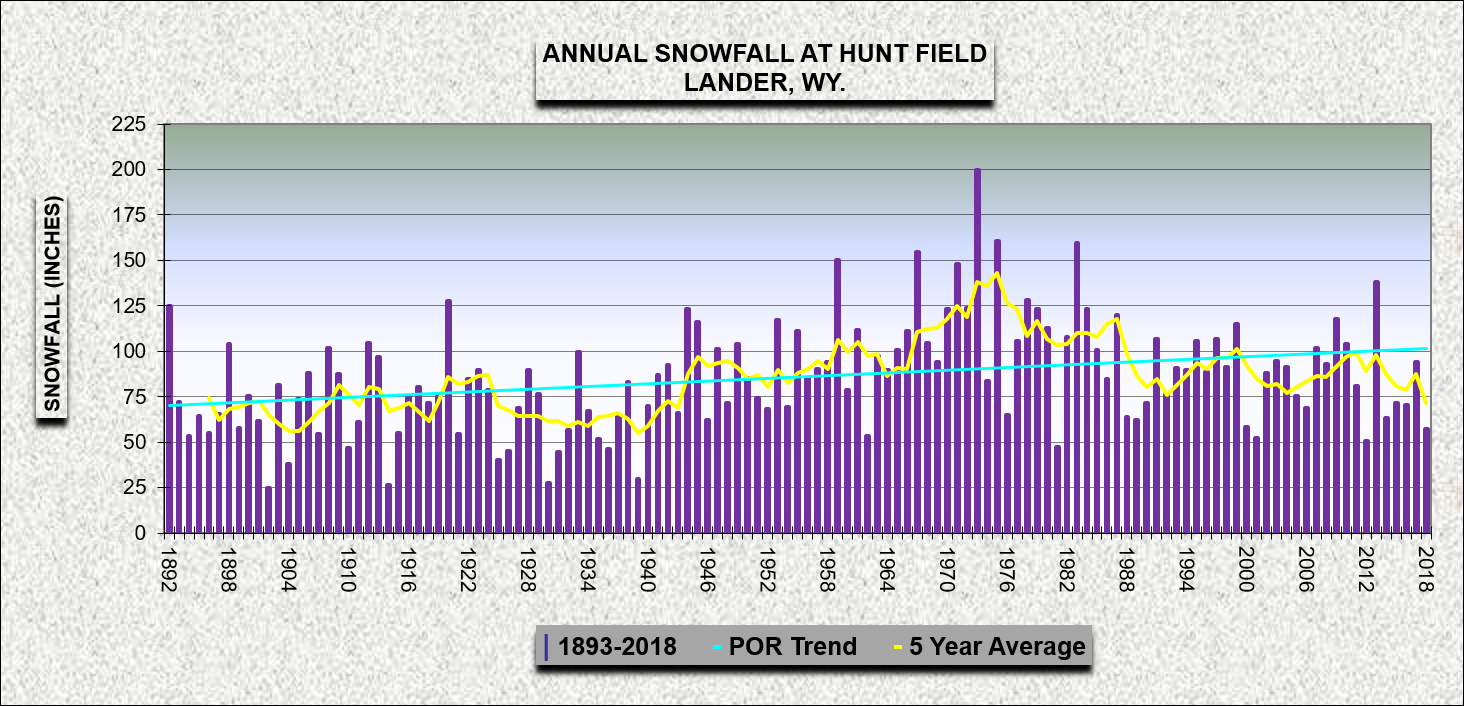
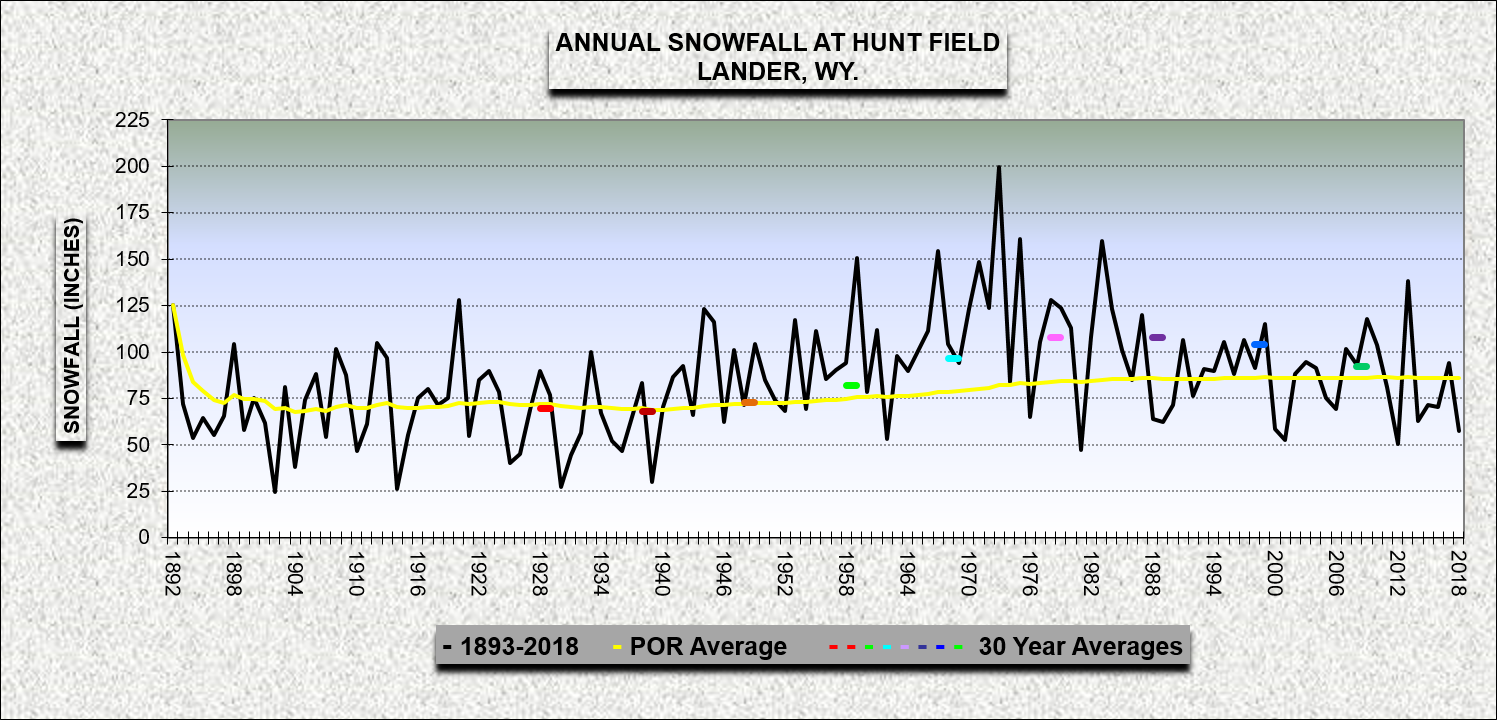
| 1 | 1973 | 199.9 | |||||
| 2 | 1975 | 160.7 | |||||
| 3 | 1983 | 159.6 | |||||
| 4 | 1967 | 154.6 | |||||
| 5 | 1959 | 150.4 | |||||
| 6 | 1971 | 148.3 | |||||
| 7 | 2013 | 138.0 | |||||
| 8 | 1978 | 128.1 | |||||
| 9 | 1920 | 127.9 | |||||
| 10 | 1892 | 125.1 | |||||
| 106 | 2018 |
57.3 |
|||||
 |
 |
 |
|
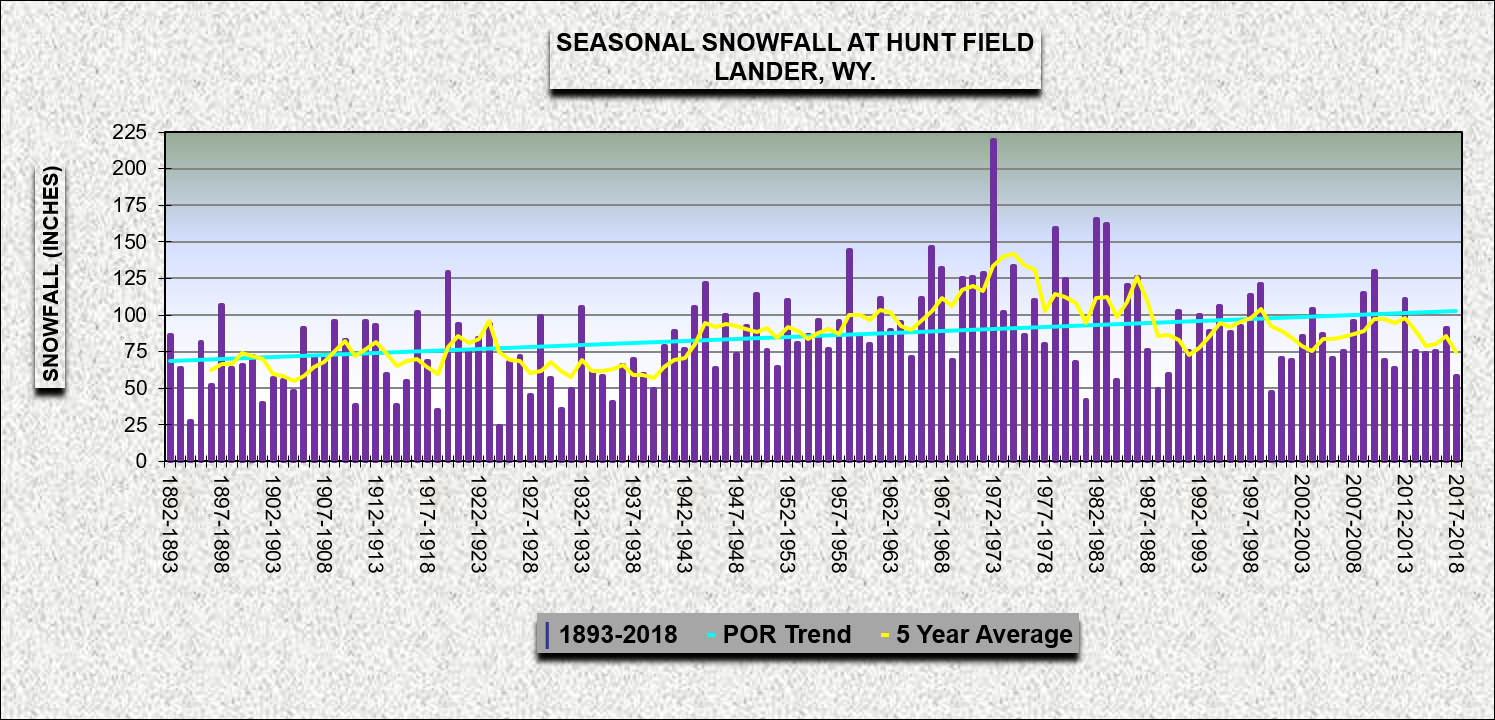
| Annual and Seasonal Snowfall for Period of Record - Click on Graph to Enlarge | |
 |
Learn more about the National Weather Service's efforts to build a Weather-Ready Nation! |