
Dangerous, record-breaking heat will intensify across most of the central and eastern U.S this week. Heat indices will likely exceed 100 degrees. Heat is likely to continue across the eastern U.S. through the Independence Day holiday weekend. Critical fire weather conditions will continue today and likely Tuesday across portions of the Four Corners and northern High Plains. Read More >

Forecast | River Stages | Forecast Graphics | Radar | SnoTel Data | Additional Information

Summary: Inclement and cooler temperatures are expected through early next week. Heavy rain is possible especially Sunday and Monday. Mudslides (from heavy rainfall) and lightning will be hazards over the next few days.
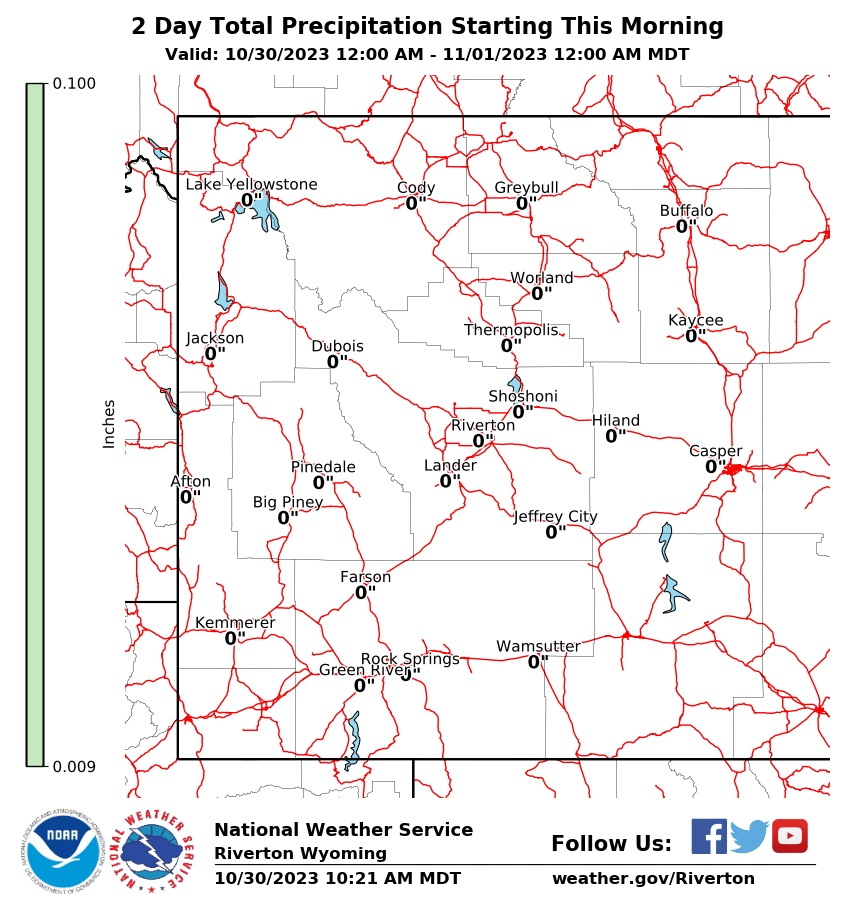
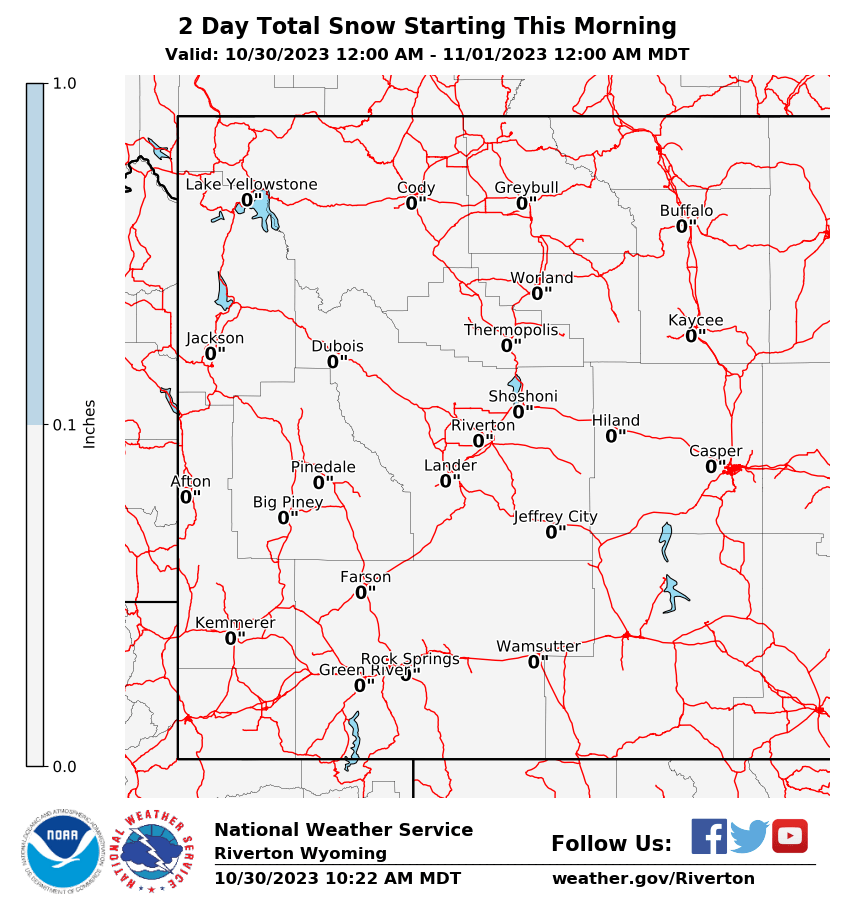
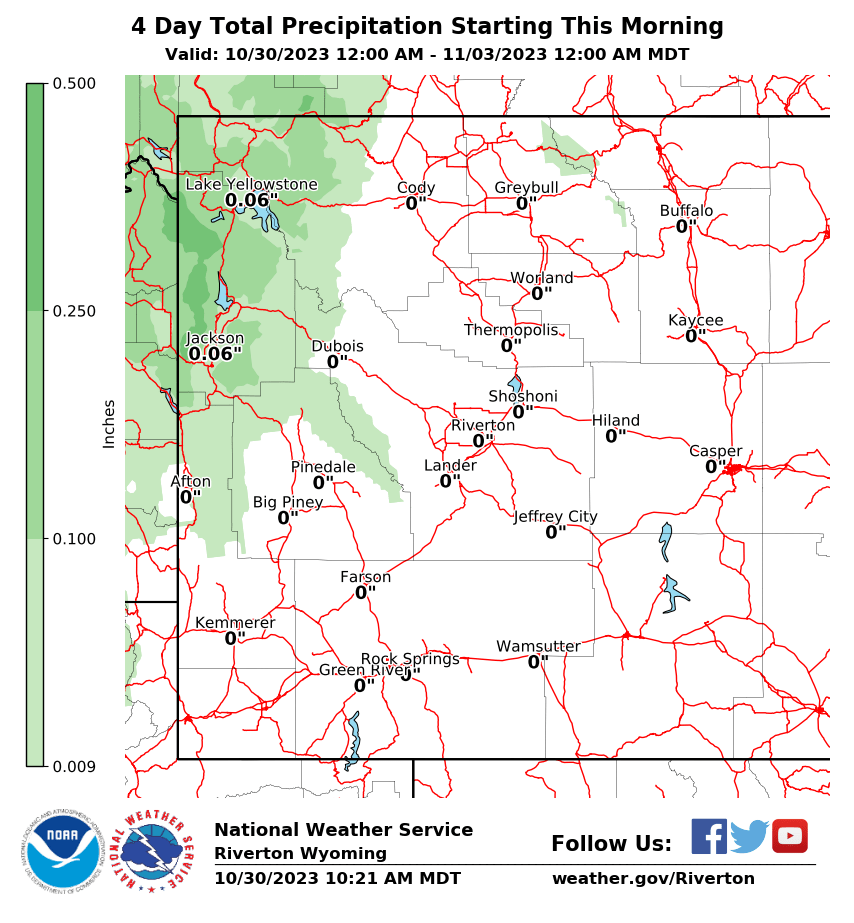
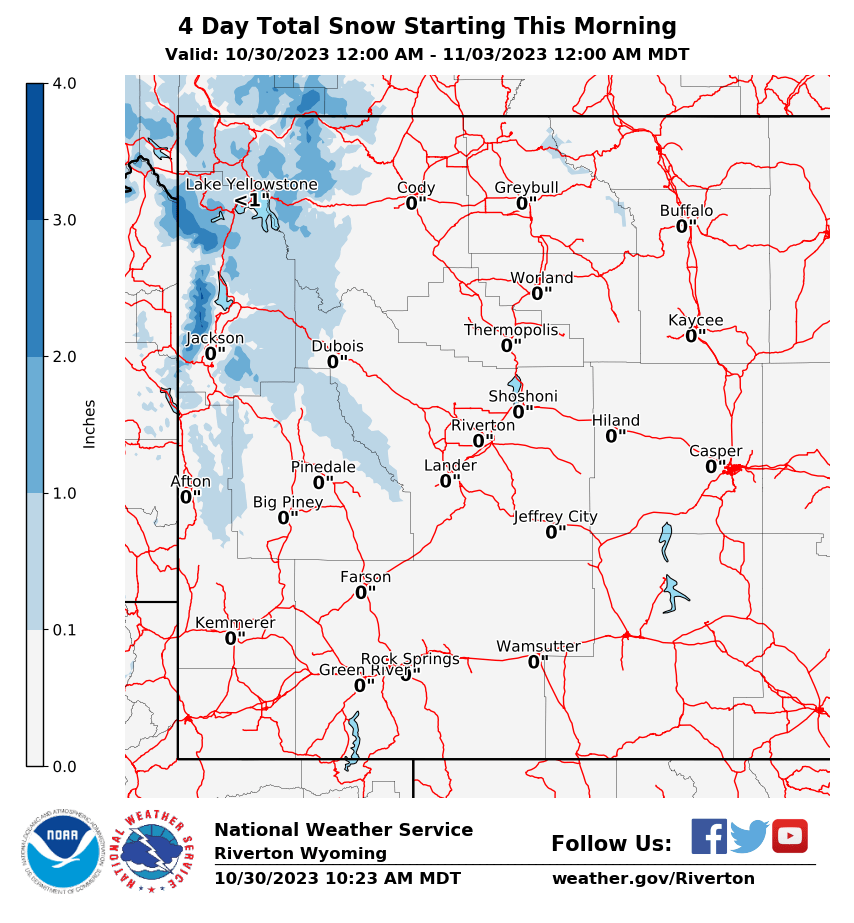
Precipitation Amounts:
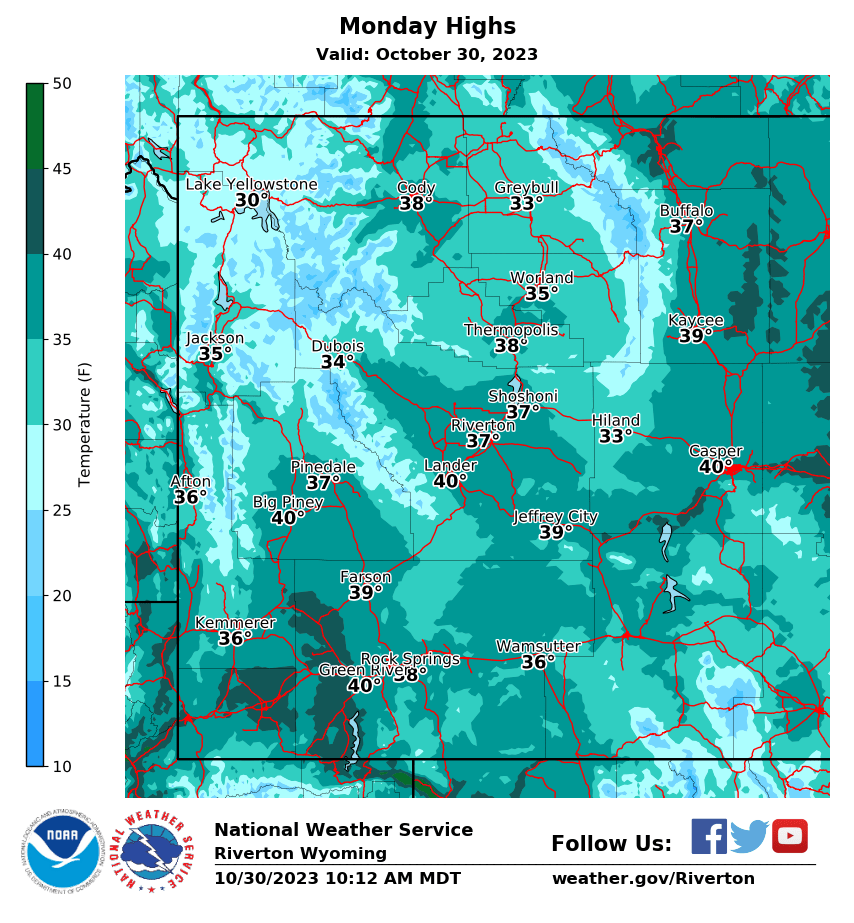
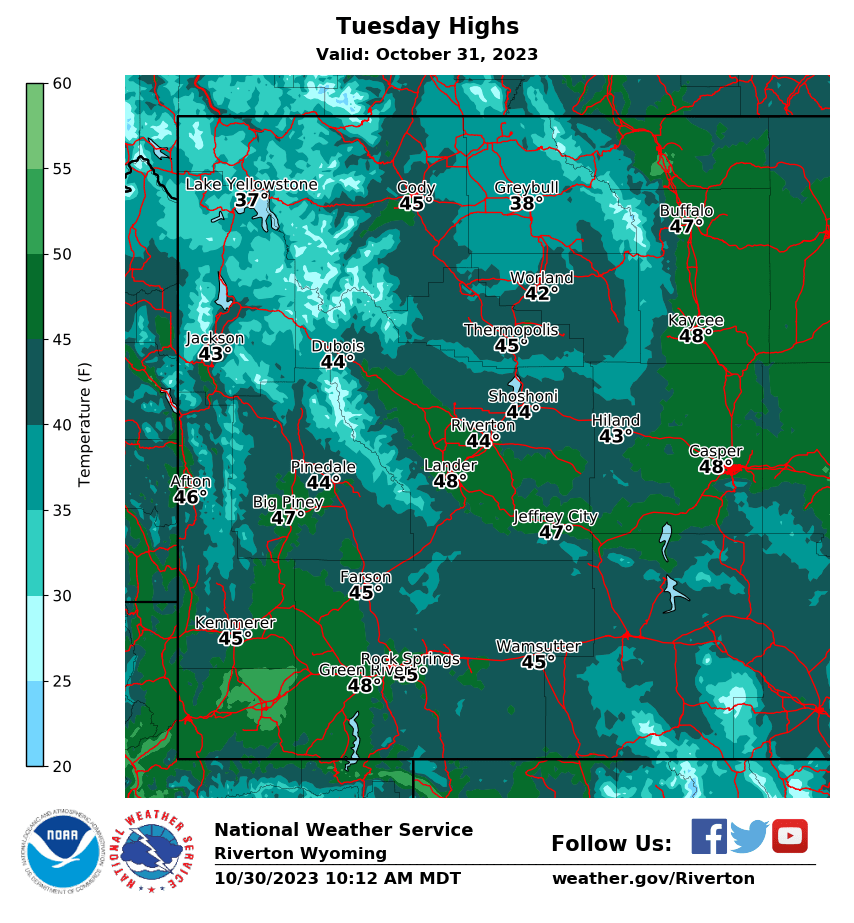
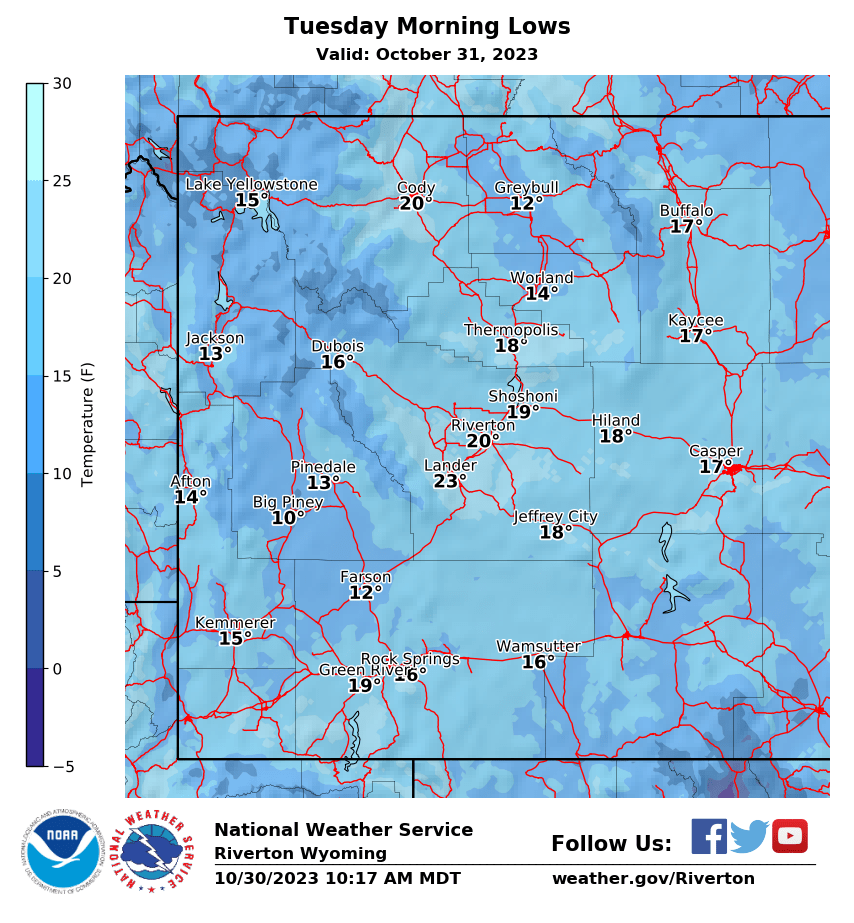
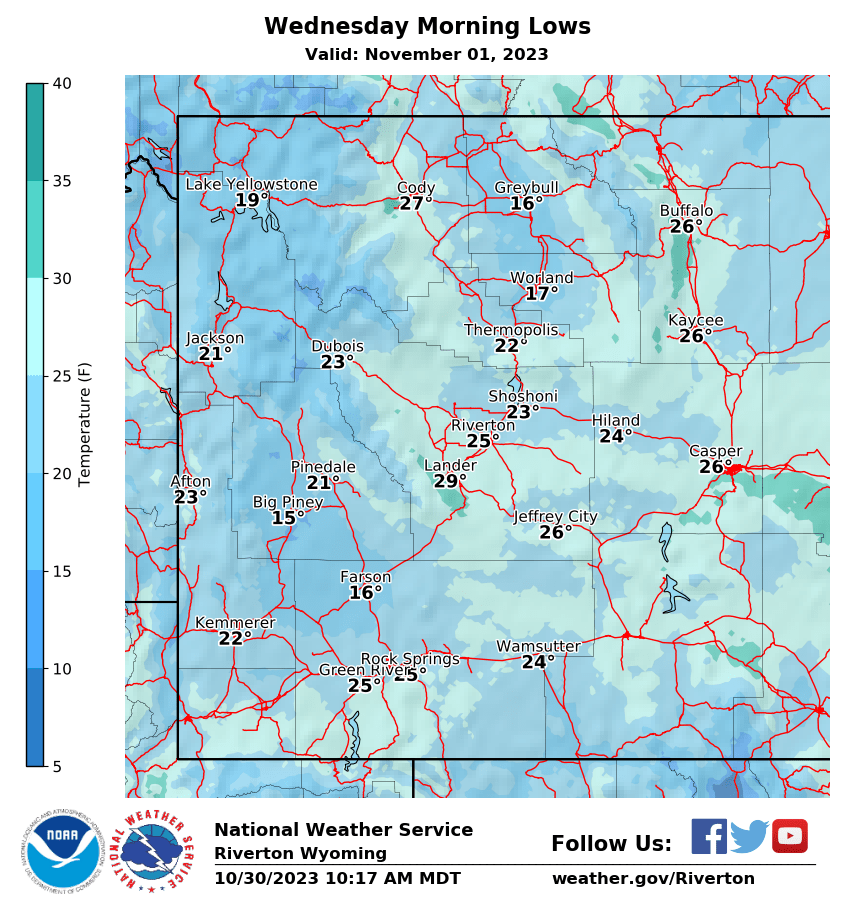
Temperatures:
For more in-depth forecast information at the slide location, click on this link: https://forecast.weather.gov/MapClick.php?marine=0&site=RIW&zmx=1&zmy=1&FcstType=text&lat=43.02738&lon=-110.80767&Submit=Submit#.WrF_Q5oh3AW

|
|
|||
|
Grey's River above the Porcupine Slide |
Grey's River below the Porcupine Slide |
||
|
|
|
||
|
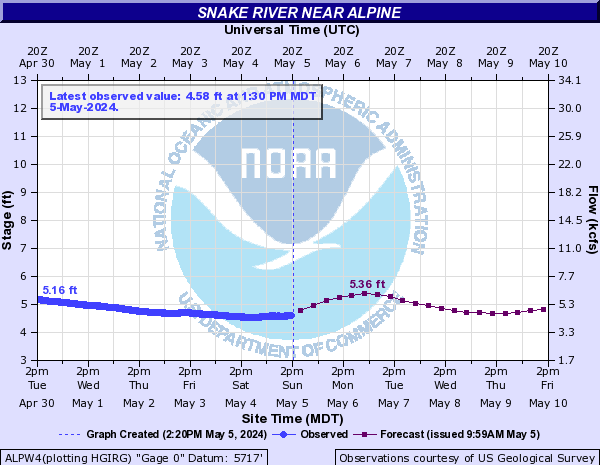
(Current Stage & Forecast) |
(Current Stage & Forecast) |
||
 |
 |
||

|
|
|
|
|
 |
 |
 |
 |
|
|
|
|
|
 |
 |
 |
 |
|
|
|
|
|
 |
 |
 |
 |

Want to track the storm? Here are the local and regional radar loops:
|
|

|
Graphs below show: â–º Current Snow Water Equivalent (SWE) and from 2017 |
|||
|
|
|||
 |
|||
|
|
|||
|
|
 |
||
 |
2018 Compared to Highest Years (as of 5/9/2018) |
||
|
|
|||
|
|
 |
||
|
2018 Compared to Highest Years (as of 5/9/2018) |
||
|
|
|||
|
|
 |
||
|
2018 Compared to Highest Years (as of 5/9/2018) |
||

Here are some additional links to help monitor the weather situation:


