
Heavy lake effect snow and gusty winds, including some local blizzard conditions, will continue into Thanksgiving Day across the Great Lakes then lingering through Friday night for Lakes Erie and Ontario. Confidence is increasing for another winter storm to develop over the northern and central Rockies Friday and track across the central Plains through the Midwest and Great Lakes this weekend. Read More >

...Highlights of 2023...

| Element | Jan | Feb | Mar | Apr | May | Jun | Jul | Aug | Sep | Oct | Nov | Dec | Year |
| Average High | 22.9 | 38.2 | 49.8 | 59.8 | 65.7 | 84.8 | 88.7 | 86.2 | 81.0 | 66.2 | 44.8 | 41.8 | 60.8 |
| Mean High (1991-2020 Normals) | 28.7 | 35.5 | 49.2 | 58 | 67.4 | 78.9 | 87.9 | 85.7 | 74.4 | 59.2 | 42.7 | 29.6 | 58.1 |
| Average Low | 0.7 | 15.6 | 24.8 | 32.8 | 38.0 | 51.4 | 53.7 | 53.0 | 44.9 | 35.1 | 19.3 | 5.7 | 31.3 |
| Mean Low (1991-2020 Normals) | 4.2 | 9.6 | 22.2 | 30.5 | 40.3 | 48.5 | 54.8 | 52.2 | 42.5 | 30.4 | 17.1 | 5.7 | 29.8 |
| Average Temperature | 11.8 | 26.9 | 37.3 | 46.3 | 51.9 | 68.1 | 71.2 | 69.6 | 63.0 | 50.6 | 32.0 | 28.4 | 46.4 |
| Mean Average Temperature (1991-2020 Normals) | 16.4 | 22.5 | 35.7 | 44.2 | 53.8 | 63.7 | 71.3 | 69 | 58.4 | 44.8 | 29.9 | 17.6 | 43.9 |
| Departure from Normal | -4.6 | 4.4 | 1.6 | 2.1 | -1.9 | 4.4 | -0.1 | 0.6 | 4.6 | 5.8 | 2.1 | 10.8 | 2.5 |
| Rank: Coldest to Warmest 106 years of record (P.O.R 12/1918-2024) |
30 | 78 | 85 | 77 | 28 | 95 | 62 | 75 | 102 | 102 | 76 | 100 | 96 |
| Highest Daily Maximum | 40 | 55 | 64 | 77 | 83 | 96 | 100 | 98 | 92 | 94 | 62 | 53 | 100 |
| Date of Occurrence | 30 | 26 | 19 | 15 | 29 | 24 | 12 | 4 | 3 | 5 | 12 | 23 | 7/12 |
| Lowest Daily Minimum | -30 | -12 | 13 | 22 | 25 | 38 | 44 | 41 | 35 | 18 | 7 | 7 | -30 |
| Date of Occurrence | 16 | 17 | 5 | 21 | 2 | 19 | 4 | 30 | 22 | 31 | 29 | 10,16 | 1/16 |
| Number of Days with: | |||||||||||||
| Maximum >= 90° | 0 | 0 | 0 | 0 | 0 | 9 | 15 | 11 | 4 | 0 | 0 | 0 | 39 |
| Maximum <= 32° | 23 | 7 | 0 | 0 | 0 | 0 | 0 | 0 | 0 | 0 | 1 | 1 | 32 |
| Minimum <= 32° | 31 | 29 | 31 | 15 | 7 | 0 | 0 | 0 | 0 | 13 | 30 | 31 | 187 |
| Minimum <= 0° | 8 | 2 | 0 | 0 | 0 | 0 | 0 | 0 | 0 | 0 | 0 | 0 | 10 |
| Record Highs Set or Tied | 0 | 0 | 0 | 0 | 0 | 0 | 0 | 0 | 2 | 0 | 0 | 0 | 2 |
| Record Lows Set or Tied | 1 | 0 | 0 | 0 | 1 | 0 | 0 | 0 | 0 | 0 | 0 | 0 | 2 |
| * Multiple day occurrence | |||||||||||||
Temperature Ranks and Records:
Daily Records:
Max:
September: 91 on the 29th and 91 on the 30th.
Min:
January: -35 on the 30th
May: 29 on the 24th (tie)
| Top Ten Warmest June's on Record | |||||||
| Rank | Year | Average Temperature °F | |||||
| 1 | 1988 | 72.2 | |||||
| 2 | 2021 | 70.2 | |||||
| 3 | 1977 | 69.3 | |||||
| 4 | 2016 | 68.9 | |||||
| 5 | 2006 | 68.8 | |||||
| 6 | 2012 | 68.5 | |||||
| 7 | 2015 | 68.4 | |||||
| 8 | 1933 | 68.2 | |||||
| 9 | 2024 | 68.1 | |||||
| 10 | 2013 | 67.6 | |||||
| Top Ten Warmest September's on Record | |||||||
| Rank | Year | Average Temperature °F | |||||
| 1 | 2015 | 63.6 | |||||
| 2 | 1998 | 63.5 | |||||
| 3 | 1990 | 63.4 | |||||
| 4 | 2024 | 63.0 | |||||
| 5 | 2022 | 62.9 | |||||
| 6 | 2009/2001 | 62.3 | |||||
| 8 | 1938 | 62.2 | |||||
| 9 | 1948 | 62.1 | |||||
| 10 | 1940 | 62.0 | |||||
| Top Ten Warmest October's on Record | |||||||
| Rank | Year | Average Temperature °F | |||||
| 1 | 1963 | 52.0 | |||||
| 2 | 2015 | 51.7 | |||||
| 3 | 2010 | 50.9 | |||||
| 4 | 2003 | 50.7 | |||||
| 5 | 2024 | 50.6 | |||||
| 6 | 2014 | 50.4 | |||||
| 7 | 1988 | 50.0 | |||||
| 8 | 1934 | 49.6 | |||||
| 9 | 1933 | 49.4 | |||||
| 10 | 2011 | 49.2 | |||||
| Top Ten Warmest December's on Record | |||||||
| Rank | Year | Average Temperature °F | |||||
| 1 | 1933 | 31.8 | |||||
| 2 | 2021 | 30.4 | |||||
| 3 | 1950 | 29.2 | |||||
| 4 | 1980 | 29.0 | |||||
| 5 | 2024 | 28.4 | |||||
| 6 | 1957/1946 | 27.7 | |||||
| 8 | 1999 | 27.3 | |||||
| 9 | 1939 | 27.2 | |||||
| 10 | 1929 | 26.5 | |||||
| Warmest Years on Record (100 Years) | |||||||
| Rank | Year | Average Temperature °F | |||||
| 1 | 2012 | 48.5 | |||||
| 2 | 2021 | 47.1 | |||||
| 3 | 2006, 1999 | 47.0 | |||||
| 5 | 1934 | 46.9 | |||||
| 6 | 2007 | 46.5 | |||||
| 7 | 2024 | 46.4 | |||||
| 7 | 2005, 1981 | 46.3 | |||||
| 9 | 1954 | 46.2 | |||||
| 10 | 2015 | 45.9 | |||||
| Top Ten Coldest Years on Record | |||||||
| Rank | Year | Average Temperature °F | |||||
| 1 | 1993 | 38.8 | |||||
| 2 | 1924 | 39.5 | |||||
| 3 | 1984, 1944 | 39.7 | |||||
| 5 | 1978 | 40.1 | |||||
| 6 | 1985 | 40.3 | |||||
| 7 | 1968, 1929 | 40.5 | |||||
| 9 | 1975 | 40.8 | |||||
| 10 | 1986, 1932 | 41.0 | |||||
| 96 | 2024 | 46.4 | |||||
 |
 |
| Average Annual Temperature for Period of Record - Click on Graph to Enlarge | |
 |
Learn more about the National Weather Service's efforts to build a Weather-Ready Nation! |

| Element | Jan | Feb | Mar | Apr | May | Jun | Jul | Aug | Sep | Oct | Nov | Dec | Year |
| Total (inches) | 0.35 | 1.07 | 0.36 | 0.73 | 1.68 | 0.96 | 0.14 | 0.40 | 0.08 | 0.60 | 0.24 | 0.05 | 6.66 |
| Mean Precipitation (1991-2020 Normals) |
0.35 | 0.43 | 0.71 | 1.31 | 1.98 | 1.09 | 0.70 | 0.45 | 0.80 | 0.93 | 0.44 | 0.31 | 9.5 |
| Departure from Normal | 0 | 0.64 | -0.35 | -0.58 | -0.30 | -0.13 | -0.56 | -0.05 | -0.72 | -0.33 | -0.20 | -0.26 | -2.84 |
| Percent of Normal | 100 | 249 | 51 | 56 | 85 | 88 | 20 | 89 | 10 | 65 | 55 | 16 | 70 |
|
Rank - Driest to Wettest |
81 | 102 | 52 | 37 | 56 | 54 | 21 | 58 | 14 | 52 | 41 | 23 | 19 |
 |
|||||||||||||
| Greatest 24-HR Total | 0.19 | 0.56 | 0.16 | 0.27 | 0.44 | 0.91 | 0.06 | 0.26 | 0.03 | 0.31 | 0.23 | 0.05 | 0.91 |
| Dates of Occurrence | 11 | 4 | 14 | 1 | 6 | 21 | 21 | 27 | 4 | 30 | 13 | 31 | 6/21 |
| Number of Days with: | |||||||||||||
| Precipitation >= 0.01 | 5 | 8 | 6 | 7 | 10 | 3 | 5 | 5 | 3 | 6 | 2 | 1 | 61 |
| Precipitation >= 0.10 | 2 | 3 | 2 | 2 | 5 | 1 | 0 | 1 | 0 | 2 | 1 | 0 | 19 |
| Precipitation >= 1.00 | 0 | 0 | 0 | 0 | 0 | 0 | 0 | 0 | 0 | 0 | 0 | 0 | 0 |
| Daily Precipitation Records Set or Tied | 1 | 0 | 0 | 0 | 0 | 0 | 0 | 0 | 0 | 0 | 0 | 0 | 1 |
One Day Precipitation Records:
January: 0.10." on the 13th.
| Top Ten Wettest Months of February on Record | |||||||
| Rank | Year | Precipitation (inches) | |||||
| 1 | 2004 | 1.33 | |||||
| 2 | 2015 | 1.28 | |||||
| 3 | 2003 | 1.15 | |||||
| 4 | 2024 | 1.07 | |||||
| 5 | 2020 | 0.98 | |||||
| 6 | 1986 | 0.97 | |||||
| 7 | 2017 | 0.96 | |||||
| 8 | 1955 | 0.90 | |||||
| 9 | 1935 | 0.86 | |||||
| 10 | 1920 | 0.80 | |||||
| Top Ten Driest Years on Record | |||||||
| Rank | Year | Precipitation (inches) | |||||
| 1 | 1988 | 3.75 | |||||
| 2 | 2012 | 3.98 | |||||
| 3 | 1974 | 4.12 | |||||
| 4 | 1954 | 4.85 | |||||
| 5 | 2001, 2006 | 5.07 | |||||
| 7 | 2020 | 5.62 | |||||
| 8 | 1966 | 5.66 | |||||
| 9 | 1990 | 5.71 | |||||
| 10 | 1922 | 5.91 | |||||
| 19 | 2 | 15.51 | |||||
| Top Ten Wettest Years on Record | |||||||
| Rank | Year | Precipitation (inches) | |||||
| 1 | 1923 | 18.43 | |||||
| 2 | 2017 | 15.86 | |||||
| 3 | 2023 | 15.51 | |||||
| 4 | 2016 | 15.24 | |||||
| 5 | 1941 | 14.74 | |||||
| 6 | 1912 | 14.73 | |||||
| 7 | 1993 | 13.49 | |||||
| 8 | 1998, 1995 | 13.41 | |||||
| 10 | 1971 | 13.11 | |||||
| 89 | 2024 | 6.66 | |||||
 |
 |
| Annual Precipitation for Period of Record - Click on Graph to Enlarge | |
 |
|
| Click on Graph to Enlarge | |
|
Learn more about the National Weather Service's efforts to build a Weather-Ready Nation! |

| Element | Jan | Feb | Mar | Apr | May | Jun | Jul | Aug | Sep | Oct | Nov | Dec | Year |
| Total (inches) | 5 | 10 | 4.9 | 4.2 | 1.7 | 0 | 0 | 0 | 0 | 3.1 | 0.5 | 1 | 30.4 |
| Mean Snowfall (1991-2020 Normals) | 5.5 | 7.4 | 6.5 | 7.2 | 2.1 | 0.0 | 0.0 | 0.0 | 0.6 | 4.4 | 5.3 | 5.3 | 44.3 |
| Departure from Normal | -0.5 | 2.6 | -1.6 | -3.0 | -0.4 | 0.0 | 0.0 | 0.0 | -0.6 | -1.3 | -4.8 | -4.3 | -13.9 |
| Percent of Normal | 91 | 135 | 75 | 58 | 81 | 0 | 0 | 0 | 0 | 7 | 9 | 19 | 69 |
| Rank - Least to Most 106 years (P.O.R 1918-2024) |
71 | 87 | 52 | 59 | 82 | NA | NA | NA | NA | 66 | 27 | 25 | 46 |
|
|||||||||||||
| Greatest 24-HR Total | 2.3 | 3.2 | 2.3 | 2.8 | 0.9 | 0 | 0 | 0 | 0 | 3.1 | 0.4 | 1.0 | 3.2 |
| Dates of Occurrence | 11 | 10 | 14 | 1 | 3 | 0 | 0 | 0 | 0 | 30 | 13 | 31 | 2/10 |
| Number of Days with: | |||||||||||||
| Snowfall >= 1.0 inch | 2 | 4 | 2 | 1 | 0 | 0 | 0 | 0 | 0 | 1 | 0 | 1 | 11 |
| Daily Snowfall Records Set or Tied | 0 | 0 | 0 | 0 | 0 | 0 | 0 | 0 | 0 | 0 | 0 | 0 | 0 |
|
* 69 months of May on record a trace or 0.0" of snowfall. |
|||||||||||||
One Day Snowfall Records (inches):
There were no daily records in 2024
There were no significant snowy months in 2024.
| Top Ten Snowiest Years on Record | |||||||
| Rank | Year | Snowfall (inches) | |||||
| 1 | 2023 | 92.0 | |||||
| 2 | 1920 | 77.0 | |||||
| 3 | 2017 | 71.1 | |||||
| 4 | 2013 | 70.6 | |||||
| 5 | 2009 | 62.5 | |||||
| 6 | 2022 | 61.7 | |||||
| 7 | 2020 | 61.7 | |||||
| 8 | 2016 | 61.7 | |||||
| 9 | 2010 | 60.1 | |||||
| 10 | 1919 | 58.0 | |||||
| 46 | 2024 | 30.4 | |||||
 |
 |
 |
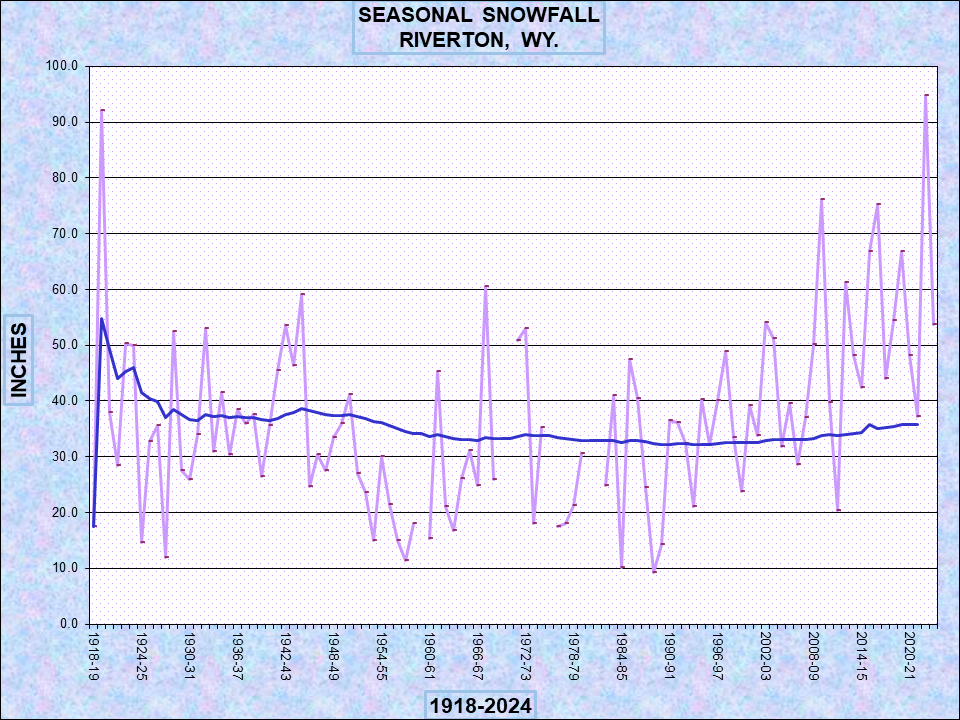 |
| Annual and Seasonal Snowfall for Period of Record - Click on Graph to Enlarge | |
|
Learn more about the National Weather Service's efforts to build a Weather-Ready Nation! |
|
Learn more about the National Weather Service's efforts to build a Weather-Ready Nation! |

