
Extreme heat will continue in the interior Northwest into midweek before finally waning. Hot temperatures, dry, gusty winds, and isolated dry thunderstorms will bring critical fire weather. Heavy rain and thunderstorms are expected across portions of the Great Basin, Rockies, and central/southern Plains. An atmospheric river will bring heavy rain and strong winds to southwest Alaska. Read More >
...Highlights of 2014...
| Element | Jan | Feb | Mar | Apr | May | Jun | Jul | Aug | Sep | Oct | Nov | Dec | Year |
| Average High | 36.4 | 32.3 | 48.9 | 57.8 | 67.7 | 76.8 | 88.8 | 81.6 | 75.8 | 65.6 | 42.4 | 33.8 | 59.0 |
| Mean High (1981-2010 Normals) | 33.1 | 36.5 | 47.4 | 56.4 | 66.5 | 77.5 | 86.8 | 85.0 | 72.8 | 58.5 | 42.8 | 31.8 | 58.0 |
| Average Low | 13.0 | 10.0 | 22.8 | 30.3 | 41.5 | 45.3 | 56.2 | 53.1 | 46.1 | 36.3 | 16.6 | 12.5 | 32.0 |
| Mean Low (1981-2010 Normals) | 10.2 | 13.9 | 23.6 | 31.3 | 40.1 | 48.4 | 55.6 | 54.3 | 44.4 | 32.7 | 19.7 | 9.6 | 32.1 |
| Average Temperature | 24.7 | 21.1 | 35.9 | 44.1 | 54.6 | 61.1 | 72.5 | 67.3 | 61.0 | 51.0 | 29.4 | 23.2 | 45.5 |
| Mean Temp (1981-2010 Normals) | 21.7 | 25.2 | 35.5 | 43.9 | 53.3 | 63.0 | 71.2 | 69.6 | 58.6 | 45.6 | 31.2 | 20.7 | 45.1 |
| Departure from Normal | 3.0 | -4.1 | 0.4 | 0.2 | 1.3 | -1.9 | 1.3 | -2.3 | 2.4 | 5.4 | -1.8 | 2.5 | 0.4 |
| Rank - Coldest to Warmest 123 years of record (P.O.R 1892-2014) |
98 | 36 | 80 | 78 | 92 | 56 | 99 | 60 | 102 | 116 | 39 | 74 | 95 |
| Highest Daily Maximum | 52 | 53 | 64 | 71 | 87 | 87 | 99 | 94 | 89 | 76 | 71 | 56 | 99 |
| Date of Occurrence | 11 | 13 | 10 | 18 | 28 | 10 | 23 | 12 | 18 | 7,25 | 1 | 9 | 7/23 |
| Lowest Daily Minimum | -17 | -17 | -6 | 11 | 29 | 32 | 47 | 43 | 31 | 27 | -18* | -27 | -27 |
| Date of Occurrence | 6 | 6 | 2 | 14 | 13 | 19 | 1 | 24 | 12 | 27,28 | 13 | 31 | 12/31 |
| Number of Days with: | |||||||||||||
| Maximum >= 90° | 0 | 0 | 0 | 0 | 0 | 0 | 16 | 5 | 0 | 0 | 0 | 0 | 21 |
| Maximum <= 32° | 9 | 13 | 2 | 1 | 0 | 0 | 0 | 0 | 0 | 0 | 9 | 14 | 34 |
| Minimum <= 32° | 31 | 27 | 30 | 18 | 8 | 1 | 0 | 0 | 1 | 9 | 23 | 30 | 178 |
| Minimum <= 0° | 3 | 7 | 2 | 0 | 0 | 0 | 0 | 0 | 0 | 0 | 6 | 7 | 25 |
| Record Highs Set or Tied | 0 | 0 | 0 | 0 | 0 | 0 | 1 | 0 | 4 | 2 | 2 | 0 | 9 |
| Record Lows Set or Tied | 0 | 0 | 0 | 0 | 0 | 1 | 0 | 0 | 0 | 0 | 0 | 0 | 1 |
| * Lander only reached -18F or colder earlier than November 13th in the years 1916 (-25F) and 1919 (-22F). | |||||||||||||
Temperature Ranks and Records:
Daily Records:
Max:
July: 98 on the 9th.
September: 87 on the 17th (tie), 89 on the 18th, 87 on the 24th, 88 on the 25th.
October: 75 on the 24th, 76 on the 25th.
November: 71 on the 1st (tie), 67 on the 9th.
Min:
June: 32 on the 19th.
| Warmest Months of October on Record | ||||
| Rank | Year | Average Temperature °F | ||
| 1 | 1988, 1963 | 53.6 | ||
| 3 | 1965 | 51.9 | ||
| 4 | 2010 | 51.8 | ||
| 5 | 1962 | 51.6 | ||
| 6 | 1934 | 51.4 | ||
| 7 | 1950 | 51.3 | ||
| 8 | 2014 | 51.0 | ||
| Top Ten Warmest Years on Record | |||||||
| Rank | Year | Average Temperature °F | |||||
| 1 | 2012 | 49.0 | |||||
| 2 | 1988, 1981 | 47.7 | |||||
| 4 | 1934 | 47.6 | |||||
| 5 | 1994 | 47.5 | |||||
| 6 | 2006 | 47.4 | |||||
| 7 | 1954 | 47.2 | |||||
| 8 | 1999 | 47.0 | |||||
| 9 | 2007, 1990 | 46.6 | |||||
| 28 | 2014 | 45.5 | |||||
| Top Ten Coldest Years on Record | |||||||
| Rank | Year | Average Temperature °F | |||||
| 1 | 1912 | 39.9 | |||||
| 2 | 1944 | 40.1 | |||||
| 3 | 1920 | 40.2 | |||||
| 4 | 1916, 1898 | 40.9 | |||||
| 6 | 1895 | 41.0 | |||||
| 7 | 1924 | 41.1 | |||||
| 8 | 1913, 1899, 1923 | 41.2 | |||||
| 92 | 2014 | 45.5 | |||||
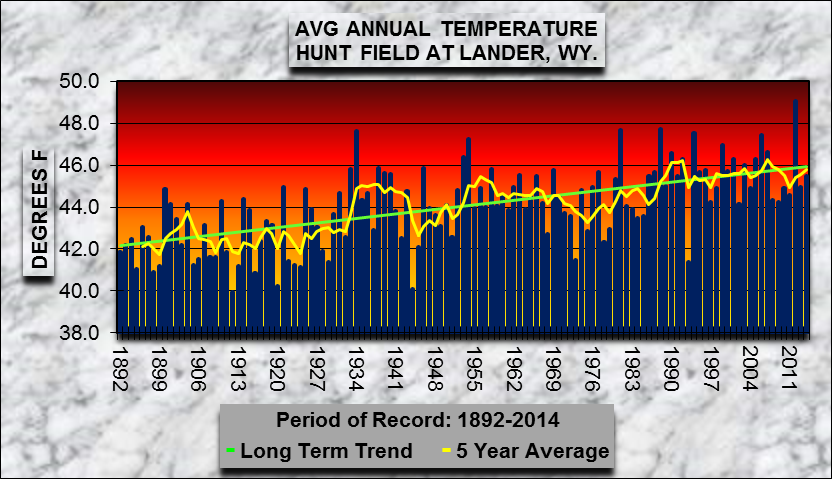 |
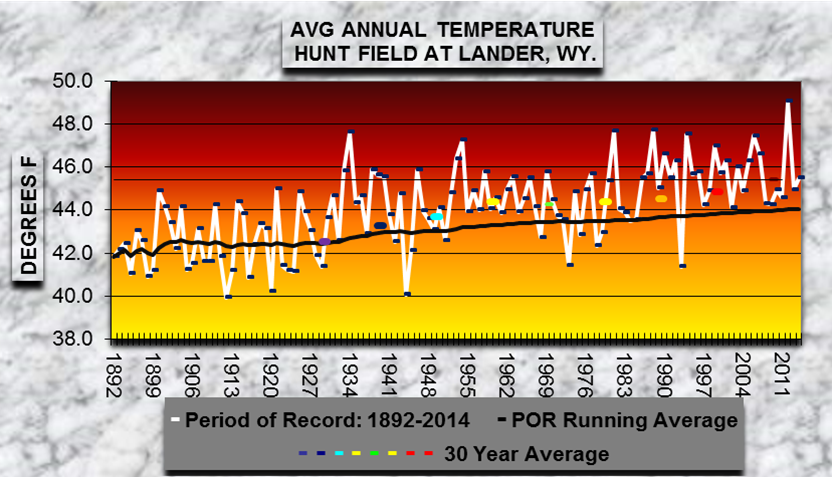 |
| Average Annual Temperature for Period of Record - Click on Graph to Enlarge | |

| Element | Jan | Feb | Mar | Apr | May | Jun | Jul | Aug | Sep | Oct | Nov | Dec | Year |
| Average Speed (MPH) | 5.4 | 6.6 | 7.5 | 8.0 | 8.0 | 7.9 | 7.2 | 6.4 | 6.0 | 5.4 | 6.4 | 6.6 | 6.6 |
| Maximum 3-sec Gust | 66 | 60 | 58 | 61 | 67 | 63 | 56 | 51 | 47 | 49 | 68 | 45 | 68 |
| Direction (tens of degrees) | 24 | 26 | 25 | 23 | 26 | 25 | 28 | 20 | 31 | 25 | 19 | 29 | 19 |
| Date of Occurrence | 11 | 16 | 20 | 18 | 4 | 4 | 25 | 30 | 9 | 26 | 11 | 2 | 11/1 |

| Element | Jan | Feb | Mar | Apr | May | Jun | Jul | Aug | Sep | Oct | Nov | Dec | Year |
| Total (inches) | 0.61 | 0.19 | 1.18 | 0.70 | 1.51 | 0.60 | 0.62 | 1.61 | 1.79 | 0.50 | 0.59 | 1.82 | 11.72 |
| Mean Precip (1981-2010 Normals) | 0.41 | 0.58 | 1.16 | 1.87 | 2.20 | 1.27 | 0.78 | 0.61 | 1.05 | 1.29 | 0.86 | 0.58 | 12.66 |
| Departure from Normal | 0.20 | -0.39 | 0.02 | -1.17 | -0.69 | -0.67 | -0.16 | 1.00 | 0.74 | -0.79 | -0.27 | 1.24 | -0.94 |
| Percent of Normal | 149 | 33 | 102 | 37 | 69 | 47 | 79 | 264 | 170 | 39 | 69 | 314 | 93 |
|
Rank - Driest to Wettest |
83 | 20 | 73 | 9 | 41 | 47 | 65 | 117 | 105 | 30 | 60 | 120 | 39 |
| Greatest 24-HR Total | 0.46 | 0.08 | 0.36 | 0.57 | 0.66 | 0.19 | 0.34 | 0.44 | 1.57 | 0.30 | 0.34 | 0.75 | 1.57 |
| Dates of Occurrence | 3-4 | 22 | 30 | 12-13 | 6-7 | 26-27 | 29-30 | 4-5 | 27-28 | 12 | 10-11 | 14-15 | 9/27-28 |
| Number of Days with: | |||||||||||||
| Precipitation >= 0.01 | 5 | 5 | 9 | 5 | 10 | 10 | 6 | 13 | 7 | 4 | 6 | 6 | 86 |
| Precipitation >= 0.10 | 3 | 0 | 4 | 1 | 4 | 2 | 2 | 7 | 3 | 2 | 2 | 3 | 33 |
| Precipitation >= 1.00 | 0 | 0 | 0 | 0 | 0 | 0 | 0 | 0 | 1 | 0 | 0 | 0 | 1 |
| Days with Thunderstorms | 0 | 0 | 0 | 0 | 3 | 5 | 0 | 0 | 0 | 0 | 0 | 0 | 8 |
| Daily Precipitaton Records Set or Tied | 0 | 0 | 0 | 0 | 0 | 0 | 0 | 1 | 1 | 0 | 0 | 2 | 4 |
Precipitation Ranks and Records:
One Day Precipitation Records:
August: 0.43 on the 4th.
September: 1.37 on the 28th.
December: 0.74 on the 14th, 0.62 on the 25th.
| Wettest Months of August on Record | ||||
| Rank | Year | Precipitation (inches) | ||
| 1 | 1930 | 4.35 | ||
| 2 | 2004 | 2.35 | ||
| 3 | 1979 | 2.30 | ||
| 4 | 1941 | 1.99 | ||
| 5 | 1966 | 1.77 | ||
| 6 | 1933 | 1.67 | ||
| 7 | 2014 | 1.61 | ||
| 8 | 1908 | 1.52 | ||
| 9 | 1987 | 1.50 | ||
| Wettest Months of December on Record | ||||
| Rank | Year | Precipitation (inches) | ||
| 1 | 1909 | 2.06 | ||
| 2 | 1997 | 2.02 | ||
| 3 | 1901 | 1.87 | ||
| 4 | 2014 | 1.82 | ||
| 5 | 2007 | 1.77 | ||
| 6 | 1921 | 1.67 | ||
| 7 | 1985 | 1.62 | ||
| 8 | 1892 | 1.60 | ||
| Top Ten Driest Years on Record | |||||||
| Rank | Year | Precpitation (inches) | |||||
| 1 | 2001 | 5.30 | |||||
| 2 | 1954 | 5.37 | |||||
| 3 | 2012 | 6.60 | |||||
| 4 | 1902 | 7.25 | |||||
| 5 | 2006 | 7.42 | |||||
| 6 | 1988 | 7.63 | |||||
| 7 | 1939 | 7.95 | |||||
| 8 | 2002 | 8.09 | |||||
| 9 | 1914 | 8.32 | |||||
| 10 | 2000 | 8.61 | |||||
| 39 | 2014 | 11.72 | |||||
| Top Ten Wettest Years on Record | |||||||
| Rank | Year | Precipitation (inches) | |||||
| 1 | 1957 | 21.89 | |||||
| 2 | 1923 | 21.52 | |||||
| 3 | 1941 | 20.66 | |||||
| 4 | 1912 | 20.00 | |||||
| 5 | 1947 | 19.70 | |||||
| 6 | 1995 | 19.68 | |||||
| 7 | 1944 | 19.57 | |||||
| 8 | 1973 | 19.30 | |||||
| 9 | 1908 | 19.22 | |||||
| 10 | 1971 | 18.99 | |||||
| 85 | 2014 | 11.72 | |||||
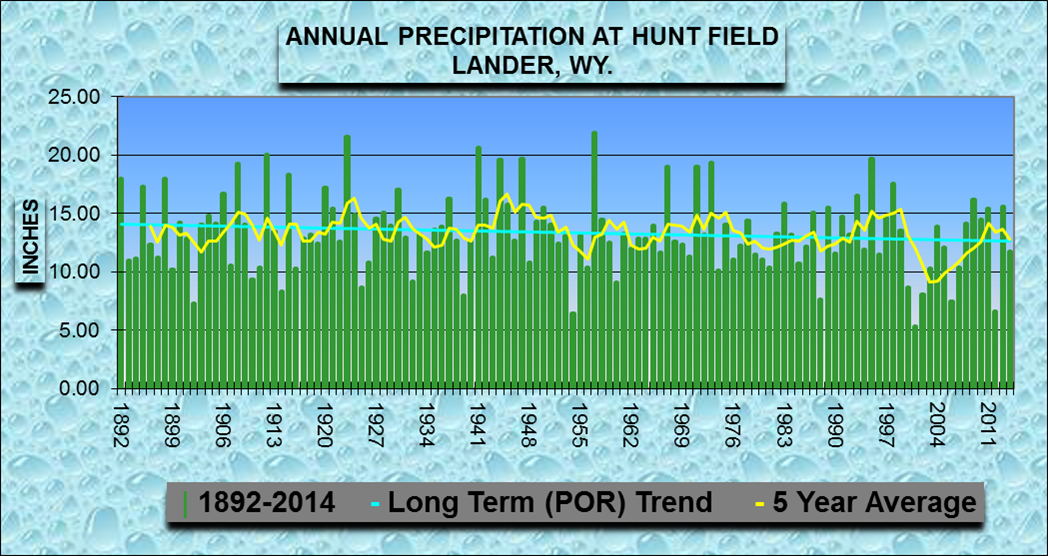 |
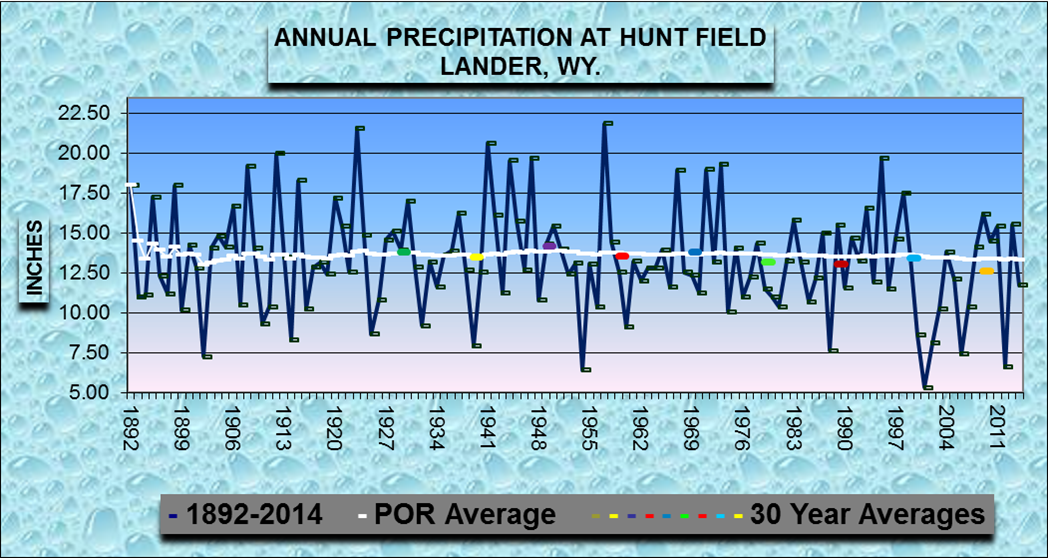 |
| Annual Precipitation for Period of Record - Click on Graph to Enlarge | |

| Element | Jan | Feb | Mar | Apr | May | Jun | Jul | Aug | Sep | Oct | Nov | Dec | Year |
| Total (inches) | 8.9 | 3.8 | 13.9 | 4.3 | 2.2 | 0.0 | 0.0 | 0.0 | T | T | 8.9 | 21.1 | 63.1 |
| Average Snowfall | 7.6 | 10.3 | 16.1 | 16.8 | 4.8 | 0.1 | 0.0 | 0.0 | 2.7 | 9.8 | 13.1 | 10.1 | 91.4 |
| Departure from Normal | 1.3 | -6.5 | -2.2 | -12.5 | -2.6 | -0.1 | 0.0 | 0.0 | -2.7 | -9.8 | -4.2 | 11.0 | -28.3 |
| Percent of Normal | 117 | 37 | 86 | 26 | 46 | 0 | 0 | 0 | 0 | 0 | 68 | 209 | 69 |
| Rank - Least Snowiest to Snowiest 123 Years (P.O.R 1892-2014) |
87 | 31 | 67 | 24 | 61 | NA | NA | NA | 61* | 15^ | 68 | 117 | 28 |
| Greatest 24-HR Total | 5.3 | 1.3 | 3.9 | 4.3 | 1.2 | 0.0 | 0.0 | 0.0 | T | T | 6.1 | 9.6 | 9.6 |
| Dates of Occurrence | 4 | 22 | 11 | 13 | 11 | NA | NA | NA | 11 | 3 | 11 | 25 | 12/25 |
| Number of Days with: | |||||||||||||
| Snowfall >= 1.0 inch | 3 | 2 | 4 | 1 | 1 | 0 | 0 | 0 | 0 | 0 | 2 | 4 | 17 |
| Daily Snowfall Records Set or Tied | 0 | 0 | 0 | 0 | 0 | 0 | 0 | 0 | 0 | 0 | 0 | 1 | 1 |
|
* 21 years on record with a trace (T) of snowfall in September. |
|||||||||||||
Snowfall Ranks and Records:
One Day Snowfall Records:
December: 9.6 on the 25th.
| Snowiest Months of December on Record | |||||||
| Rank | Year | Snowfall (inches) | |||||
| 1 | 2007 | 34.6 | |||||
| 2 | 1997 | 31.6 | |||||
| 3 | 1985 | 28.0 | |||||
| 4 | 1972 | 27.2 | |||||
| 5 | 1967 | 26.3 | |||||
| 6 | 1978 | 25.4 | |||||
| 7 | 1982 | 22.6 | |||||
| 8 | 2014 | 21.1 | |||||
| 9 | 1909 | 20.6 | |||||
| 10 | 1979 | 20.4 | |||||
| Top Ten Snowiest Years on Record | |||||||
| Rank | Year | Snowfall (inches) | |||||
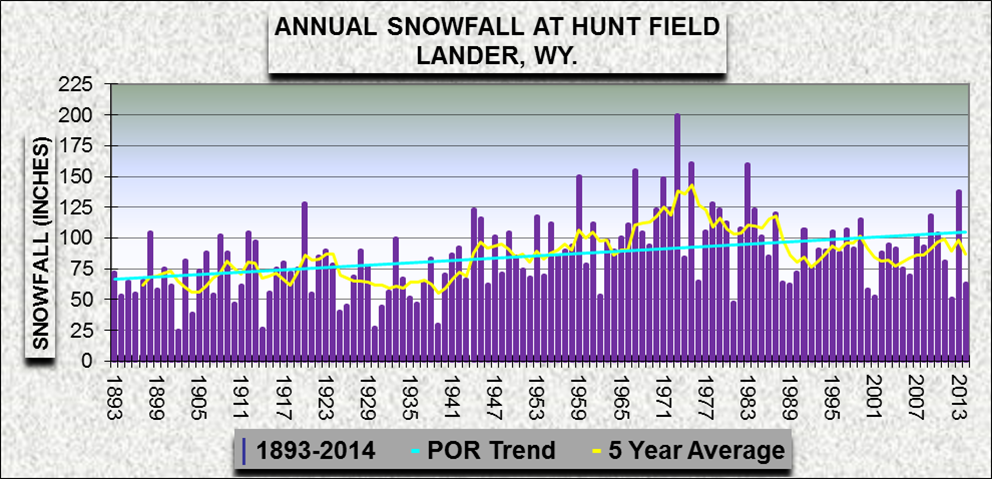
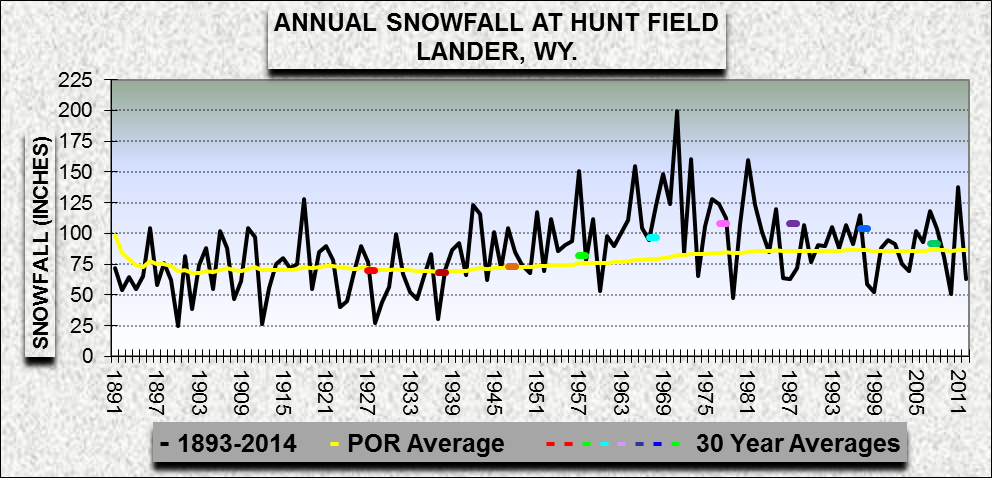
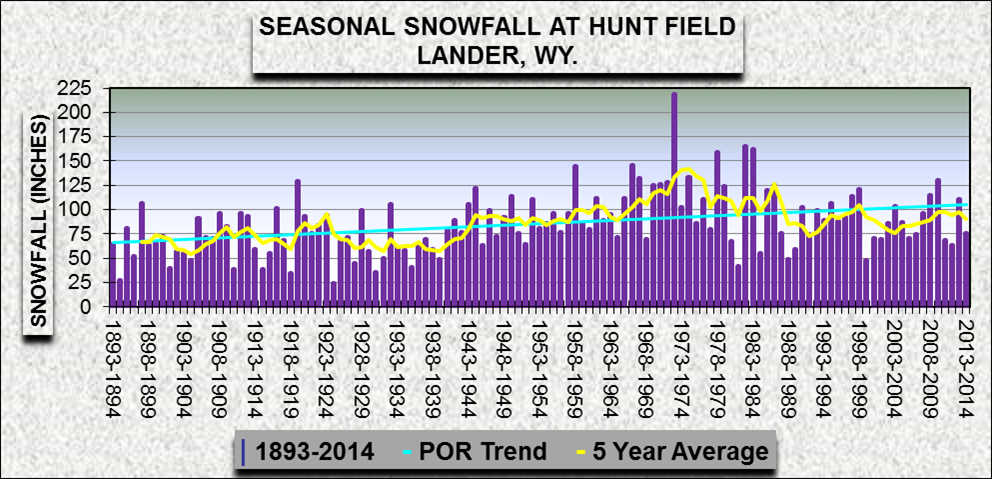
| 1 | 1973 | 199.9 | |||||
| 2 | 1975 | 160.7 | |||||
| 3 | 1983 | 159.6 | |||||
| 4 | 1967 | 154.6 | |||||
| 5 | 1959 | 150.4 | |||||
| 6 | 1971 | 148.3 | |||||
| 7 | 2013 | 138.0 | |||||
| 8 | 1978 | 128.1 | |||||
| 9 | 1920 | 127.9 | |||||
| 10 | 1892 | 125.1 | |||||
| 96 | 2014 | 63.1 | |||||
 |
 |
 |
|
| Annual and Seasonal Snowfall for Period of Record - Click on Graph to Enlarge | |
 |
Learn more about the National Weather Service's efforts to build a Weather-Ready Nation! |