|
Wyoming: May 2021
|
| Precipitation - Percent of Normal |
Temperature - Departure from Normal |
 |
 |
| Statewide Average (inches) |
|
Statewide Average (°F) |
|
| 20th Century Average |
1.77 |
20th Century Average |
38.8 |
| Rank - Driest to Wettest (125 Years) |
|
Rank - Warmest to Coldest (125 Years) |
|
| Rank - Wettest to Driest (125 Years) |
|
Rank - Coldest to Warmest (125 Years) |
|
| Driest Month on Record: April 1987 |
0.50 |
Warmest Month on Record: April 1915 |
46.0 |
| Wettest Year on Record: April 1900 |
4.10 |
Coldest Month on Record: April 1920 |
31.1 |
|
|
Wyoming: Water Year 2020-21 (October - September)
|
| Precipitation - Percent of Normal |
Temperature - Departure from Normal |
 |
|
Climate Division:
Wyoming (Statewide Averages) |
|
Oct
2020 |
Nov
2020 |
Dec
2020 |
|
Jan
2021 |
Feb
2021 |
Mar
2021 |
Apr
2021 |
May
2021 |
Jun
2021 |
Jul
2021 |
Aug
2021 |
Sep
2021 |
|
Total for
WY2020-21 |
| Average Temperature |
|
|
|
|
|
|
|
|
|
|
|
|
|
|
|
|
| 20th Century Average |
|
42.5 |
29.0 |
20.6 |
|
18.4 |
22.3 |
29.1 |
38.8 |
48.4 |
57.6 |
65.3 |
63.4 |
53.6 |
|
28.7 |
| Departure from Average |
|
|
|
|
|
|
|
|
|
|
|
|
|
|
|
|
| Rank: Warm to Cold (125 yrs) |
|
|
|
|
|
|
|
|
|
|
|
|
|
|
|
|
| Rank: Cold to Warm (125 yrs) |
|
|
|
|
|
|
|
|
|
|
|
|
|
|
|
|
 |
| Precipitation |
|
|
|
|
|
|
|
|
|
|
|
|
|
|
|
|
| 20th Century Average |
|
1.20 |
1.03 |
1.01 |
|
1.06 |
0.97 |
1.25 |
1.77 |
2.21 |
1.84 |
1.28 |
1.07 |
1.24 |
|
8.29 |
| Percent of Average |
|
|
|
|
|
|
|
|
|
|
|
|
|
|
|
|
| Rank: Dry to Wet (125 yrs) |
|
|
|
|
|
|
|
|
|
|
|
|
|
|
|
|
| Rank: Wet to Dry (125 yrs) |
|
|
|
|
|
|
|
|
|
|
|
|
|
|
|
|
 |
|
| Maps and Statewide Averages for 3, 12 and 60 Months |
|
|
Wyoming Climate Divisions: 2021
|
 |
|
| Climate Division 1 - Yellowstone Drainage |
Climate Division:
Yellowstone (Division Averages) |
|
Oct
2020 |
Nov
2020 |
Dec
2020 |
|
Jan
2021 |
Feb
2021 |
Mar
2021 |
Apr
2021 |
May
2021 |
Jun
2021 |
Jul
2021 |
Aug
2021 |
Sep
2021 |
|
Total for
WY2020-21 |
| Average Temperature |
|
|
|
|
|
|
|
|
|
|
|
|
|
|
|
|
| 20th Century Average |
|
37.3 |
24.6 |
16.9 |
|
15.2 |
18.9 |
24.3 |
33.3 |
42.4 |
50.3 |
57.9 |
56.2 |
47.4 |
|
24.4 |
| Departure from average |
|
- |
|
|
|
|
|
|
|
|
|
|
|
|
|
|
| Rank: Warm to Cold (125 yrs) |
|
|
|
|
|
|
|
|
|
|
|
|
|
|
|
|
| Rank: Cold to Warm (125 yrs) |
|
|
|
|
|
|
|
|
|
|
|
|
|
|
|
|
|
| Precipitation |
|
|
|
|
|
|
|
|
|
|
|
|
|
|
|
|
| 20th Century Average |
|
1.88 |
2.49 |
2.63 |
|
2.89 |
2.26 |
2.61 |
2.47 |
2.84 |
2.57 |
1.61 |
1.51 |
1.80 |
|
17.23 |
| Percent of Average |
|
|
|
|
|
|
|
|
|
|
|
|
|
|
|
|
| Rank: Dry to Wet (125 yrs) |
|
|
|
|
|
|
|
|
|
|
|
|
|
|
|
|
| Rank: Wet to Dry (125 yrs) |
|
|
|
|
|
|
|
|
|
|
|
|
|
|
|
|
| |
|
|
| Station Name: |
|
Oct
2020 |
Nov
2020 |
Dec
2020 |
|
Jan
2021 |
Feb
2021 |
Mar
2021 |
Apr
2021 |
May
2021 |
Jun
2021 |
Jul
2021 |
Aug
2021 |
Sep
2021 |
|
Total for
2020-21 |
| click on location |
|
D0 |
D1 |
|
|
|
|
|
|
|
|
|
|
|
|
|
|
|
|
| for graph |
D2 |
D3 |
D4 |
|
|
|
|
|
|
|
|
|
|
|
|
|
|
|
|
| Old Faithful |
None |
|
2.08 |
2.34 |
1.25 |
|
|
|
|
|
|
|
|
|
|
|
5.67 |
| 1981-2010 Normals |
|
1.66 |
2.29 |
3.16 |
|
2.11 |
1.99 |
2.21 |
2.21 |
2.80 |
2.47 |
1.55 |
1.46 |
1.46 |
|
15.63 |
| Percent of Normal |
|
125 |
102 |
40 |
|
|
|
|
|
|
|
|
|
|
|
36 |
| Snowfall |
|
8.6 |
24.8 |
26.2 |
|
|
|
|
|
|
|
|
|
|
|
59.6 |
| 1981-2010 Normals |
|
7.7 |
31.7 |
43.8 |
|
37.5 |
31.1 |
26.8 |
19.3 |
7.3 |
1.2 |
0.0 |
0.0 |
1.4 |
|
197.9 |
| Percent of Normal |
|
112 |
78 |
60 |
|
|
|
|
|
|
|
|
|
|
|
30 |
| |
|
|
|
|
|
|
|
|
|
|
|
|
|
|
|
|
|
|
| Climate Division 2 - Snake Drainage |
Climate Division:
Snake (Division Averages) |
|
Oct
2020 |
Nov
2020 |
Dec
2020 |
|
Jan
2021 |
Feb
2021 |
Mar
2021 |
Apr
2021 |
May
2021 |
Jun
2021 |
Jul
2021 |
Aug
2021 |
Sep
2021 |
|
Total for
WY2020-21 |
| Average Temperature |
|
|
|
|
|
|
|
|
|
|
|
|
|
|
|
|
| 20th Century Average |
|
37.4 |
24.3 |
16.0 |
|
14.7 |
18.3 |
23.6 |
33.0 |
42.3 |
50.0 |
57.7 |
56.0 |
47.5 |
|
23.9 |
| Departure from average |
|
|
|
|
|
|
|
|
|
|
|
|
|
|
|
|
| Rank: Warm to Cold (125 yrs) |
|
|
|
|
|
|
|
|
|
|
|
|
|
|
|
|
| Rank: Cold to Warm (125 yrs) |
|
|
|
|
|
|
|
|
|
|
|
|
|
|
|
|
|
| Precipitation |
|
|
|
|
|
|
|
|
|
|
|
|
|
|
|
|
| 20th Century Average |
|
2.12 |
3.33 |
3.72 |
|
4.34 |
3.59 |
3.45 |
2.81 |
2.91 |
2.31 |
1.32 |
1.46 |
1.77 |
|
23.36 |
| Percent of Average |
|
|
|
|
|
|
|
|
|
|
|
|
|
|
|
|
| Rank: Dry to Wet (125 yrs) |
|
|
|
|
|
|
|
|
|
|
|
|
|
|
|
|
| Rank: Wet to Dry (125 yrs) |
|
|
|
|
|
|
|
|
|
|
|
|
|
|
|
|
| |
|
|
v
| Station Name: |
|
Oct
2020 |
Nov
2020 |
Dec
2020 |
|
Jan
2021 |
Feb
2021 |
Mar
2021 |
Apr
2021 |
May
2021 |
Jun
2021 |
Jul
2021 |
Aug
2021 |
Sep
2021 |
|
Total for
WY2020-21 |
| click on location |
|
D0 |
D1 |
|
|
|
|
|
|
|
|
|
|
|
|
|
|
|
|
| for graph |
D2 |
D3 |
D4 |
|
|
|
|
|
|
|
|
|
|
|
|
|
|
|
|
| Afton |
None |
|
0.46 |
1.68 |
1.47 |
|
|
|
|
|
|
|
|
|
|
|
3.61 |
| 1981-2010 Normals |
|
1.63 |
1.48 |
1.25 |
|
1.40 |
1.09 |
1.40 |
1.54 |
2.26 |
1.97 |
1.43 |
1.25 |
1.46 |
|
9.79 |
| Percent of Normal |
|
28 |
114 |
118 |
|
|
|
|
|
|
|
|
|
|
|
37 |
| Snowfall |
|
1.5 |
13.6 |
18.3 |
|
|
|
|
|
|
|
|
|
|
|
33.4 |
| |
|
|
|
|
|
|
|
|
|
|
|
|
|
|
|
|
| Moose |
None |
|
1.77 |
2.29 |
1.4 |
|
|
|
|
|
|
|
|
|
|
|
5.46 |
| 1981-2010 Normals |
|
1.47 |
2.64 |
2.67 |
|
2.58 |
1.82 |
1.62 |
1.49 |
1.88 |
1.61 |
1.29 |
1.29 |
1.44 |
|
14.29 |
| Percent of Normal |
|
120 |
87 |
52 |
|
|
|
|
|
|
|
|
|
|
|
38 |
| Snowfall |
|
7.2 |
19.9 |
21.2 |
|
|
|
|
|
|
|
|
|
|
|
48.3 |
| 1981-2010 Normals |
|
4.8 |
24.1 |
44.7 |
|
36.9 |
26.6 |
15.9 |
7.4 |
2.2 |
0.0 |
0.0 |
0.0 |
0.2 |
|
160.4 |
| Percent of Normal |
|
150 |
83 |
47 |
|
|
|
|
|
|
|
|
|
|
|
30 |
| |
|
|
|
|
|
|
|
|
|
|
|
|
|
|
|
*Missing Data |
| JHMR MId Mtn |
None |
|
|
|
|
|
|
|
|
|
|
|
|
|
|
|
|
| Snowfall |
|
16 |
59 |
59 |
|
|
|
|
|
|
|
|
|
|
|
134 |
| 1975-2020 Average |
|
16.0 |
34.0 |
76.0 |
|
82.0 |
65.0 |
56.0 |
21.0 |
13.0 |
2.0 |
0.0 |
0.0 |
1.0 |
|
351.0 |
| Percent of Normal |
|
100 |
174 |
78 |
|
|
|
|
|
|
|
|
|
|
|
37 |
| |
|
|
|
|
|
|
|
|
|
|
|
|
|
|
|
|
|
|
| Climate Division 3 - Green and Bear Drainages |
Climate Division:
Green and Bear (Division Averages) |
|
Oct
2020 |
Nov
2020 |
Dec
2020 |
|
Jan
2021 |
Feb
2021 |
Mar
2021 |
Apr
2021 |
May
2021 |
Jun
2021 |
Jul
2021 |
Aug
2021 |
Sep
2021 |
|
Total for
WY2020-21 |
| Average Temperature |
|
|
|
|
|
|
|
|
|
|
|
|
|
|
|
|
| 20th Century Average |
|
40.7 |
27.0 |
18.3 |
|
16.2 |
19.7 |
27.0 |
37.0 |
46.6 |
55.3 |
62.8 |
60.8 |
51.6 |
|
26.6 |
| Departure from average |
|
|
|
|
|
|
|
|
|
|
|
|
|
|
|
|
| Rank: Warm to Cold (125 yrs) |
|
|
|
|
|
|
|
|
|
|
|
|
|
|
|
|
| Rank: Cold to Warm (125 yrs) |
|
|
|
|
|
|
|
|
|
|
|
|
|
|
|
|
|
| Precipitation |
|
|
|
|
|
|
|
|
|
|
|
|
|
|
|
|
| 20th Century Average |
|
1.16 |
1.03 |
1.03 |
|
1.15 |
1.06 |
1.17 |
1.37 |
1.55 |
1.14 |
0.94 |
1.00 |
1.10 |
|
7.97 |
| Percent of Average |
|
|
|
|
|
|
|
|
|
|
|
|
|
|
|
|
| Rank: Dry to Wet (125 yrs) |
|
|
|
|
|
|
|
|
|
|
|
|
|
|
|
|
| Rank: Wet to Dry (125 yrs) |
|
|
|
|
|
|
|
|
|
|
|
|
|
|
|
|
| |
|
|
v v v
| Station Name: |
|
Oct
2020 |
Nov
2020 |
Dec
2020 |
|
Jan
2021 |
Feb
2021 |
Mar
2021 |
Apr
2021 |
May
2021 |
Jun
2021 |
Jul
2021 |
Aug
2021 |
Sep
2021 |
|
Total for
WY2020-21 |
| click on location |
|
D0 |
D1 |
|
|
|
|
|
|
|
|
|
|
|
|
|
|
|
|
| for graph |
D2 |
D3 |
D4 |
|
|
|
|
|
|
|
|
|
|
|
|
|
|
|
|
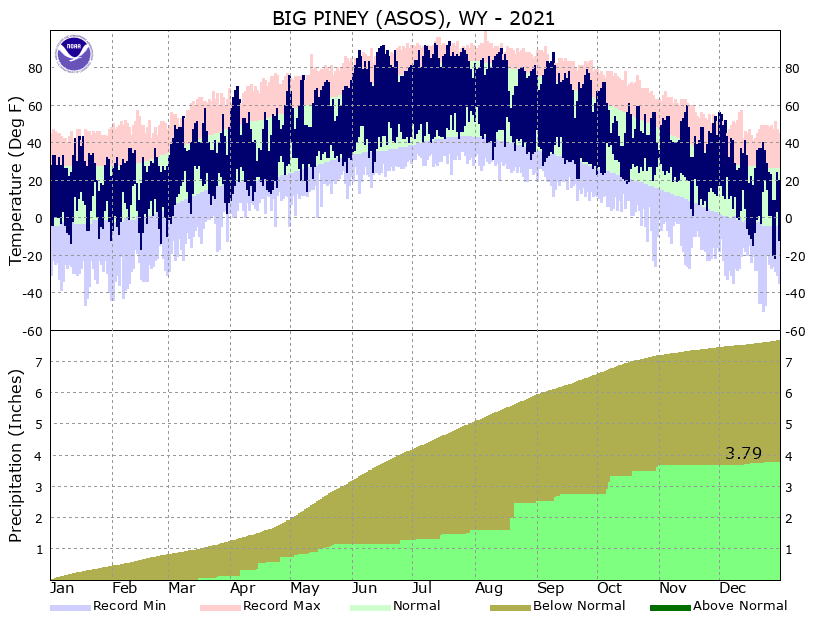
| Big Piney Airport |
None |
|
0.04 |
0.17 |
0.01 |
|
|
|
|
|
|
|
|
|
|
|
0.22 |
| 1981-2010 Normals |
|
0.53 |
0.21 |
0.30 |
|
0.31 |
0.35 |
0.44 |
0.53 |
0.84 |
0.79 |
0.71 |
0.69 |
0.78 |
|
6..48 |
| Percent of Normal |
|
8 |
81 |
3 |
|
|
|
|
|
|
|
|
|
|
|
3 |
| |
|
|
|
|
|
|
|
|
|
|
|
|
|
|
|
|
| Evanston Airport |
D0 |
|
0.22 |
0.25 |
0.05 |
|
|
|
|
|
|
|
|
|
|
|
0.52 |
| 1981-2010 Normals |
|
1.17 |
1.04 |
0.58 |
|
0.54 |
0.61 |
0.86 |
1.15 |
1.77 |
1.24 |
0.90 |
0.96 |
1.31 |
|
12.13 |
| Percent of Normal |
|
19 |
24 |
9 |
|
|
|
|
|
|
|
|
|
|
|
4 |
| |
|
|
|
|
|
|
|
|
|
|
|
|
|
|
|
|
| Rock Springs Arpt. |
None |
|
0.07 |
0.22 |
0.01 |
|
|
|
|
|
|
|
|
|
|
|
0.30 |
| 1981-2010 Normals |
|
0.87 |
0.49 |
0.50 |
|
0.45 |
0.48 |
0.68 |
0.91 |
1.21 |
0.79 |
0.64 |
0.62 |
0.92 |
|
8.56 |
| Percent of Normal |
|
8 |
45 |
2 |
|
|
|
|
|
|
|
|
|
|
|
4 |
| |
|
|
|
|
|
|
|
|
|
|
|
|
|
|
|
|
| Bitter Creek 4NE |
None |
|
0.12 |
0.22 |
0.17 |
|
|
|
|
|
|
|
|
|
|
|
0.51 |
| 1981-2010 Normals |
|
0.66 |
0.31 |
0.51 |
|
0.28 |
0.36 |
0.30 |
0.65 |
1.09 |
0.70 |
0.60 |
0.75 |
0.73 |
|
6.94 |
| Percent of Normal |
|
18 |
71 |
33 |
|
|
|
|
|
|
|
|
|
|
|
7 |
| |
|
|
|
|
|
|
|
|
|
|
|
|
|
|
|
|
| Fossil Butte N.M. |
None |
|
0.69 |
1.05 |
0.57 |
|
|
|
|
|
|
|
|
|
|
|
2.31 |
| 1981-2010 Normals |
|
1.11 |
0.86 |
0.74 |
|
0.49 |
0.68 |
0.82 |
0.98 |
1.41 |
1.03 |
0.85 |
0.93 |
1.10 |
|
11 |
| Percent of Normal |
|
32 |
122 |
77 |
|
|
|
|
|
|
|
|
|
|
|
21 |
| Snowfall |
|
1.5 |
11.4 |
8.8 |
|
|
|
|
|
|
|
|
|
|
|
21.7 |
| |
|
|
|
|
|
|
|
|
|
|
|
|
|
|
|
|
| Green River |
None |
|
0.55 |
0.28 |
0.48 |
|
|
|
|
|
|
|
|
|
|
|
1.31 |
| 1981-2010 Normals |
|
0.81 |
0.41 |
0.44 |
|
0.34 |
0.43 |
0.71 |
0.85 |
1.23 |
0.98 |
0.55 |
0.68 |
0.90 |
|
8.33 |
| Percent of Normal |
|
68 |
68 |
109 |
|
|
|
|
|
|
|
|
|
|
|
16 |
| Snowfall |
|
4.5 |
1.8 |
5.9 |
|
|
|
|
|
|
|
|
|
|
|
12.2 |
| 1981-2010 Normals |
|
0.5 |
3.8 |
6.5 |
|
4.6 |
7.3 |
5.0 |
3.9 |
0.6 |
0.0 |
0.0 |
0.0 |
0.0 |
|
32.2 |
| Percent of Normal |
|
900 |
47 |
91 |
|
|
|
|
|
|
|
|
|
|
|
38 |
| |
|
|
|
|
|
|
|
|
|
|
|
|
|
|
|
|
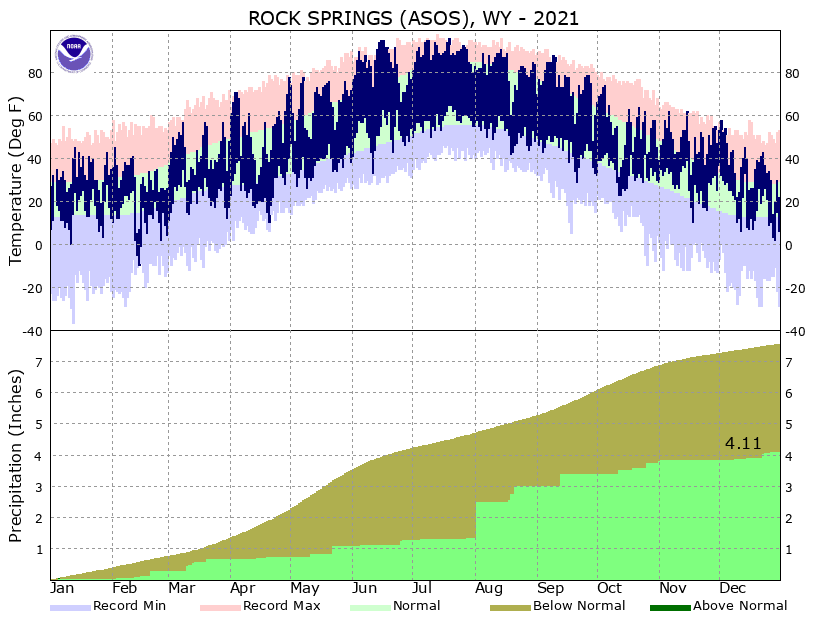
| Rock Springs |
None |
|
0.31 |
0.35 |
0.28 |
|
|
|
|
|
|
|
|
|
|
|
0.94 |
| 1981-2010 Normals |
|
1.09 |
0.52 |
0.52 |
|
0.44 |
0.46 |
0.67 |
0.91 |
1.42 |
0.86 |
0.73 |
0.96 |
1.08 |
|
9.66 |
| Percent of Normal |
|
28 |
67 |
54 |
|
|
|
|
|
|
|
|
|
|
|
10 |
| Snowfall |
|
3.5 |
4 |
6.3 |
|
|
|
|
|
|
|
|
|
|
|
13.8 |
| |
|
|
|
|
|
|
|
|
|
|
|
|
|
|
|
|
|
|
| Climate Division 4 - Big Horn Drainage |
Climate Division:
Big Horn (Division Averages) |
|
Oct
2020 |
Nov
2020 |
Dec
2020 |
|
Jan
2021 |
Feb
2021 |
Mar
2021 |
Apr
2021 |
May
2021 |
Jun
2021 |
Jul
2021 |
Aug
2021 |
Sep
2021 |
|
Total for
WY2020-21 |
| Average Temperature |
|
|
|
|
|
|
|
|
|
|
|
|
|
|
|
|
| 20th Century Average |
|
42.6 |
29.2 |
20.6 |
|
17.7 |
22.7 |
30.2 |
39.8 |
49.1 |
58.1 |
65.8 |
63.7 |
53.5 |
|
29.0 |
| Departure from average |
|
|
|
|
|
|
|
|
|
|
|
|
|
|
|
|
| Rank: Warm to Cold (125 yrs) |
|
|
|
|
|
|
|
|
|
|
|
|
|
|
|
|
| Rank: Cold to Warm (125 yrs) |
|
|
|
|
|
|
|
|
|
|
|
|
|
|
|
|
|
| Precipitation |
|
|
|
|
|
|
|
|
|
|
|
|
|
|
|
|
| 20th Century Average |
|
1.14 |
0.95 |
0.87 |
|
0.92 |
0.75 |
1.12 |
1.75 |
2.22 |
1.92 |
1.13 |
0.94 |
1.31 |
|
7.50 |
| Percent of Average |
|
|
|
|
|
|
|
|
|
|
|
|
|
|
|
|
| Rank: Dry to Wet (125 yrs) |
|
|
|
|
|
|
|
|
|
|
|
|
|
|
|
|
| Rank: Wet to Dry (125 yrs) |
|
|
|
|
|
|
|
|
|
|
|
|
|
|
|
|
| |
|
|
| Station Name: |
|
Oct
2020 |
Nov
2020 |
Dec
2020 |
|
Jan
2021 |
Feb
2021 |
Mar
2021 |
Apr
2021 |
May
2021 |
Jun
2021 |
Jul
2021 |
Aug
2021 |
Sep
2021 |
|
Total for
WY2020-21 |
| click on location |
|
D0 |
D1 |
|
|
|
|
|
|
|
|
|
|
|
|
|
|
|
|
| for graph |
D2 |
D3 |
D4 |
|
|
|
|
|
|
|
|
|
|
|
|
|
|
|
|
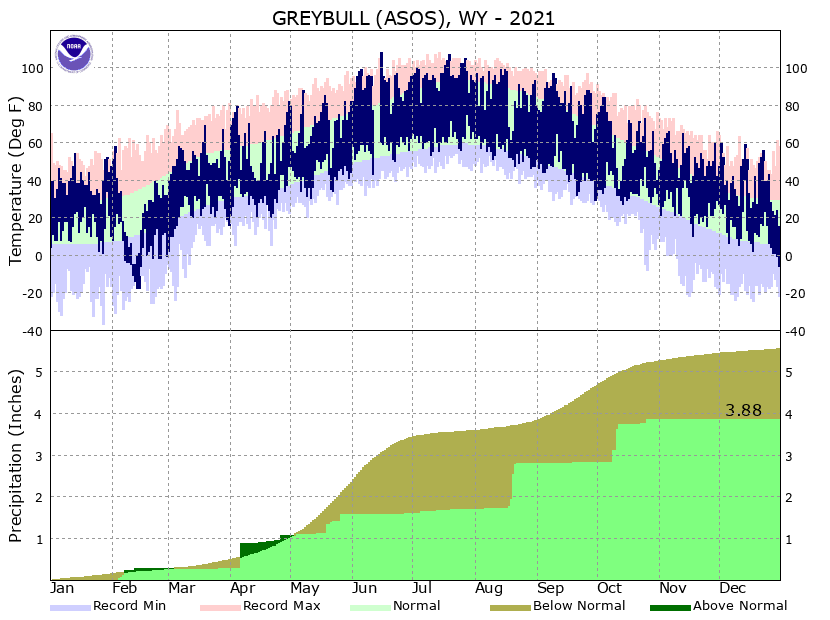
| Greybull Airport |
D0 |
|
0.4 |
T |
0.04 |
|
|
|
|
|
|
|
|
|
|
|
0.44 |
| 1981-2010 Normals |
|
0.60 |
0.30 |
0.28 |
|
0.23 |
0.18 |
0.40 |
0.71 |
1.65 |
1.20 |
0.66 |
0.42 |
0.88 |
|
7.51 |
| Percent of Normal |
|
67 |
0 |
14 |
|
|
|
|
|
|
|
|
|
|
|
6 |
| |
|
|
|
|
|
|
|
|
|
|
|
|
|
|
|
|
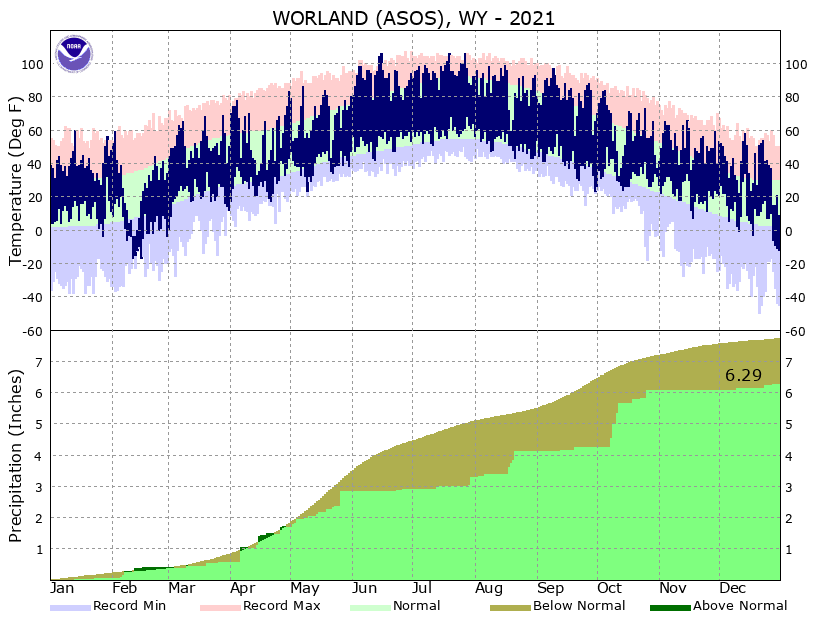
| Worland Airport |
None |
|
0.18 |
0.04 |
0.09 |
|
|
|
|
|
|
|
|
|
|
|
0.31 |
| 1981-2010 Normals |
|
0.69 |
0.35 |
0.23 |
|
0.23 |
0.19 |
0.46 |
0.86 |
1.42 |
1.15 |
0.71 |
0.43 |
0.85 |
|
7.57 |
| Percent of Normal |
|
26 |
11 |
39 |
|
|
|
|
|
|
|
|
|
|
|
4 |
| |
|
|
|
|
|
|
|
|
|
|
|
|
|
|
|
|
| Cody |
D0 |
|
0.9 |
0.32 |
0.1 |
|
|
|
|
|
|
|
|
|
|
|
1.32 |
| 1981-2010 Normals |
|
0.89 |
0.48 |
0.33 |
|
0.33 |
0.33 |
0.56 |
1.06 |
1.82 |
1.68 |
1.11 |
0.91 |
1.06 |
|
10.56 |
| Percent of Normal |
|
101 |
67 |
30 |
|
|
|
|
|
|
|
|
|
|
|
13 |
| Snowfall |
|
5 |
1.2 |
1.2 |
|
|
|
|
|
|
|
|
|
|
|
7.4 |
| 1981-2010 Normals |
|
4.3 |
6.3 |
8.0 |
|
7.8 |
6.7 |
6.9 |
6.3 |
0.8 |
0.0 |
0.0 |
0.0 |
0.2 |
|
47.3 |
| Percent of Normal |
|
116 |
19 |
15 |
|
|
|
|
|
|
|
|
|
|
|
16 |
| |
|
|
|
|
|
|
|
|
|
|
|
|
|
|
|
|
| Powell Field Station |
D0 |
|
0.29 |
0.09 |
0.07 |
|
|
|
|
|
|
|
|
|
|
|
0.39 |
| 1981-2010 Normals |
|
0.56 |
0.18 |
0.13 |
|
0.21 |
0.13 |
0.29 |
0.51 |
1.40 |
1.35 |
0.87 |
0.52 |
0.65 |
|
6.8 |
| Percent of Normal |
|
52 |
50 |
8 |
|
|
|
|
|
|
|
|
|
|
|
6 |
| Snowfall |
|
2.5 |
0.2 |
0.4 |
|
|
|
|
|
|
|
|
|
|
|
3.1 |
| 1981-2010 Normals |
|
1.2 |
1.3 |
1.2 |
|
2.3 |
0.5 |
2.5 |
0.5 |
0.5 |
0.0 |
0.0 |
0.0 |
0.1 |
|
10 |
| Percent of Normal |
|
208 |
15 |
33 |
|
|
|
|
|
|
|
|
|
|
|
31 |
| |
|
|
|
|
|
|
|
|
|
|
|
|
|
|
|
|
| Thermopolis |
None |
|
0.2 |
0.01 |
0.31 |
|
|
|
|
|
|
|
|
|
|
|
0.52 |
| 1981-2010 Normals |
|
1.26 |
0.80 |
0.46 |
|
0.35 |
0.45 |
0.87 |
1.46 |
1.86 |
1.51 |
0.88 |
0.58 |
1.23 |
|
11.71 |
| Percent of Normal |
|
16 |
1 |
67 |
|
|
|
|
|
|
|
|
|
|
|
4 |
| Snowfall |
|
4 |
0 |
3.5 |
|
|
|
|
|
|
|
|
|
|
|
7.5 |
| 1981-2010 Normals |
|
3.7 |
4.5 |
5.6 |
|
4.6 |
2.5 |
2.8 |
0.4 |
0.0 |
0.0 |
0.0 |
0.2 |
2.4 |
|
26.7 |
| Percent of Normal |
|
108 |
0 |
63 |
|
|
|
|
|
|
|
|
|
|
|
28 |
|
|
| Climate Division 5 - Powder and Tongue Drainages |
Climate Division:
Powder and Tongue
(Division Averages) |
|
Oct
2020 |
Nov
2020 |
Dec
2020 |
|
Jan
2021 |
Feb
2021 |
Mar
2021 |
Apr
2021 |
May
2021 |
Jun
2021 |
Jul
2021 |
Aug
2021 |
Sep
2021 |
|
Total for
WY2020-21 |
| Average Temperature |
|
|
|
|
|
|
|
|
|
|
|
|
|
|
|
|
| 20th Century Average |
|
44.6 |
31.0 |
22.3 |
|
19.6 |
23.8 |
31.1 |
41.2 |
50.8 |
60.2 |
68.2 |
66.5 |
55.9 |
|
28,7 |
| Departure from average |
|
|
|
|
|
|
|
|
|
|
|
|
|
|
|
|
| Rank: Warm to Cold (125 yrs) |
|
|
|
|
|
|
|
|
|
|
|
|
|
|
|
|
| Rank: Cold to Warm (125 yrs) |
|
|
|
|
|
|
|
|
|
|
|
|
|
|
|
|
|
| Precipitation |
|
|
|
|
|
|
|
|
|
|
|
|
|
|
|
|
| 20th Century Average |
|
1.16 |
0.77 |
0.65 |
|
0.63 |
0.61 |
1.05 |
1.85 |
2.54 |
2.35 |
1.40 |
0.99 |
1.28 |
|
6.72 |
| Percent of Average |
|
|
|
|
|
|
|
|
|
|
|
|
|
|
|
|
| Rank: Dry to Wet (125 yrs) |
|
|
|
|
|
|
|
|
|
|
|
|
|
|
|
|
| Rank: Wet to Dry (125 yrs) |
|
|
|
|
|
|
|
|
|
|
|
|
|
|
|
|
| |
|
|
| Station Name: |
|
Oct
2020 |
Nov
2020 |
Dec
2020 |
|
Jan
2021 |
Feb
2021 |
Mar
2021 |
Apr
2021 |
May
2021 |
Jun
2021 |
Jul
2021 |
Aug
2021 |
Sep
2021 |
|
Total for
WY2020-21 |
| click on location |
|
D0 |
D1 |
|
|
|
|
|
|
|
|
|
|
|
|
|
|
|
|
| for graph |
D2 |
D3 |
D4 |
|
|
|
|
|
|
|
|
|
|
|
|
|
|
|
|
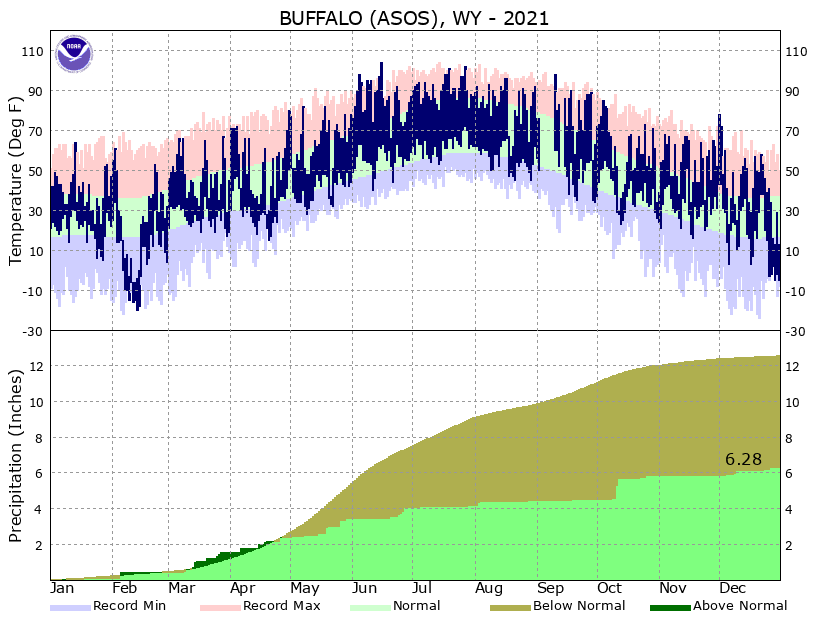
| Buffalo Airport |
D0 |
|
1.17 |
0.08 |
0 |
|
|
|
|
|
|
|
|
|
|
|
1.25 |
| 1981-2010 Normals |
|
0.93 |
0.54 |
0.40 |
|
0.42 |
0.35 |
0.92 |
1.30 |
2.53 |
2.28 |
1.66 |
0.81 |
1.31 |
|
13.45 |
| Percent of Normal |
|
126 |
15 |
0 |
|
|
|
|
|
|
|
|
|
|
|
9 |
| |
|
|
|
|
|
|
|
|
|
|
|
|
|
|
|
|
| Sheridan Arpt |
D0 |
|
2.62 |
0.04 |
0.28 |
|
|
|
|
|
|
|
|
|
|
|
2.94 |
| 1981-2010 Normals |
|
1.41 |
0.71 |
0.56 |
|
0.56 |
0.54 |
0.98 |
1.60 |
2.35 |
2.12 |
1.18 |
0.72 |
1.43 |
|
14.16 |
| Percent of Normal |
|
186 |
6 |
50 |
|
|
|
|
|
|
|
|
|
|
|
21 |
| |
|
|
|
|
|
|
|
|
|
|
|
|
|
|
|
|
| Kaycee |
None |
|
0.36 |
0.10 |
0.41 |
|
|
|
|
|
|
|
|
|
|
|
0.87 |
| 1981-2010 Normals |
|
1,04 |
0.57 |
0.31 |
|
0.30 |
0.34 |
0.74 |
1.46 |
2.37 |
1.84 |
1.42 |
0.80 |
1.18 |
|
12.37 |
| Percent of Normal |
|
35 |
18 |
132 |
|
|
|
|
|
|
|
|
|
|
|
7 |
| Snowfall |
|
4 |
1.2 |
8 |
|
|
|
|
|
|
|
|
|
|
|
13.2 |
| 1981-2010 Normals |
|
1.5 |
4.2 |
6.0 |
|
5.9 |
6.3 |
8.0 |
4.7 |
0.6 |
0.1 |
0.0 |
0.0 |
0.2 |
|
37.5 |
| Percent of Normal |
|
267 |
29 |
133 |
|
|
|
|
|
|
|
|
|
|
|
35 |
| |
|
|
|
|
|
|
|
|
|
|
|
|
|
|
|
|
|
|
| Climate Division 6 - Belle Fourche Drainage |
v
Climate Division:
Belle Fourche (Division Averages) |
|
Oct
2020 |
Nov
2020 |
Dec
2020 |
|
Jan
2021 |
Feb
2021 |
Mar
2021 |
Apr
2021 |
May
2021 |
Jun
2021 |
Jul
2021 |
Aug
2021 |
Sep
2021 |
|
Total for
WY2020-21 |
| Average Temperature |
|
|
|
|
|
|
|
|
|
|
|
|
|
|
|
|
| 20th Century Average |
|
45.0 |
31.0 |
22.1 |
|
19.0 |
23.1 |
30.6 |
41.4 |
51.3 |
60.9 |
68.8 |
67.0 |
56.4 |
|
30.3 |
| Departure from average |
|
|
|
|
|
|
|
|
|
|
|
|
|
|
|
|
| Rank: Warm to Cold (125 yrs) |
|
|
|
|
|
|
|
|
|
|
|
|
|
|
|
|
| Rank: Cold to Warm (125 yrs) |
|
|
|
|
|
|
|
|
|
|
|
|
|
|
|
|
|
| Precipitation |
|
|
|
|
|
|
|
|
|
|
|
|
|
|
|
|
| 20th Century Average |
|
1.14 |
0.69 |
0.64 |
|
0.59 |
0.59 |
0.98 |
1.75 |
2.66 |
2.83 |
1.84 |
1.33 |
1.32 |
|
6.38 |
| Percent of Average |
|
|
|
|
|
|
|
|
|
|
|
|
|
|
|
|
| Rank: Dry to Wet (125 yrs) |
|
|
|
|
|
|
|
|
|
|
|
|
|
|
|
|
| Rank: Wet to Dry (125 yrs) |
|
|
|
|
|
|
|
|
|
|
|
|
|
|
|
|
| |
|
|
\
| Station Name: |
|
Oct
2020 |
Nov
2020 |
Dec
2020 |
|
Jan
2021 |
Feb
2021 |
Mar
2021 |
Apr
2021 |
May
2021 |
Jun
2021 |
Jul
2021 |
Aug
2021 |
Sep
2021 |
|
Total for
WY2020-21 |
| click on location |
|
D0 |
D1 |
|
|
|
|
|
|
|
|
|
|
|
|
|
|
|
|
| for graph |
D2 |
D3 |
D4 |
|
|
|
|
|
|
|
|
|
|
|
|
|
|
|
|
| Gillette Airport |
None |
|
1.31 |
0.09 |
0.33 |
|
|
|
|
|
|
|
|
|
|
|
1.73 |
| 1981-2010 Normals |
|
1.27 |
0.55 |
0.40 |
|
0.39 |
0.39 |
0.96 |
1.47 |
2.45 |
2.21 |
1.66 |
0.95 |
1.19 |
|
13.89 |
| Percent of Normal |
|
103 |
16 |
83 |
|
|
|
|
|
|
|
|
|
|
|
12 |
| |
|
|
|
|
|
|
|
|
|
|
|
|
|
|
|
|
|
|
| Climate Division 7 - Cheyenne and Niobrara Drainages |
v v
Climate Division: Cheyenne and Niobrara
(Division Averages) |
|
Oct
2020 |
Nov
2020 |
Dec
2020 |
|
Jan
2021 |
Feb
2021 |
Mar
2021 |
Apr
2021 |
May
2021 |
Jun
2021 |
Jul
2021 |
Aug
2021 |
Sep
2021 |
|
Total for
WY2020-21 |
| Average Temperature |
|
|
|
|
|
|
|
|
|
|
|
|
|
|
|
|
| 20th Century Average |
|
45.8 |
31.8 |
23.0 |
|
20.3 |
24.6 |
32.1 |
42.5 |
52.4 |
62.5 |
70.3 |
68.4 |
57.6 |
|
31.4 |
| Departure from average |
|
|
|
|
|
|
|
|
|
|
|
|
|
|
|
|
| Rank: Warm to Cold (125 yrs) |
|
|
|
|
|
|
|
|
|
|
|
|
|
|
|
|
| Rank: Cold to Warm (125 yrs) |
|
|
|
|
|
|
|
|
|
|
|
|
|
|
|
|
|
| Precipitation |
|
|
|
|
|
|
|
|
|
|
|
|
|
|
|
|
| 20th Century Average |
|
0.95 |
0.55 |
0.48 |
|
0.42 |
0.46 |
0.76 |
1.68 |
2.53 |
2.34 |
1.78 |
1.21 |
1.14 |
|
5.30 |
| Percent of Average |
|
|
|
|
|
|
|
|
|
|
|
|
|
|
|
|
| Rank: Dry to Wet (125 yrs) |
|
|
|
|
|
|
|
|
|
|
|
|
|
|
|
|
| Rank: Wet to Dry (125 yrs) |
|
|
|
|
|
|
|
|
|
|
|
|
|
|
|
|
| |
|
|
|
| Climate Division 8 - Lower Platte Drainage |
Climate Division:
Lower Platte (Division Averages) |
|
Oct
2020 |
Nov
2020 |
Dec
2020 |
|
Jan
2021 |
Feb
2021 |
Mar
2021 |
Apr
2021 |
May
2021 |
Jun
2021 |
Jul
2021 |
Aug
2021 |
Sep
2021 |
|
Total for
WY2020-21 |
| Average Temperature |
|
|
|
|
|
|
|
|
|
|
|
|
|
|
|
|
| 20th Century Average |
|
45.2 |
32.3 |
24.7 |
|
22.8 |
25.9 |
32.1 |
41.2 |
50.8 |
60.7 |
68.0 |
66.2 |
56.4 |
|
32.0 |
| Departure from Average |
|
|
|
|
|
|
|
|
|
|
|
|
|
|
|
|
| Rank: Warm to Cold (125 yrs) |
|
|
|
|
|
|
|
|
|
|
|
|
|
|
|
|
| Rank: Cold to Warm (125 yrs) |
|
|
|
|
|
|
|
|
|
|
|
|
|
|
|
|
|
| Precipitation |
|
|
|
|
|
|
|
|
|
|
|
|
|
|
|
|
| 20th Century Average |
|
1.05 |
0.68 |
0.63 |
|
0.51 |
0.59 |
0.97 |
1.90 |
2.55 |
2.05 |
1.58 |
1.17 |
1.21 |
|
6.33 |
| Percent of Average |
|
|
|
|
|
|
|
|
|
|
|
|
|
|
|
|
| Rank: Dry to Wet (125 yrs) |
|
|
|
|
|
|
|
|
|
|
|
|
|
|
|
|
| Rank: Wet to Dry (125 yrs) |
|
|
|
|
|
|
|
|
|
|
|
|
|
|
|
|
| |
|
|
| Station Name: |
|
Oct
2020 |
Nov
2020 |
Dec
2020 |
|
Jan
2021 |
Feb
2021 |
Mar
2021 |
Apr
2021 |
May
2021 |
Jun
2021 |
Jul
2021 |
Aug
2021 |
Sep
2021 |
|
Total for
WY2020-21 |
| click on location |
|
D0 |
D1 |
|
|
|
|
|
|
|
|
|
|
|
|
|
|
|
|
| for graph |
D2 |
D3 |
D4 |
|
|
|
|
|
|
|
|
|
|
|
|
|
|
|
|
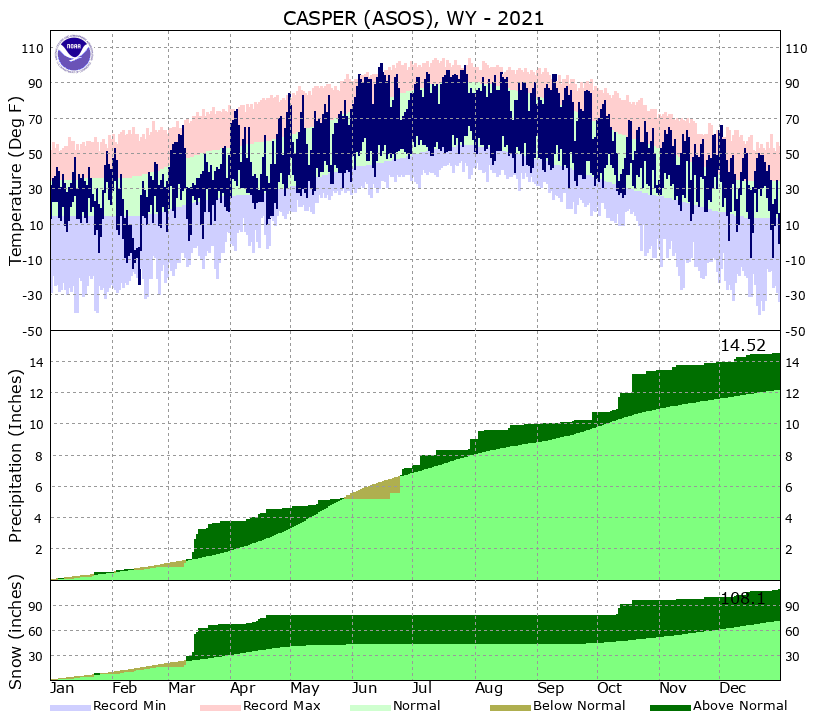
| Casper Airport |
None |
|
0.32 |
0.04 |
0.68 |
|
|
|
|
|
|
|
|
|
|
|
1.04 |
| 1981-2010 Normals |
|
1.11 |
0.76 |
0.49 |
|
0.51 |
0.57 |
0.82 |
1.29 |
2.02 |
1.61 |
1.41 |
0.85 |
1.08 |
|
12.52 |
| Percent of Normal |
|
29 |
5 |
139 |
|
|
|
|
|
|
|
|
|
|
|
8 |
| Snowfall |
|
3.7 |
0.4 |
11 |
|
|
|
|
|
|
|
|
|
|
|
15.1 |
| 1981-2010 Normals |
|
7.4 |
10.3 |
11.0 |
|
9.1 |
9.8 |
10.9 |
11.6 |
2.9 |
0.1 |
0.0 |
0.0 |
1.8 |
|
74.9 |
| Percent of Normal |
|
50 |
4 |
100 |
|
|
|
|
|
|
|
|
|
|
|
20 |
| |
|
|
|
|
|
|
|
|
|
|
|
|
|
|
|
|
| Cheyenne Arpt |
None |
|
0.85 |
0.18 |
0.48 |
|
|
|
|
|
|
|
|
|
|
|
1.51 |
| 1981-2010 Normals |
|
0.93 |
0.59 |
0.49 |
|
0.33 |
0.47 |
1.05 |
1.78 |
2.34 |
2.34 |
2.19 |
1.95 |
1.48 |
|
15.94 |
| Percent of Normal |
|
91 |
31 |
98 |
|
|
|
|
|
|
|
|
|
|
|
9 |
| Snowfall |
|
15.1 |
3 |
5.6 |
|
|
|
|
|
|
|
|
|
|
|
23.7 |
| 1981-2010 Normals |
|
5.0 |
8.0 |
8.4 |
|
5.9 |
7.9 |
11.3 |
10.2 |
2.3 |
0.0 |
0.0 |
0.0 |
1.3 |
|
60.3 |
| Percent of Normal |
|
302 |
38 |
67 |
|
|
|
|
|
|
|
|
|
|
|
39 |
| |
|
|
|
|
|
|
|
|
|
|
|
|
|
|
|
|
|
|
| Climate Division 9 - Wind River Drainage |
Climate Division:
Wind River (Division Averages) |
|
Oct
2020 |
Nov
2020 |
Dec
2020 |
|
Jan
2021 |
Feb
2021 |
Mar
2021 |
Apr
2021 |
May
2021 |
Jun
2021 |
Jul
2021 |
Aug
2021 |
Sep
2021 |
|
Total for
WY2020-21 |
| Average Temperature |
|
|
|
|
|
|
|
|
|
|
|
|
|
|
|
|
| 20th Century Average |
|
41.8 |
27.9 |
19.5 |
|
17.3 |
22.0 |
29.0 |
38.3 |
48.0 |
57.0 |
64.7 |
62.8 |
52.9 |
|
28.0 |
| Departure from average |
|
|
|
|
|
|
|
|
|
|
|
|
|
|
|
|
| Rank: Warm to Cold (125 yrs) |
|
|
|
|
|
|
|
|
|
|
|
|
|
|
|
|
| Rank: Cold to Warm (125 yrs) |
|
|
|
|
|
|
|
|
|
|
|
|
|
|
|
|
|
| Precipitation |
|
|
|
|
|
|
|
|
|
|
|
|
|
|
|
|
| 20th Century Average |
|
1.20 |
0.96 |
0.84 |
|
0.93 |
0.81 |
1.26 |
1.89 |
2.25 |
1.67 |
1.04 |
0.88 |
1.19 |
|
7.89 |
| Percent of Average |
|
|
|
|
|
|
|
|
|
|
|
|
|
|
|
|
| Rank: Dry to Wet (125 yrs) |
|
|
|
|
|
|
|
|
|
|
|
|
|
|
|
|
| Rank: Wet to Dry (125 yrs) |
|
|
|
|
|
|
|
|
|
|
|
|
|
|
|
|
| |
|
|
v
| Station Name: |
|
Oct
2020 |
Nov
2020 |
Dec
2020 |
|
Jan
2021 |
Feb
2021 |
Mar
2021 |
Apr
2021 |
May
2021 |
Jun
2021 |
Jul
2021 |
Aug
2021 |
Sep
2021 |
|
Total for
WY2020-21 |
| click on location |
|
D0 |
D1 |
|
|
|
|
|
|
|
|
|
|
|
|
|
|
|
|
| for graph |
D2 |
D3 |
D4 |
|
|
|
|
|
|
|
|
|
|
|
|
|
|
|
|
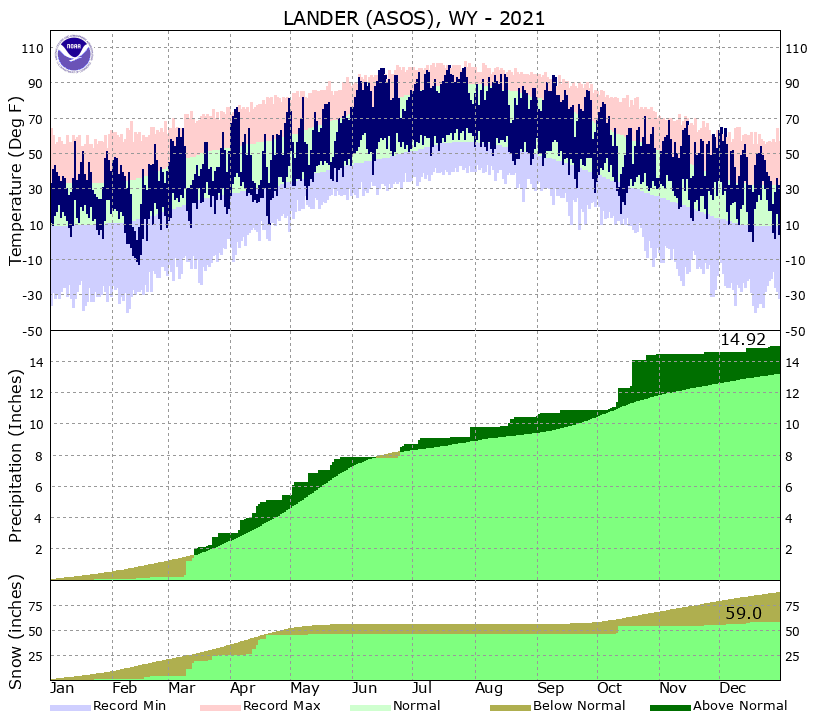
| Lander Airport |
None |
|
0.68 |
0.18 |
0.59 |
|
|
|
|
|
|
|
|
|
|
|
1.45 |
| 1981-2010 Normals |
|
1.29 |
0.86 |
0.58 |
|
0.41 |
0.58 |
1.16 |
1.87 |
2.20 |
1.27 |
0.78 |
0.61 |
1.05 |
|
12.66 |
| Percent of Normal |
|
53 |
21 |
102 |
|
|
|
|
|
|
|
|
|
|
|
11 |
| Snowfall |
|
7.8 |
T |
9.3 |
|
|
|
|
|
|
|
|
|
|
|
17.1 |
| 1981-2010 Normals |
|
9.8 |
13.1 |
10.1 |
|
7.6 |
10.3 |
16.1 |
16.8 |
4.8 |
0.1 |
0.0 |
0.0 |
2.7 |
|
91.4 |
| Percent of Normal |
|
80 |
0 |
92 |
|
|
|
|
|
|
|
|
|
|
|
19 |
| |
|
|
|
|
|
|
|
|
|
|
|
|
|
|
|
|
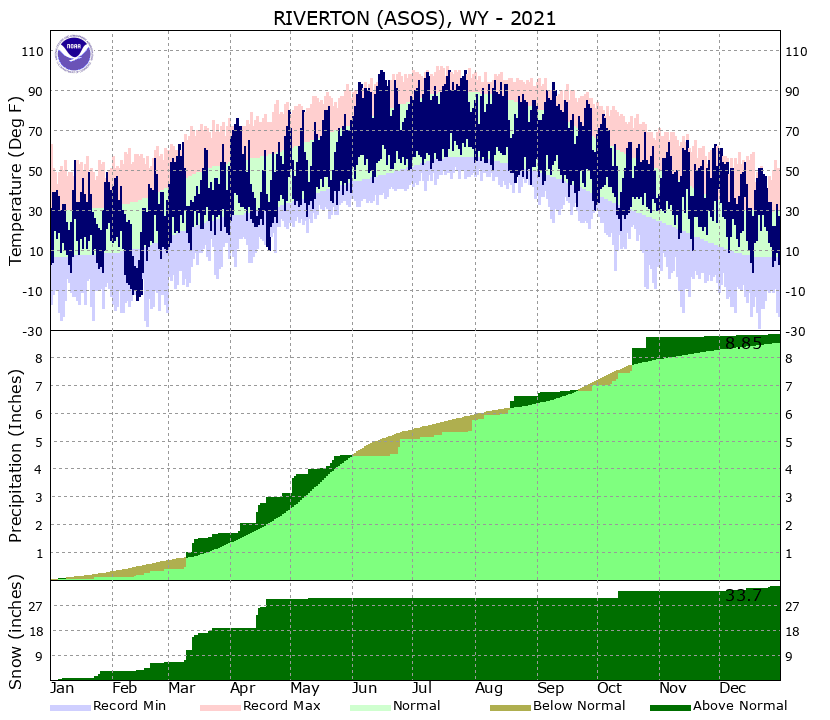
| Riverton Airport |
None |
|
0.23 |
0.05 |
0.36 |
|
|
|
|
|
|
|
|
|
|
|
0.64 |
| 1981-2010 Normals |
|
0.89 |
0.50 |
0.32 |
|
0.24 |
0.27 |
0.55 |
1.30 |
1.72 |
1.28 |
0.89 |
0.57 |
0.90 |
|
9.43 |
| Percent of Normal |
|
26 |
10 |
113 |
|
|
|
|
|
|
|
|
|
|
|
7 |
| Snowfall |
|
3.8 |
T |
8.2 |
|
|
|
|
|
|
|
|
|
|
|
12 |
| |
|
|
|
|
|
|
|
|
|
|
|
|
|
|
|
|
| Dubois |
None |
|
0.7 |
0.47 |
0.10 |
|
|
|
|
|
|
|
|
|
|
|
1.27 |
| 1981-2010 Normals |
|
0.81 |
0.57 |
0.28 |
|
0.24 |
0.38 |
0.40 |
1.10 |
1.64 |
1.28 |
1.11 |
0.86 |
1.24 |
|
9.91 |
| Percent of Normal |
|
86 |
82 |
36 |
|
|
|
|
|
|
|
|
|
|
|
13 |
| Snowfall |
|
9.5 |
6.5 |
1.7 |
|
|
|
|
|
|
|
|
|
|
|
17.7 |
| 1981-2010 Normals |
|
3.0 |
5.8 |
5.1 |
|
3.9 |
5.7 |
6.0 |
8.5 |
3.9 |
0.6 |
0.0 |
0.0 |
2.6 |
|
45.1 |
| Percent of Normal |
|
317 |
112 |
33 |
|
|
|
|
|
|
|
|
|
|
|
39 |
| |
|
|
|
|
|
|
|
|
|
|
|
|
|
|
|
|
| Riverton |
None |
|
0.18 |
0.03 |
0.36 |
|
|
|
|
|
|
|
|
|
|
|
0.57 |
| 1981-2010 Normals |
|
0.85 |
0.41 |
0.24 |
|
0.28 |
0.33 |
0.56 |
0.98 |
1.45 |
1.21 |
0.78 |
0.50 |
0.83 |
|
8.42 |
| Percent of Normal |
|
21 |
7 |
150 |
|
|
|
|
|
|
|
|
|
|
|
7 |
| Snowfall |
|
3.8 |
T |
6.4 |
|
|
|
|
|
|
|
|
|
|
|
10.2 |
| 1981-2010 Normals |
|
3.7 |
4.3 |
4.8 |
|
4.8 |
6.0 |
5.9 |
6.1 |
1.2 |
0.0 |
0.0 |
0.0 |
0.3 |
|
37.1 |
| Percent of Normal |
|
103 |
0 |
133 |
|
|
|
|
|
|
|
|
|
|
|
27 |
|
|
| Climate Division 10 - Upper Platte Drainage |
Climate Division:
Upper Platte (Division Averages) |
|
Oct
2020 |
Nov
2020 |
Dec
2020 |
|
Jan
2021 |
Feb
2021 |
Mar
2021 |
Apr
2021 |
May
2021 |
Jun
2021 |
Jul
2021 |
Aug
2021 |
Sep
2021 |
|
Total for
WY2020-21 |
| Average Temperature |
|
|
|
|
|
|
|
|
|
|
|
|
|
|
|
|
| 20th Century Average |
|
41.8 |
28.3 |
20.2 |
|
18.3 |
21.7 |
28.0 |
37.5 |
47.4 |
57.1 |
64.5 |
62.6 |
52.9 |
|
28.0 |
| Departure from average |
|
|
|
|
|
|
|
|
|
|
|
|
|
|
|
|
| Rank: Warm to Cold (125 yrs) |
|
|
|
|
|
|
|
|
|
|
|
|
|
|
|
|
| Rank: Cold to Warm (125 yrs) |
|
|
|
|
|
|
|
|
|
|
|
|
|
|
|
|
|
| Precipitation |
|
|
|
|
|
|
|
|
|
|
|
|
|
|
|
|
| 20th Century Average |
|
1.09 |
0.83 |
0.82 |
|
0.80 |
0.83 |
1.06 |
1.58 |
1.78 |
1.27 |
1.10 |
0.93 |
1.08 |
|
7.01 |
| Percent of Average |
|
|
|
|
|
|
|
|
|
|
|
|
|
|
|
|
| Rank: Dry to Wet (125 yrs) |
|
|
|
|
|
|
|
|
|
|
|
|
|
|
|
|
| Rank: Wet to Dry (125 yrs) |
|
|
|
|
|
|
|
|
|
|
|
|
|
|
|
|
| |
|
|
| Station Name: |
|
Oct
2020 |
Nov
2020 |
Dec
2020 |
|
Jan
2021 |
Feb
2021 |
Mar
2021 |
Apr
2021 |
May
2021 |
Jun
2021 |
Jul
2021 |
Aug
2021 |
Sep
2021 |
|
Total for
WY2020-21 |
| click on location |
|
D0 |
D1 |
|
|
|
|
|
|
|
|
|
|
|
|
|
|
|
|
| for graph |
D2 |
D3 |
D4 |
|
|
|
|
|
|
|
|
|
|
|
|
|
|
|
|
| Jeffrey City |
None |
|
0.23 |
0.15 |
0.60 |
|
|
|
|
|
|
|
|
|
|
|
0.98 |
| 1981-2010 Normals |
|
0.91 |
0.59 |
0.42 |
|
0.31 |
0.41 |
0.86 |
1.27 |
1.85 |
1.15 |
0.89 |
0.60 |
0.80 |
|
10.06 |
| Percent of Normal |
|
25 |
25 |
143 |
|
|
|
|
|
|
|
|
|
|
|
10 |
| Snowfall |
|
3.3 |
0.1 |
7.9 |
|
|
|
|
|
|
|
|
|
|
|
11.3 |
| 1981-2010 Normals |
|
7.3 |
6.6 |
5.5 |
|
4.6 |
6.7 |
9.4 |
10.2 |
4.9 |
0.4 |
0.0 |
0.0 |
1.4 |
|
57 |
| Percent of Normal |
|
45 |
2 |
144 |
|
|
|
|
|
|
|
|
|
|
|
20 |
|
|
 |
Previous Annual and Water Year Climate Summaries |
 |
|


