
Strong to severe thunderstorms will continue through tonight across portions of the Southeast and Southwest Texas. Large hail and strong winds will be the primary threats. Heavy to excessive rainfall may lead to scattered instances of flash flooding in these regions tonight. Read More >
Links | Map | Current Warnings, Radar, and Satellite |Weather Outlook & Climate | SPC Fire and Thunder Forecasts
| Fuels and Fire Danger Maps
 |
 |
|
Map showing heat detected by a satellite over the Station Fire up through 11:36 a.m., October 12, 2015. The dots represent heat, but most of the vegetation is grass which can burn and then cool off before the next satellite overflight. Wildfire Today. Click on image to enlarge. |
Above are two images taken from the USDA Forest Service Remote Sensing Applications Center. These images were taken on Sunday, October 11th right around the time the Cole Creek / Station Fire blew up near Evansville. The image on the left is a combination of satellite spectral bands that are combined to create a "true color" image. The image on the right is a "false color" image that uses a combination of satellite bands/channels to produce an image that highlights hot spots. Click on image to enlarge. |
Current Warnings, Radar, and Satellite
 |
|
|
|
|
|
|
|

|

|
 |
|
|
|
|
|
|
Weather Outlook and Climate Information
(Click thumbnails to expand Images)
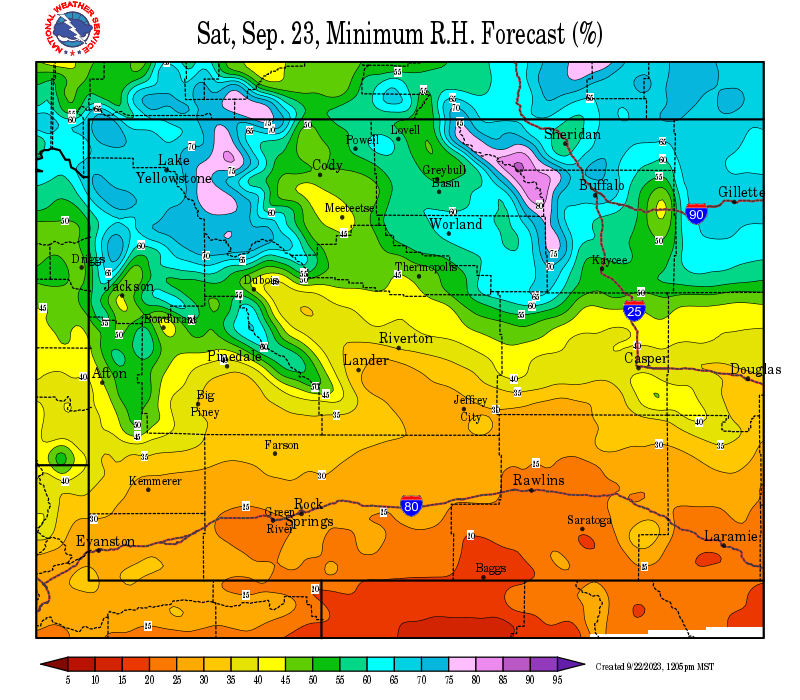
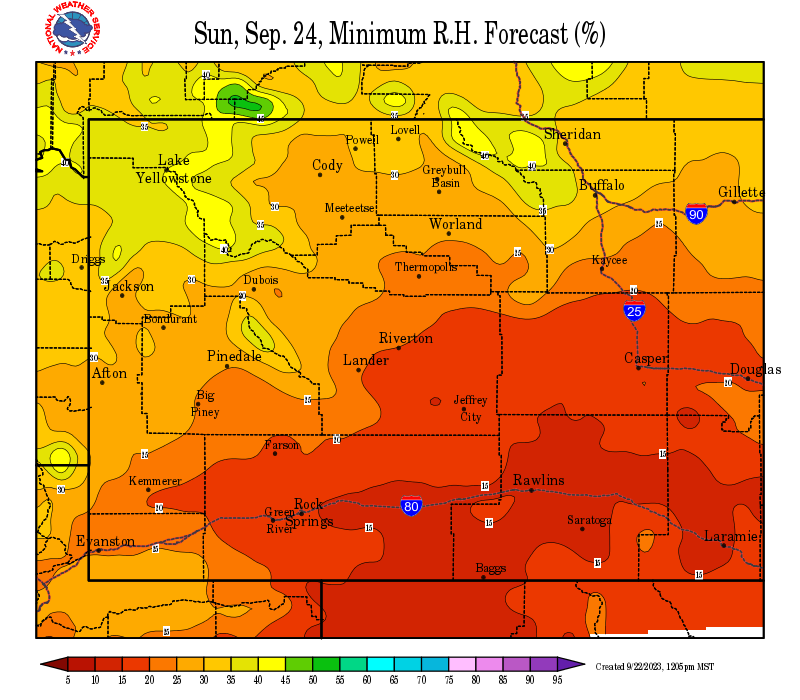
| Local Precipitation, Wind, and Humidity Information (NWS) |
|
|
|
|
|
 |
 |
 |
 |
|
|
|
|
|
 |
 |
 |
 |
|
|
|
|
|
|
|
 |
 |
 |
 |
|
|
|
|
|
 |
 |
 |
 |
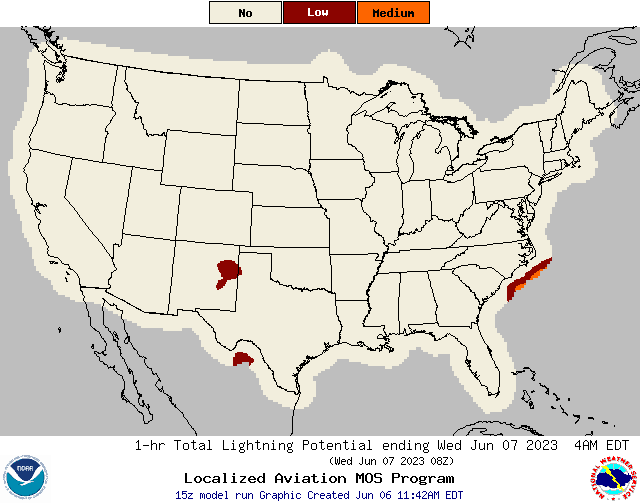
Storm Prediction Center Critical Fire Areas and Thunderstorm Forecasts
|
|
|
|
 |
 |
 |
|
|
|
|
 |
 |

|
|
|
|
|
 |
 |
 |
|
|
|
|
|
|
|
|
|
|
|
|
|
|
|
|
|
 |

|
 |
 |
 |
|
|
|
|
|
|
 |

|
 |
 |
 |
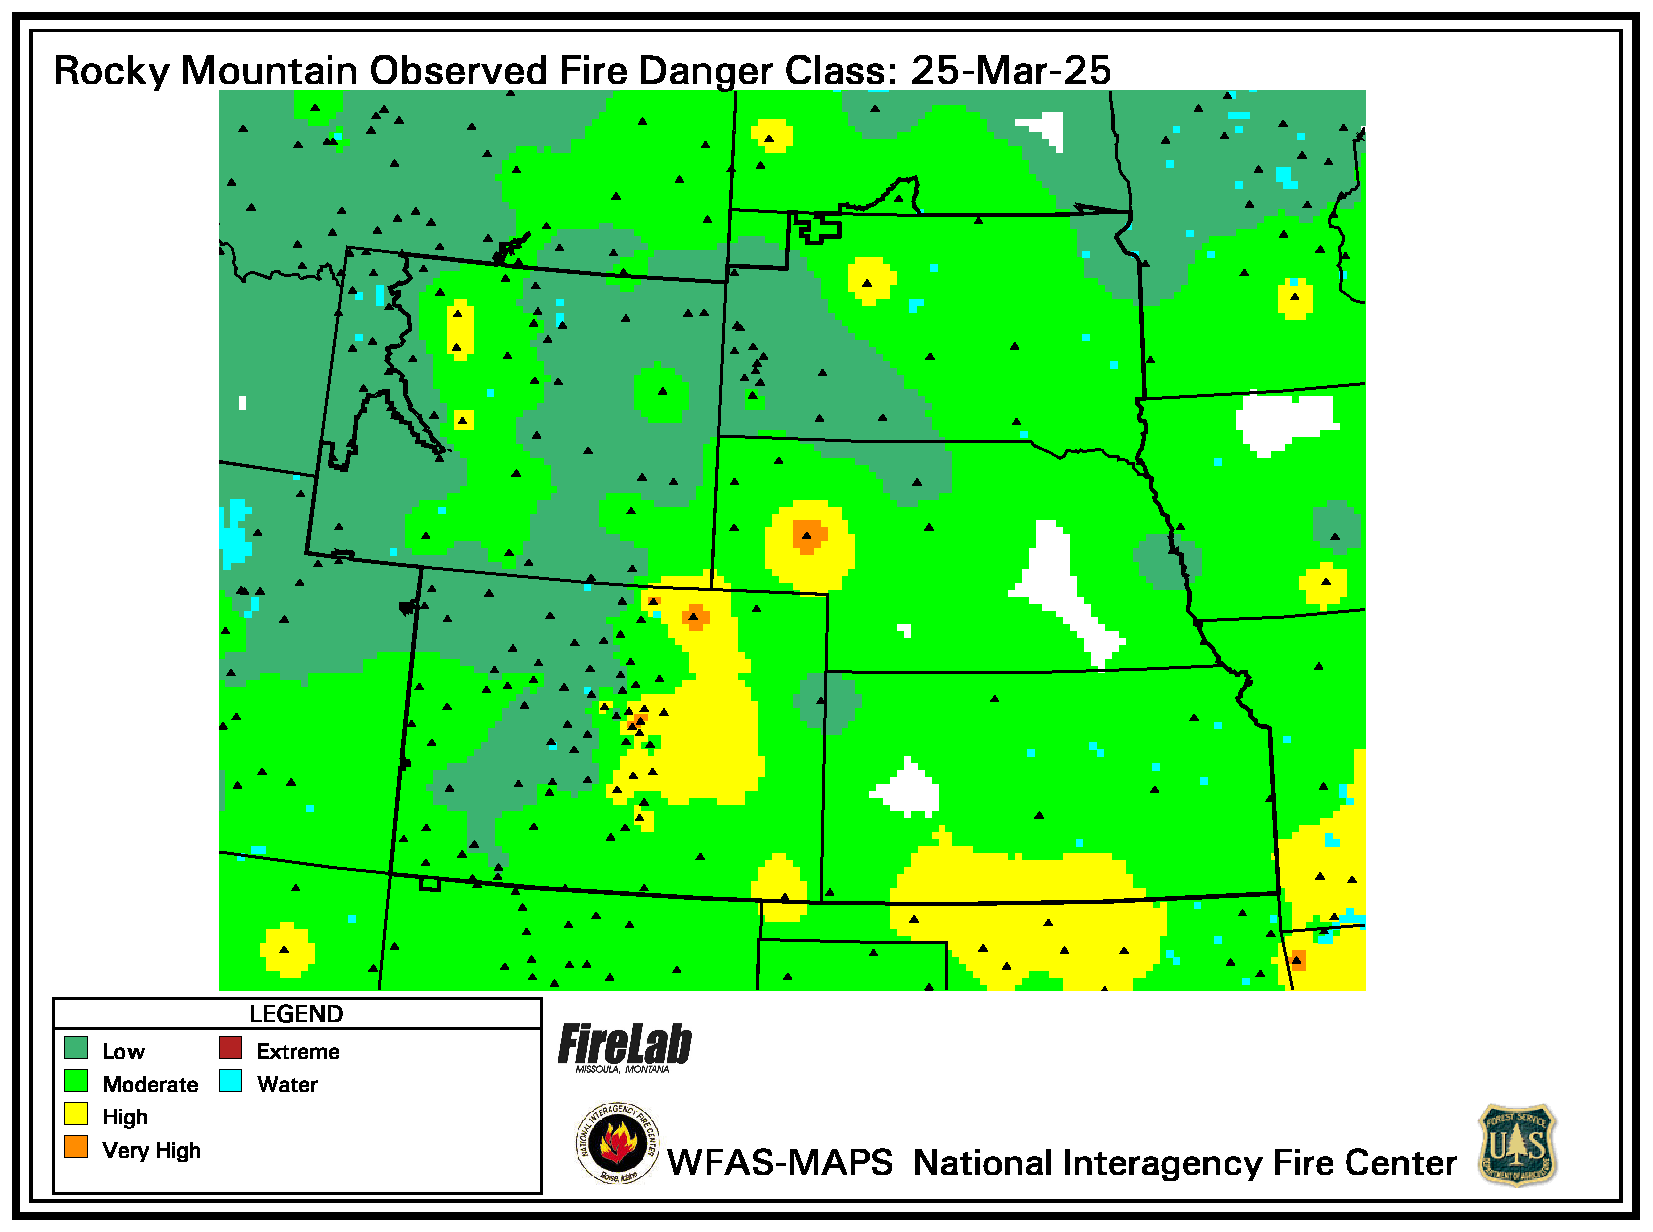
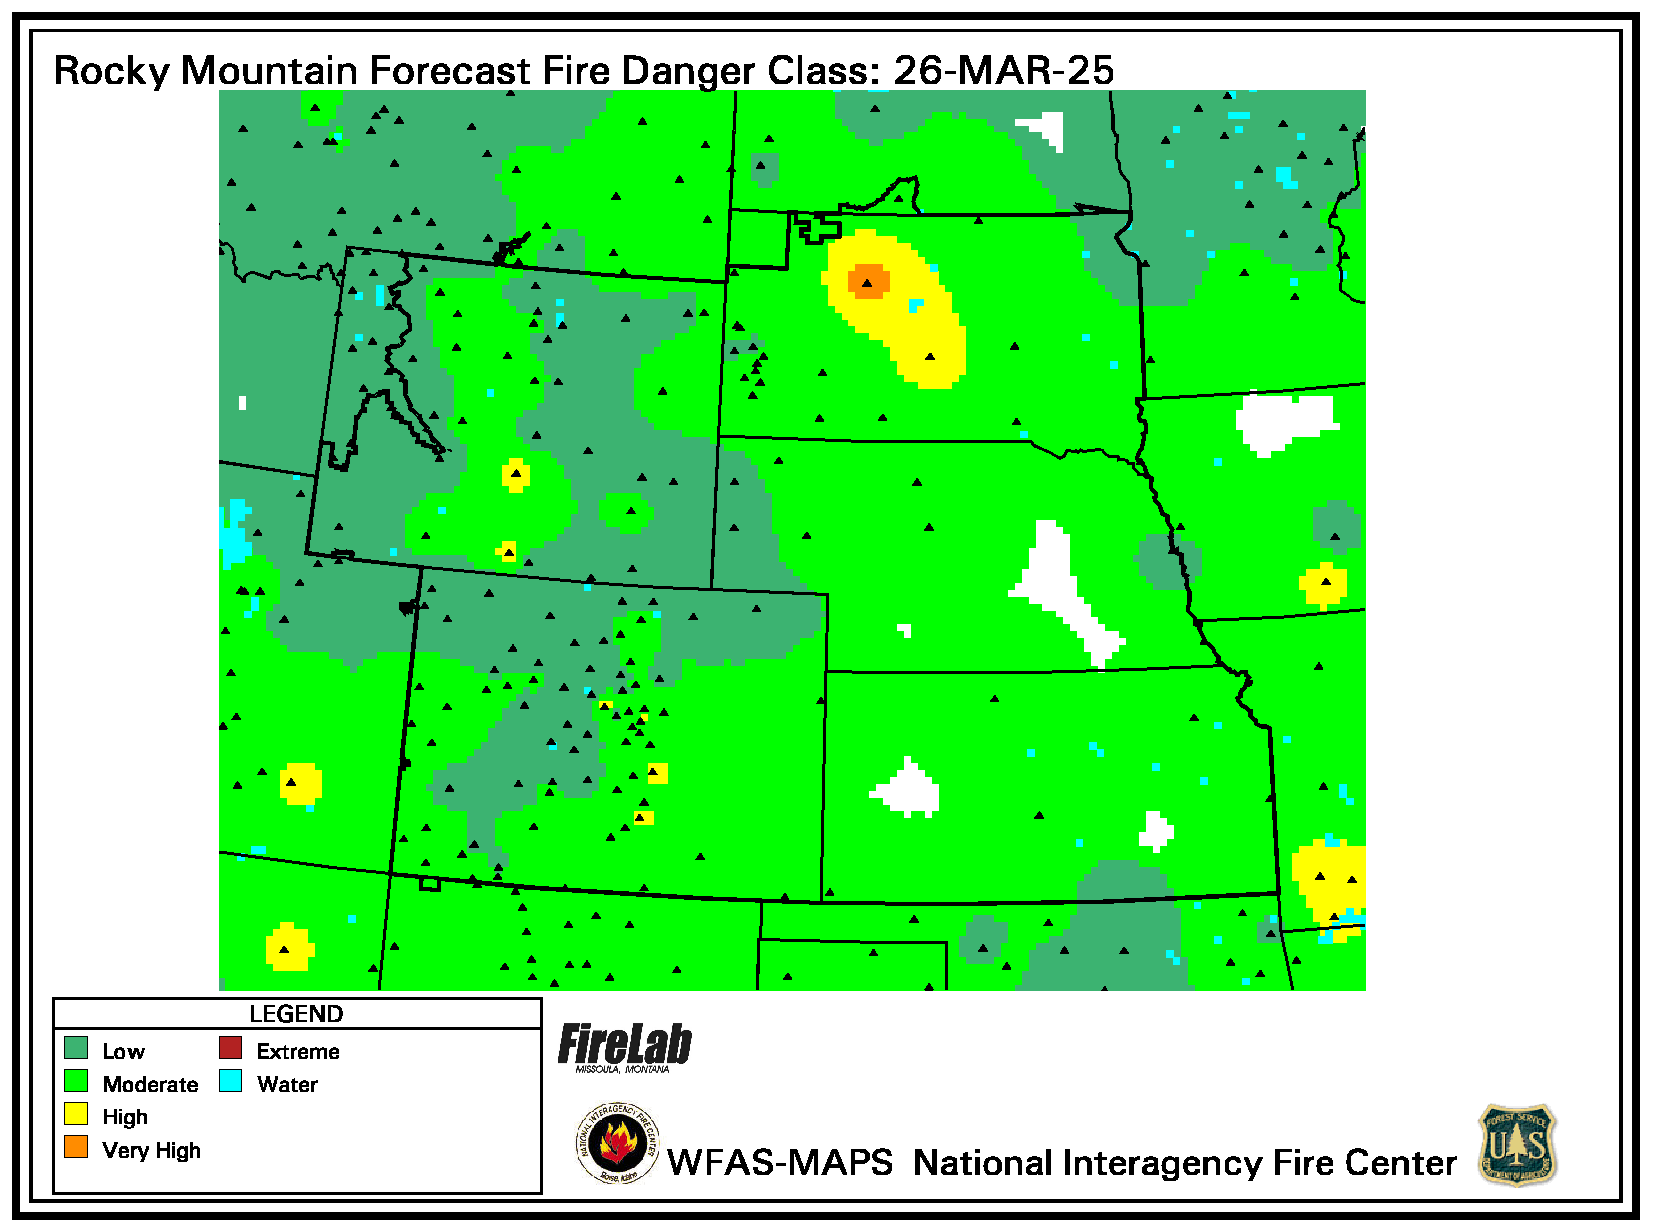
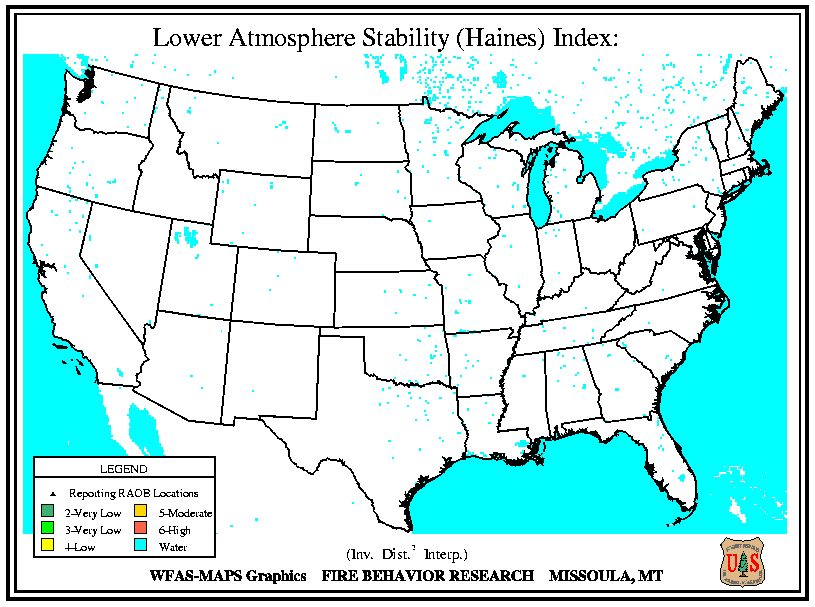
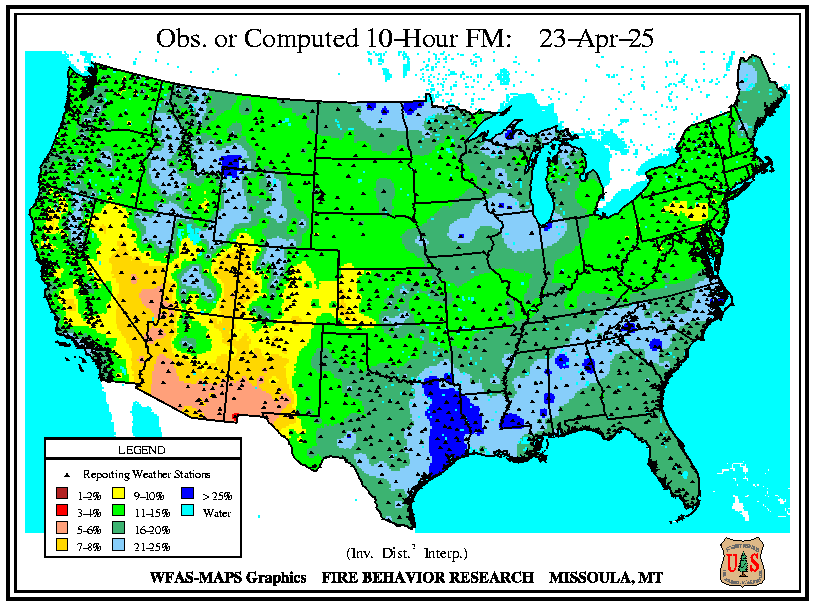
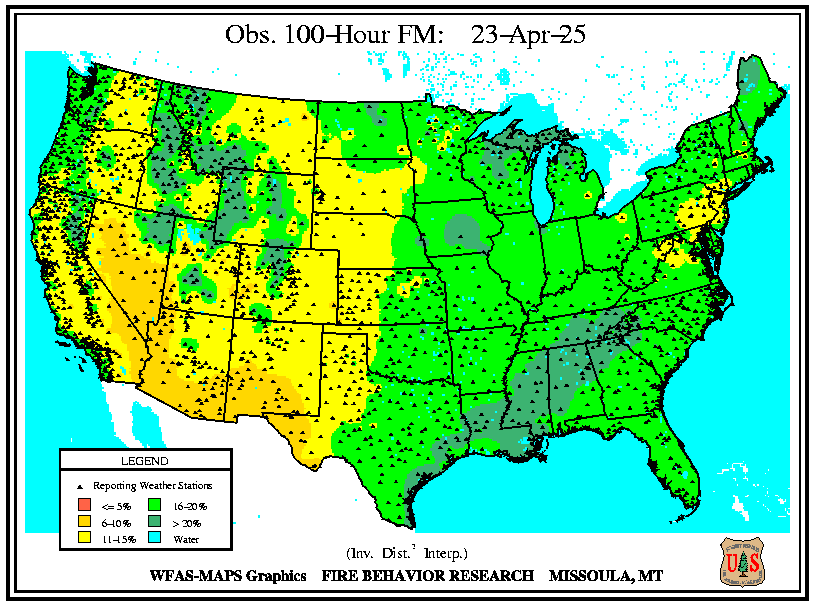
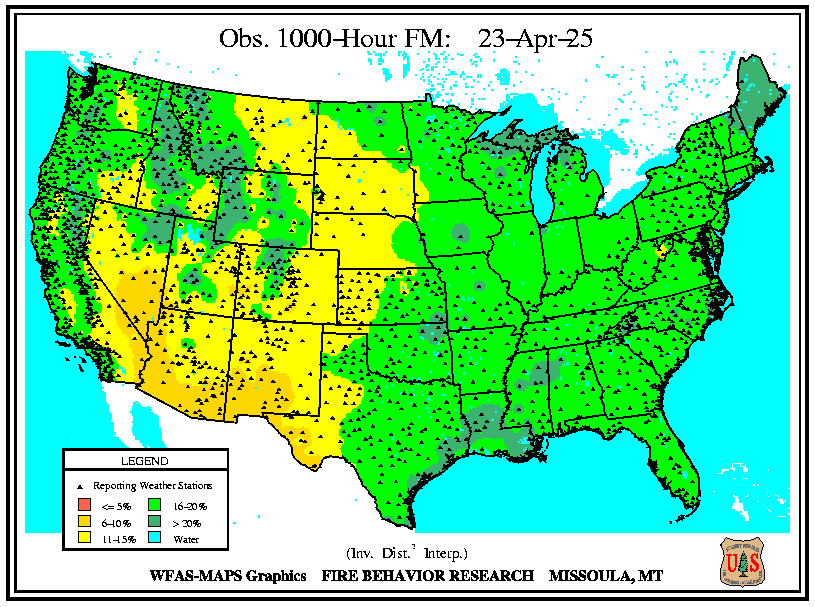
USFS Fire Danger Graphics and Fuels
|
|
|
|
 |
 |
 |
|
|
|
|
|
 |
 |
 |
 |
|
|
|
|
|
 |
 |
 |
 |
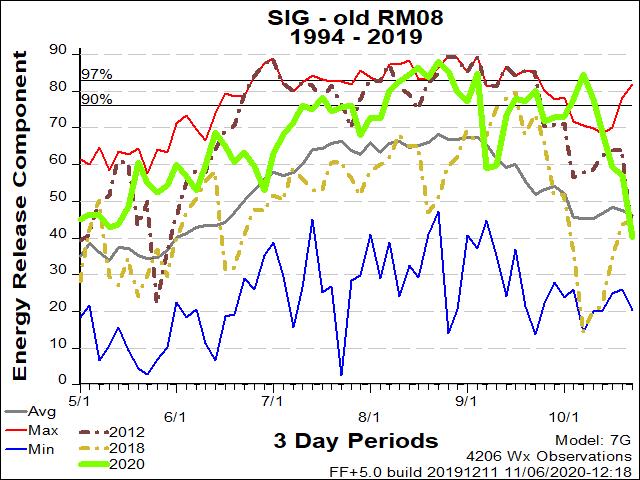
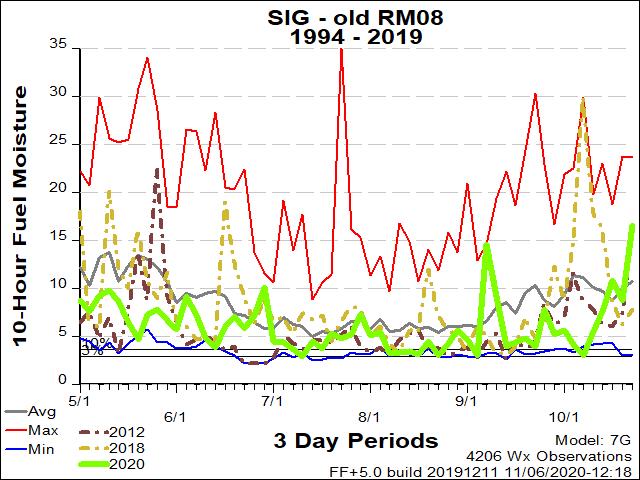
| Rocky Mountain Sec. 8 ERC Fuels Graph |
|
|
 |
 |
 |
Return to NWS Riverton Homepage
 |
Building a Weather-Ready Nation |


