Event Summary
|
Multiple rounds of locally heavy rain impacted portions of the NWS Charleston forecast area from Friday, August 25th until late on Tuesday, August 29th. The initial round of heavy rain was from a mesocale convective system (MCS) that moved through during the Friday morning hours. Following its passage, locally heavy rain would continue in spots during the day on Friday, and then once again Saturday afternoon/evening courtesy of slow moving showers and thunderstorms that were associated with a meandering stationary boundary. After a brief reprieve, additional rounds of extremely slow moving showers/storms affected portions of the forecast area Sunday evening into Tuesday evening as a stagnant pressure trough remained across the region and would serve as the focusing mechanism for locally heavy rainfall and resulting flash flooding. The most significant flash flooding of the event occurred on Monday morning in locations just south of Charleston where a narrow swath of 3-5"+ of rain fell in a 3-6 hour period. Some of these same locations received 2-3"+ of rain less than two days prior on Saturday evening as slow moving and heaving showers trained over the same area. Please click on the tabs below for more detailed information about this event. Please note that all images/loops can be expanded by clicking on them. |
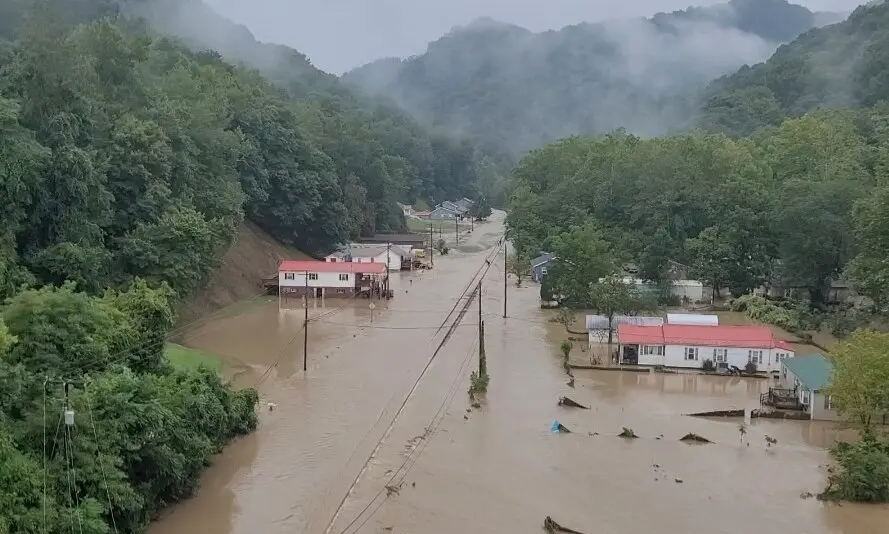
Flooding in Chesapeake, WV on August 28th Photo Courtesy of Bob Aaron/VCHS-TV via Associated Press |
Friday Overview and Corresponding Data
|
The initial round of heavy rain on Friday was from a mesocale convective system (MCS) that moved north to south across the forecast area during the morning hours from approximately 3 to 11 AM. It produced some tree damage in spots as it crossed with high wind gusts, along with locally heavy rain of 1-2"+ that resulted in a few high water reports. More issues would arise late morning into the afternoon as slow moving thunderstorms developed ahead of a southward approaching cold front that would later become stationary, dropping an additional 1-1.5"+ in some locations that were already affected earlier in the morning, causing some high water reports near Charleston, WV in Kanawha/Putnam counties. Localized amounts of 2-3"+ were observed by day's end on Friday. |
Radar loop courtesy of Iowa Environmental Mesonet (IEM) |
 |
 |
 |
|
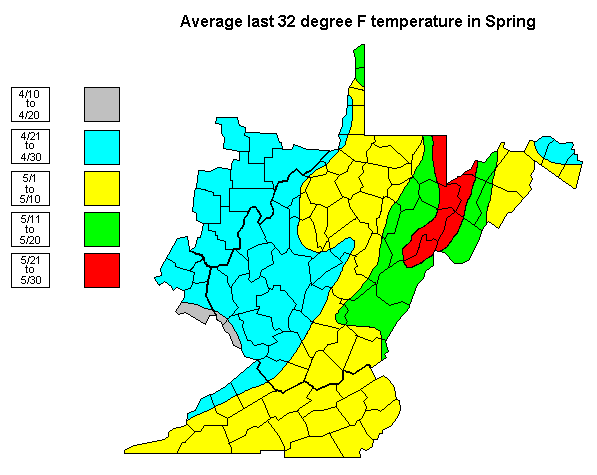
The above image shows the date on or after which the last 32 degree temperature will occur in 50 percent of the years. In other words, this map represents the average date of the start of the growing season. |
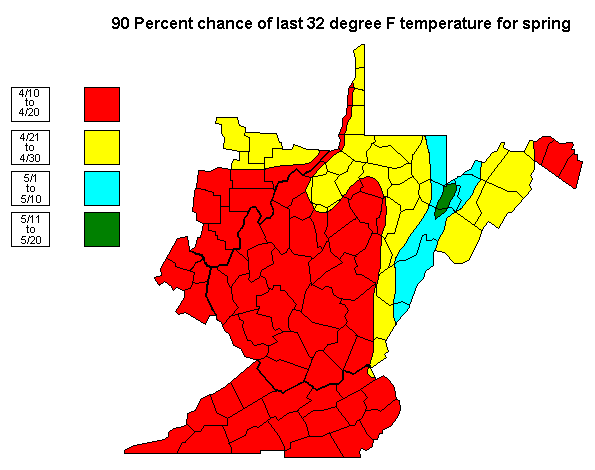
The above image shows the date on or after which the last 32 degree temperature will occur in 90 percent of the years. In other words, the last freezing temperature almost always occurs on or after these dates. |
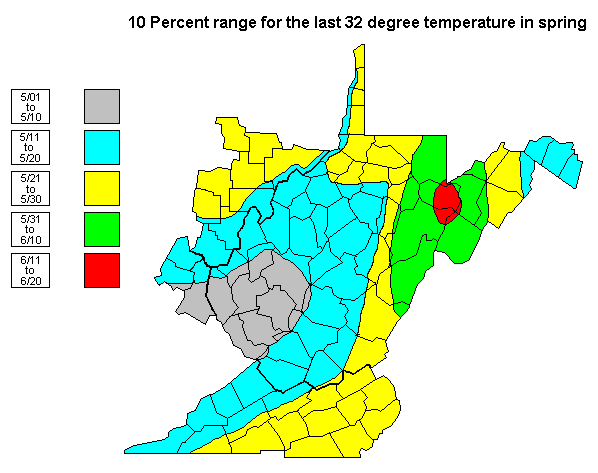
The above image shows the date on or after which the last 32 degree temperature will occur in 10 percent of the years. This would represent an unusually late start to the growing season across the region. |
Saturday Overview and Corresponding Data
.gif) |
.gif) |
.gif) |
|
February 27th Regional Radar Loop Radar loop courtesy of Iowa Environmental Mesonet (IEM) |
February 27th Local Radar Loop Radar loop courtesy of Iowa Environmental Mesonet (IEM) |
February 27th Local Radar Loop (w/ Convective Warnings Overlaid) Radar loop courtesy of Iowa Environmental Mesonet (IEM) |
Monday Overview and Corresponding Data
 |
 |
|
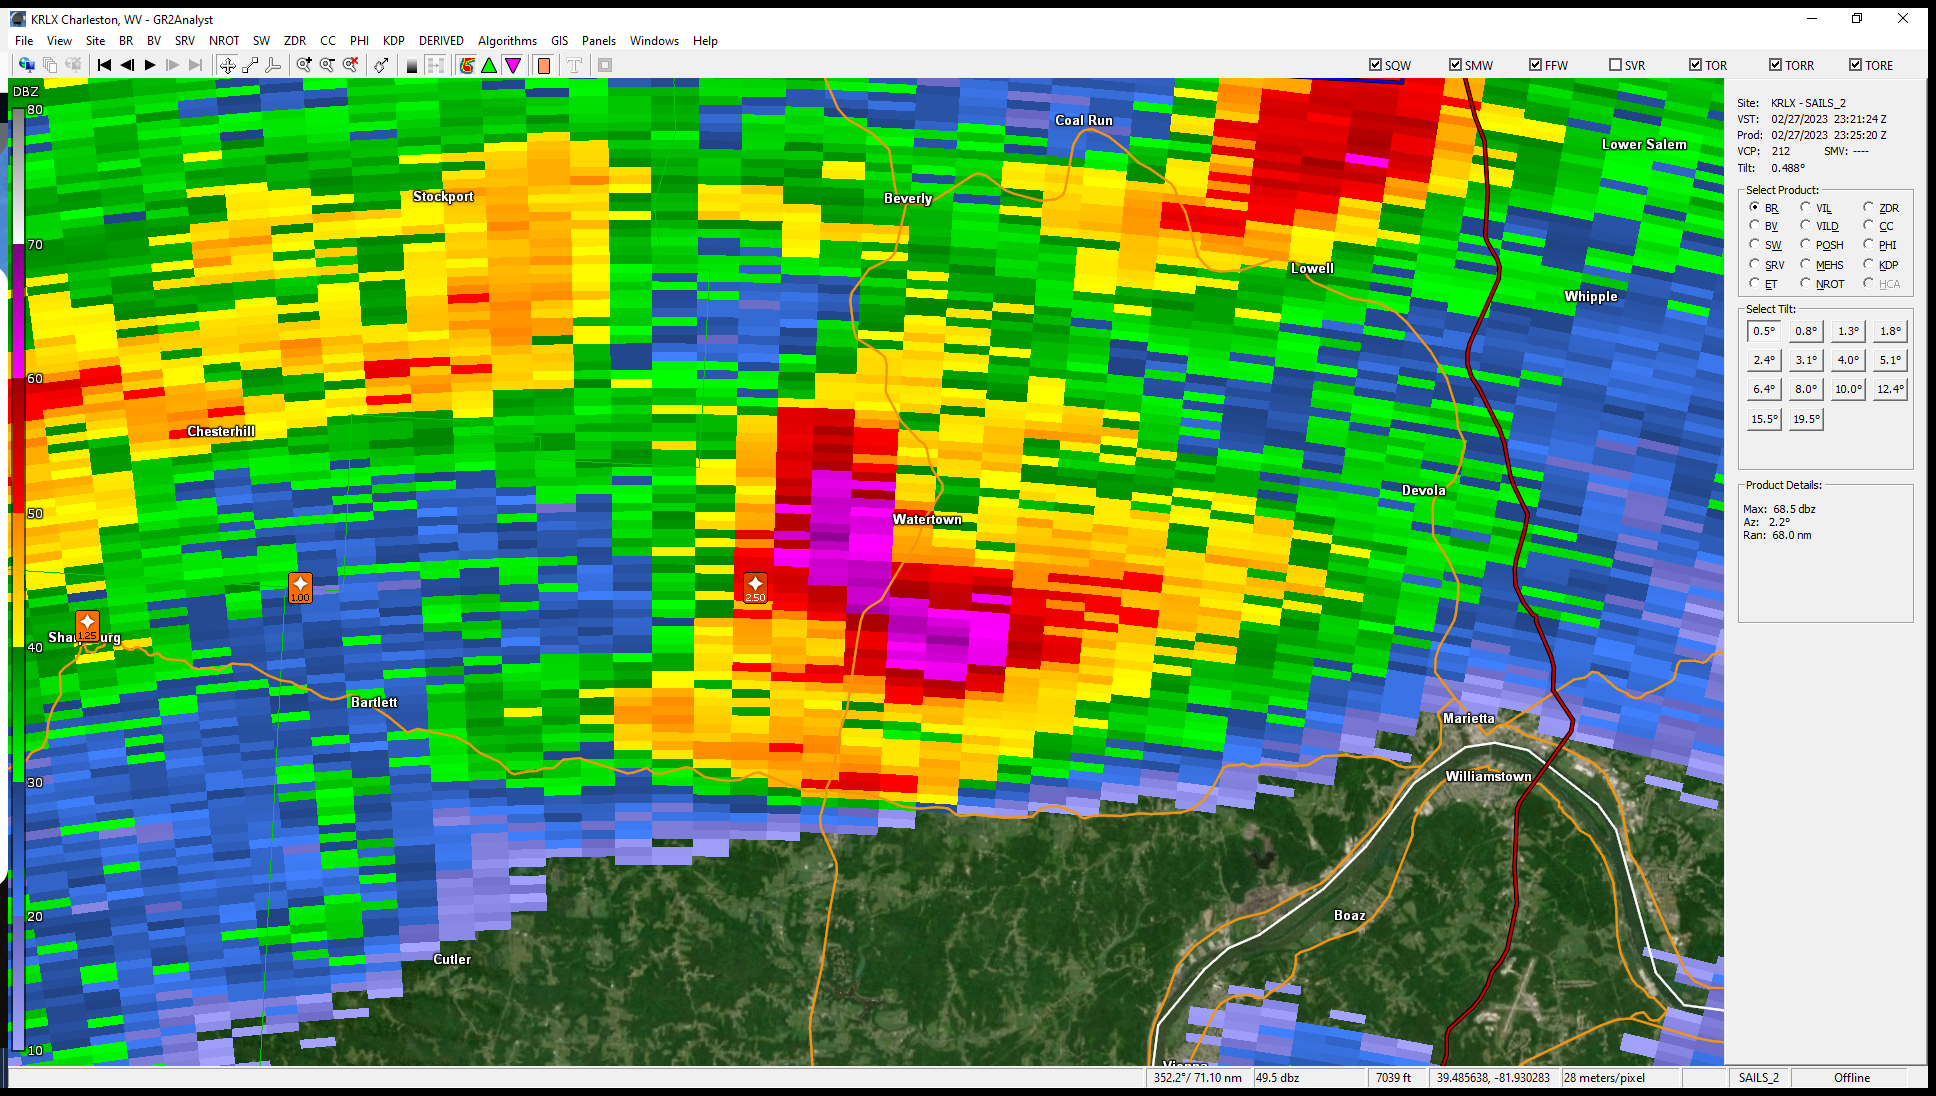
0.5 Degree Base Reflectivity from KRLX at 6:25 PM. Maximum reflectivity in this image is ~ 68 dBZ! Radar image courtesy of GR2Analyst |
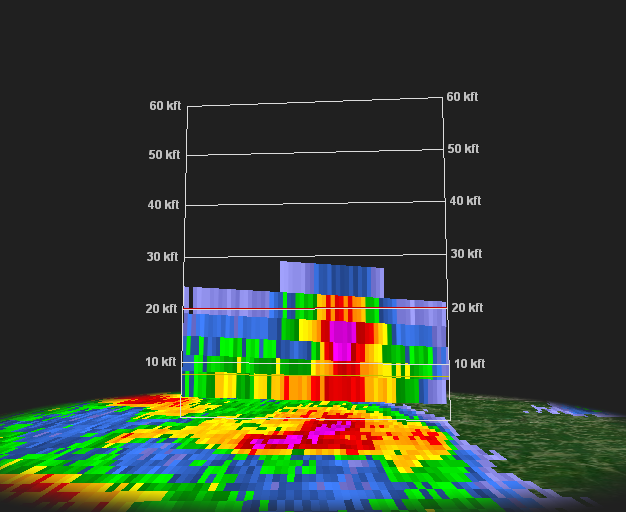
A Cross-Section of the Base Reflectivity Image at 6:25 PM (left). This Cross-Section runs North (Left) to South (Right) and shows > 50 dBZ above 20,000 ft AGL (above ground level). The freezing level at this time was ~ 9,000 ft AGL. Cross-Section image courtesy of GR2Analyst |
Tuesday Overview and Corresponding Data
 |
 |
 |
|
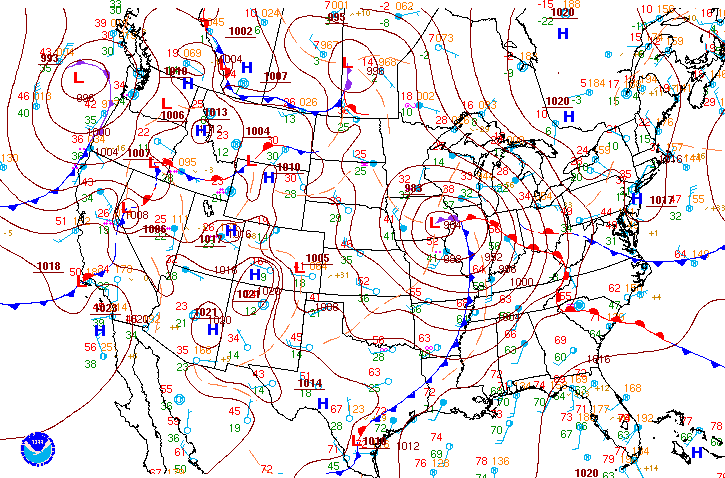
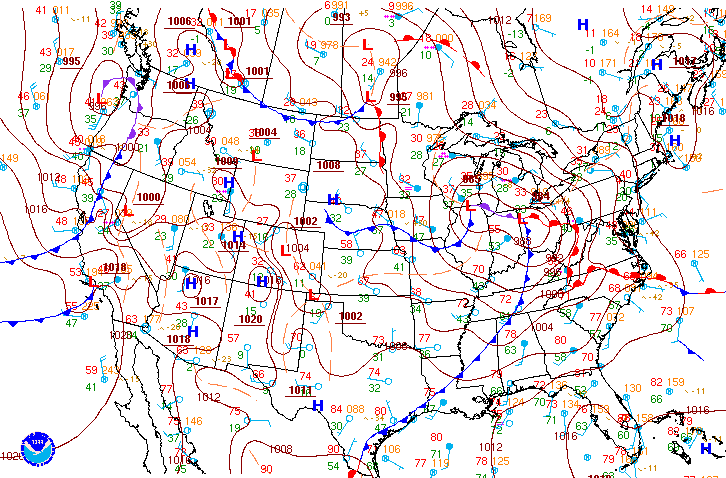
10 AM February 27th Surface Analysis Image courtesy of WPC (Weather Prediction Center) |
4 PM February 27th Surface Analysis Image courtesy of WPC (Weather Prediction Center) |
7 PM February 27th Surface Analysis Image courtesy of WPC (Weather Prediction Center) |
 |
 |
 |
|
10 AM February 27th 500mb Chart Image courtesy of the Storm Prediction Center |
4 PM February 27th 500mb Chart Image courtesy of the Storm Prediction Center |
7 PM February 27th 500mb Chart Image courtesy of the Storm Prediction Center |
 |
 |
 |
|
10 AM February 27th 0-6 km Bulk Shear Image courtesy of the Storm Prediction Center |
4 PM February 27th 0-6 km Bulk Shear Image courtesy of the Storm Prediction Center |
7 PM February 27th 0-6 km Bulk Shear Image courtesy of the Storm Prediction Center |
 |
 |
 |
|
10 AM February 27th 100mb Mixed-Layer CAPE Image courtesy of the Storm Prediction Center |
4 PM February 27th 100mb Mixed-Layer CAPE Image courtesy of the Storm Prediction Center |
7 PM February 27th 100mb Mixed-Layer CAPE Image courtesy of the Storm Prediction Center |
 |
Media use of NWS Web News Stories is encouraged! Please acknowledge the NWS as the source of any news information accessed from this site. |
|


.gif)