Historic Winter Storm Affects the Deep South January 21-25, 2025
A record breaking Winter Storm affected the Deep South in late January of 2025. This winter storm brought the most significant snowfall accumulations in decades to many locations across the Gulf Coast. While the Tallahassee forecast area did not see amounts as high as what occurred to our west (see NWS Mobile Write Up), amounts were still enough to cause widespread significant winter weather hazards to develop and persist for several days across the region.
 |
| Figure 1. Satellite imagery animation spanning the first sunrise after the winter storm departed the area. Widespread snowfall can be see across the Panhandle, southeast Alabama, and southern Georgia. The sharp gradient of snowfall on satellite imagery over the Big Bend was where the freezing line setup for the event. |
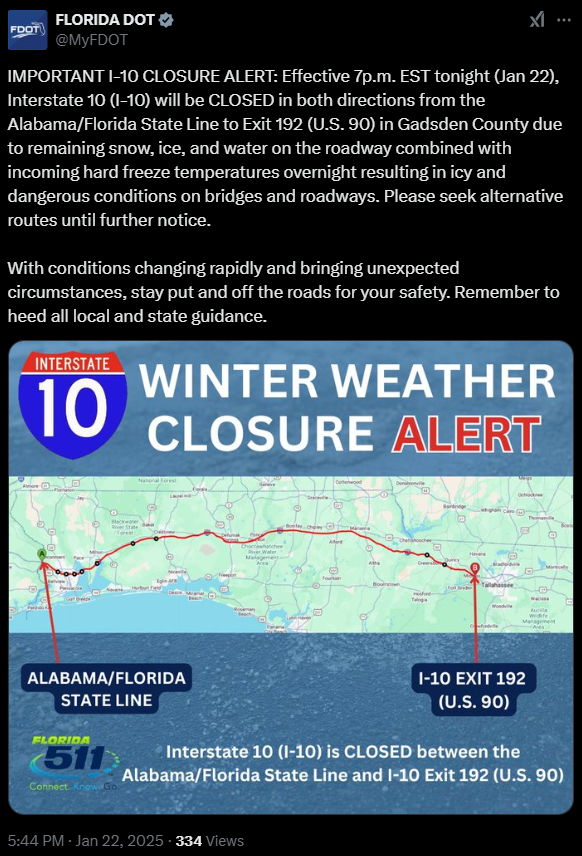 |
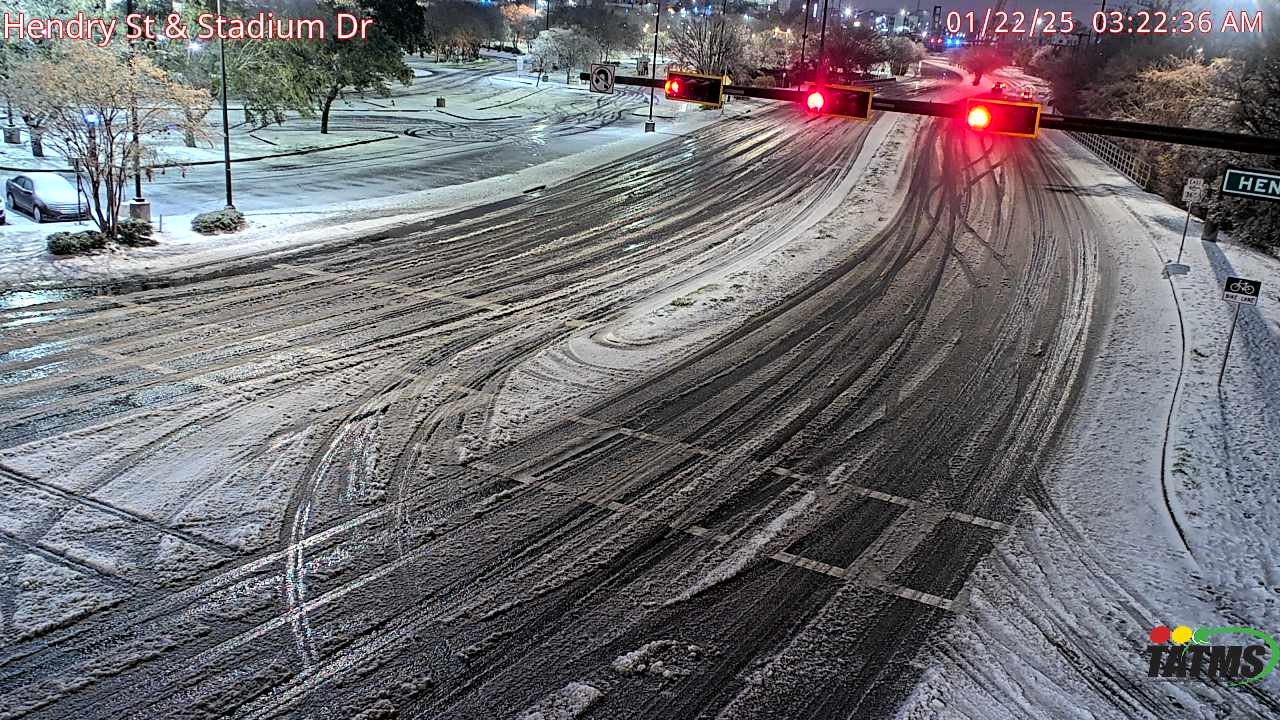
| Figure 2. The nearly 200 miles of Interstate 10 closure the day after the snow fell. While temperatures warmed up and melted snow the day after the snow, roads still remained wet from melted snow and frigid overnight temperatures well below freezing lead to widespread black ice developing on area roads. |
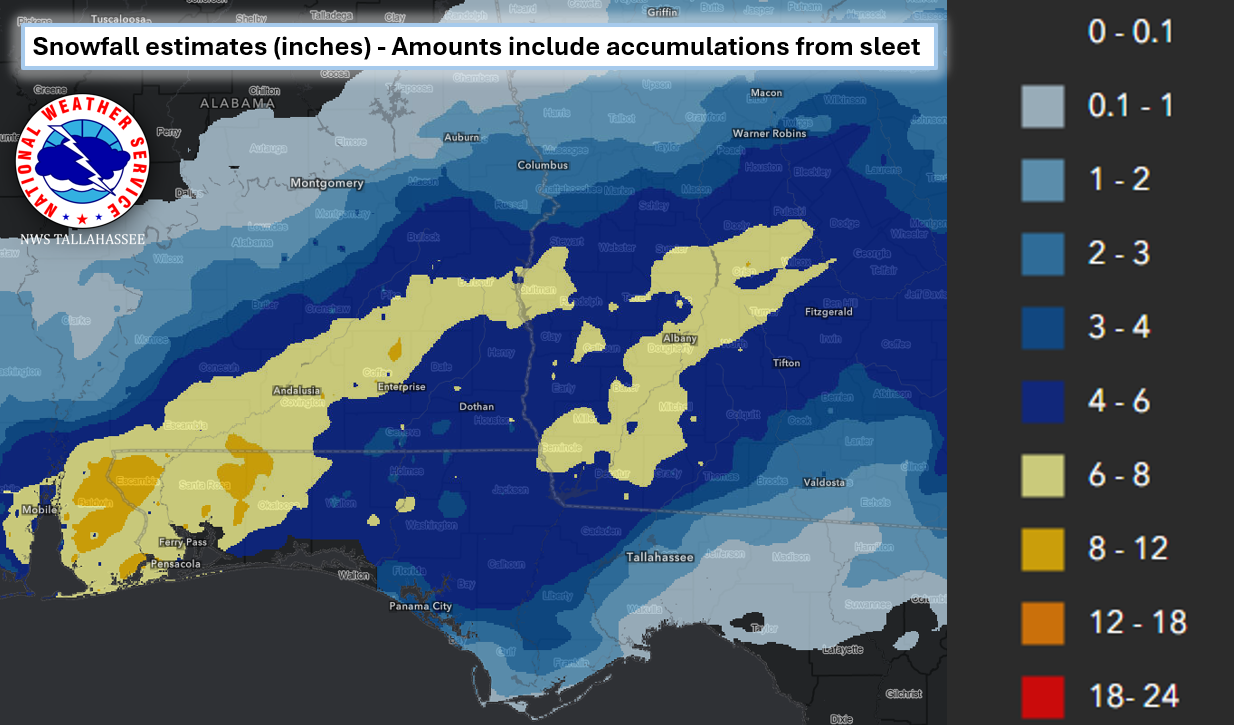 |
| Figure 3. Snowfall Amounts across the Deep South. The heaviest totals fell across the Panhandle and southern Alabama, but a pocket of heavier snow fell across southwest Georgia as well. Across the Big Bend east and south of Tallahassee/Valdosta amounts were less. These areas remained above freezing either at the surface, or aloft, which limited snowfall values in these areas. |
A 500mb trough began diving south into the US along the Rockies on Friday, January 17th, 2025. This trough facilitated the progression of a cold front through the Southeast on Saturday, January 18th, and Sunday, January 19th. This initial system brought precursor rainfall, ranging from 0.5 to 1.5 inches across Alabama and Georgia counties to heavier amounts of 1 to 6 inches across the southeastern Florida Big Bend. Significantly colder air followed the frontal passage; aided by strong cold air advection on the backside of the system and the influence of a sprawling 1036 mb surface high pressure system centered over the SE Kansas/NE Oklahoma. High temperatures on Monday, January 20th, only reached the 40s across much of the area.
Meanwhile, a potent shortwave trough, embedded within the larger 500mb trough, tracked south over Utah before amplifying and moving over the Four Corners region on the 20th. This upper-level disturbance reached the northwestern Gulf of Mexico by the evening of Tuesday the 21st, subsequently tracking across the Tallahassee NWS forecast area Tuesday night into Wednesday morning, January 22nd. Concurrently, a strong arctic surface high pressure system, initially analyzed near 1046 mb over Montana, tracked southeastward into the Central Plains. By the time the shortwave approached the Gulf Coast, this high was centered near Oklahoma, maintaining a strong central pressure around 1042 mb. This effectively locked a shallow cold air mass near the surface with the persistent northeasterly flow on the eastern edge of this surface high. As the shortwave approached, enhanced lift developed due to isentropic ascent (warm air advection through what meteorologists call a "warm nose") overrunning the shallow cold air associated with a developing frontal zone in the northwestern Gulf. This process was evident in diagnostics like the 700 mb frontogenesis plots. The combination of sufficient moisture drawn from the Gulf of Mexico, strong lift, and sub-freezing surface temperatures produced notable snowfall across much of the northern Gulf coast, primarily where the entire atmospheric column remained below freezing.
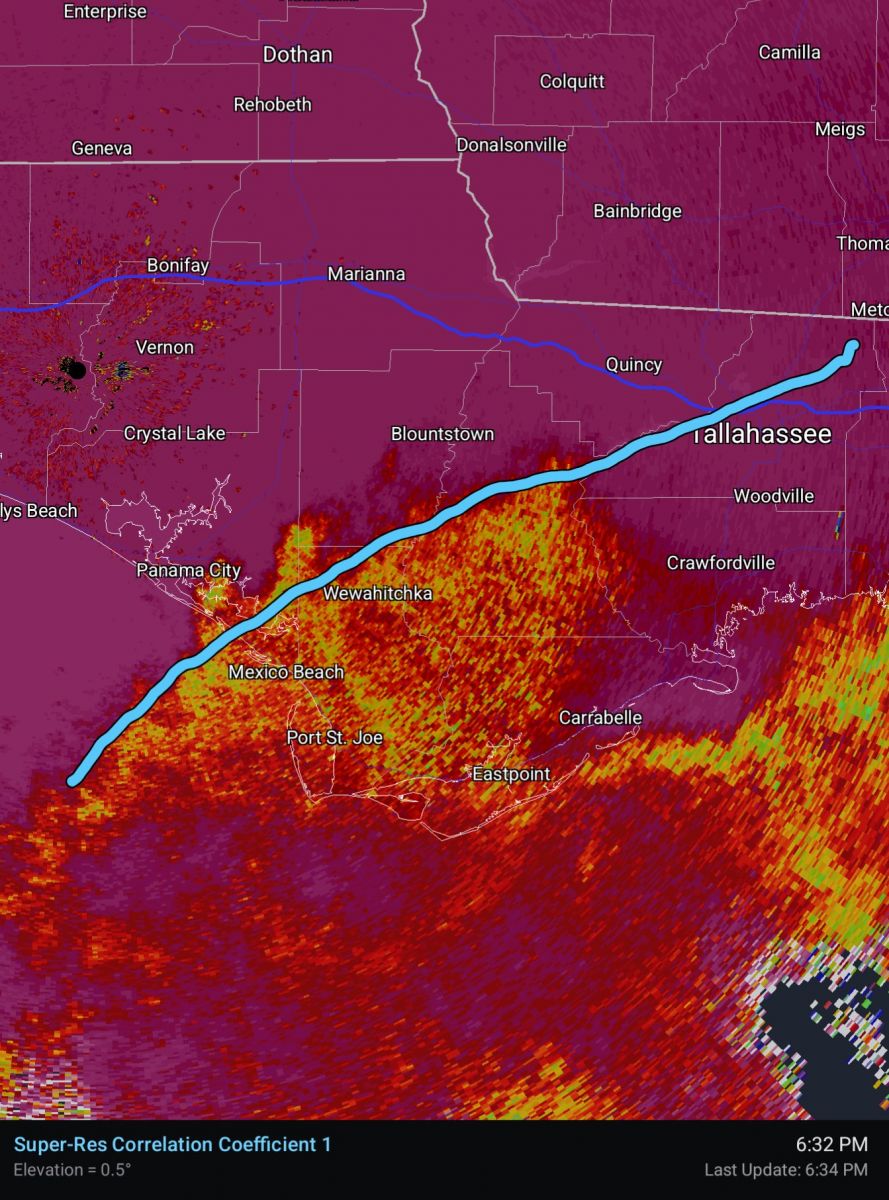
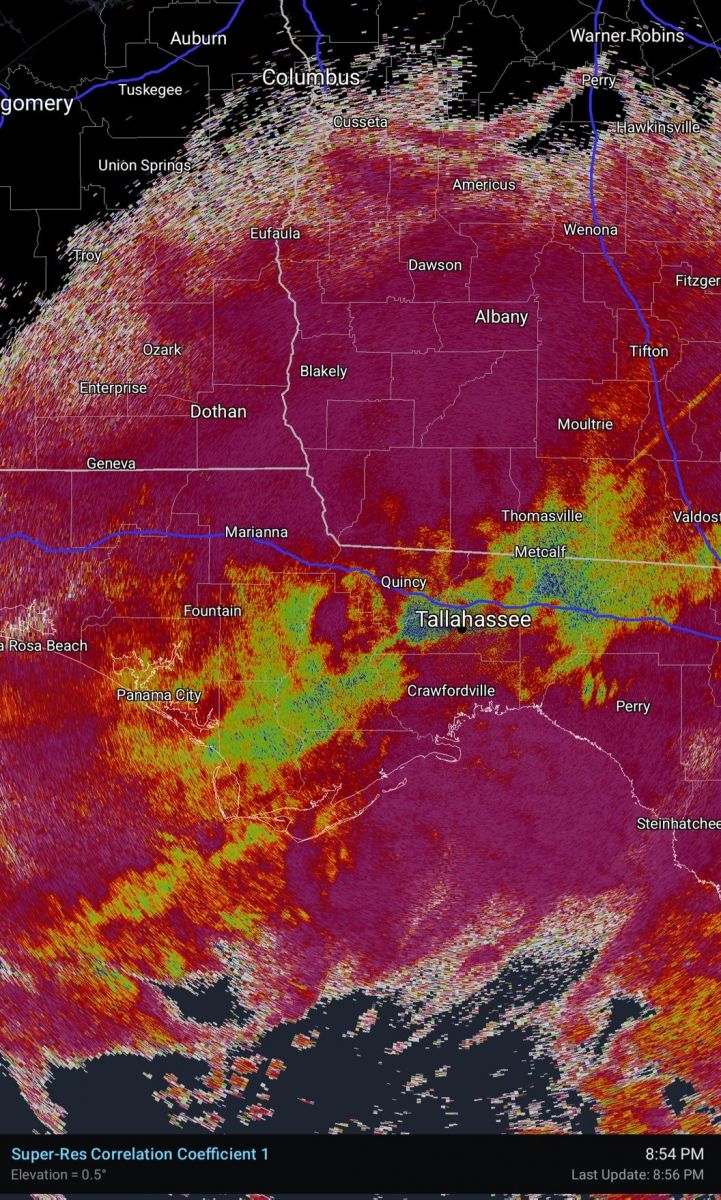
One of the primary forecast challenges for this event was determining how the elevated warm layer ('warm nose') would affect the location of the critical transition line between all snow and the more impactful precipitation types like freezing rain and sleet would occur. In the lead-up to the event, model guidance and past experience with Gulf Coast winter storms strongly suggested this transition zone would set up somewhere across the Florida Big Bend. This was heavily communicated in the lead-up to the event, as shown in Figure 4. As the event unfolded, many locations across the Panhandle quickly switched over to snow in the afternoon and early evening of the 21st, but as the 700mb frontogenesis intensified in the evening, it was evident that the warm nose was becoming better established and persisting. The correlation coefficient product in Figures 5 and 6. shows where this melting layer and mixed winter precipitation were occurring. South and east of that melting layer, all falling snow was melting. As surface temperatures continued dropping through the night across Wakulla, Franklin, and Jefferson counties, freezing rain and sleet became more prevalent as snow falling through the warm nose melted and then either refroze into sleet or froze on contact with surfaces below freezing. Throughout the remainder of the night (seen in the 9pm ET image in Figure 7.) and until the final push of the system on the morning of the 22nd, the warm nose remained strong, and freezing rain and sleet continued across much of the Big Bend while snow fell across counties further north in Georgia and the Florida Panhandle.
 |
|
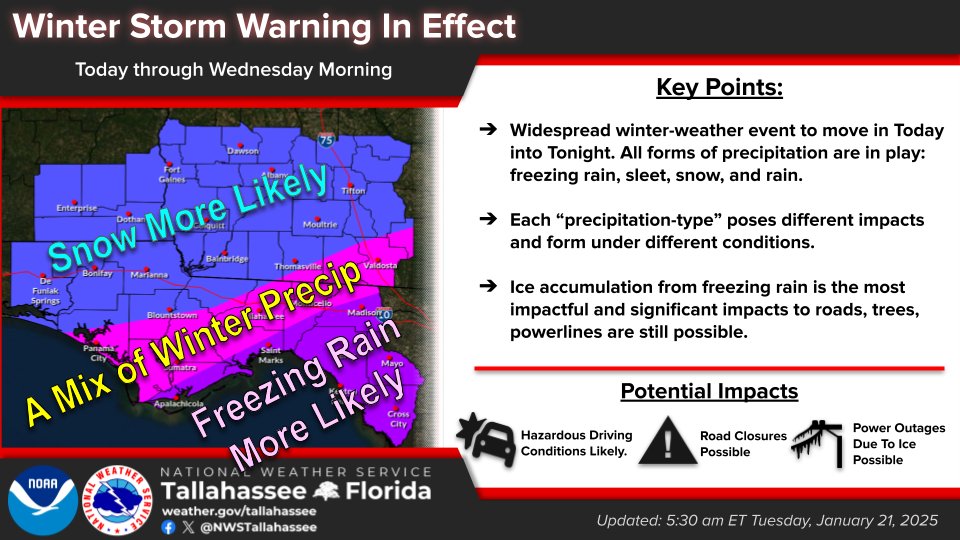
| Figure 4. Graphic issued by our office the morning, January 21, before snow would move in. Due to the nature of this system, not every location would see snow. For folks who missed out on snow the more impactful winter precipitation forms of sleet and freezing rain were more likely. |
 |
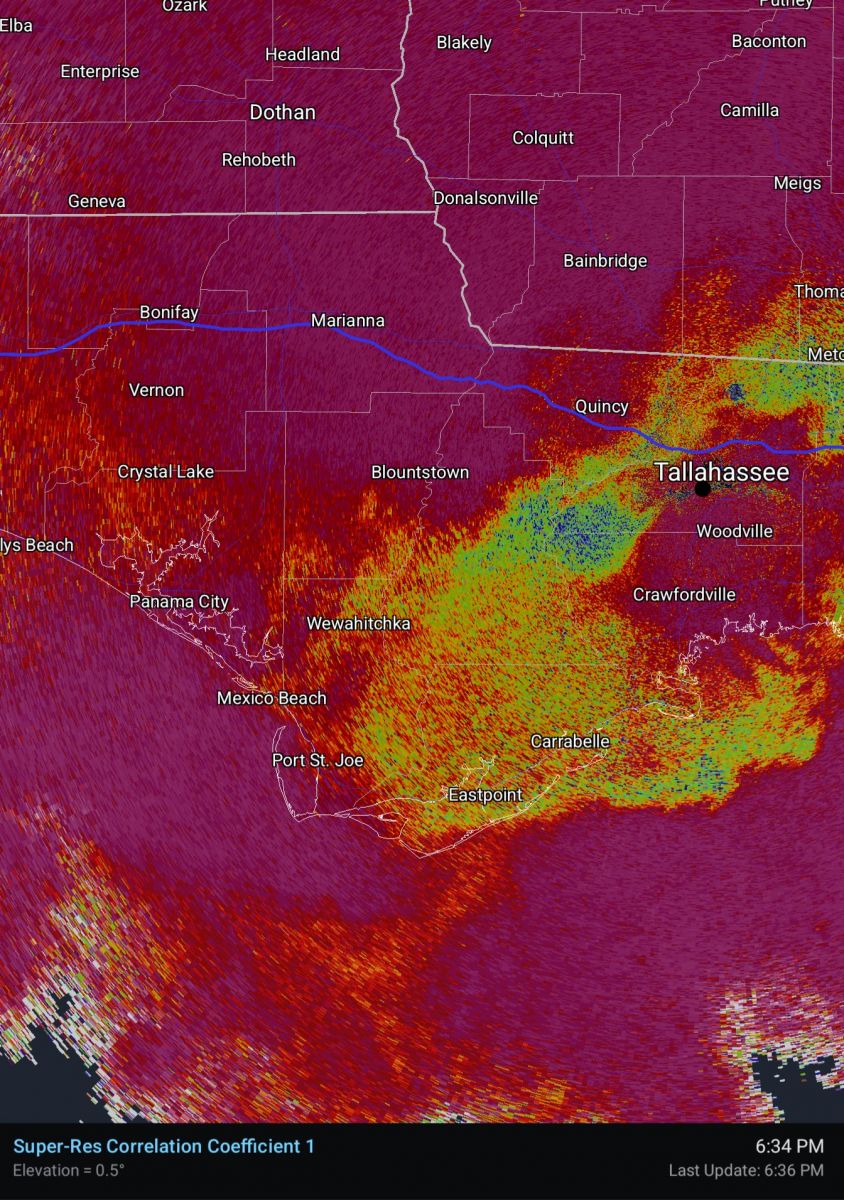 |
| Figure 5. and 6. Radar product, correlation coefficient, that meteorologists use to determine where the melting layer is. The blue line depicted on the left image shows approximately the edge of the snow/sleet line. The yellows and oranges indicate where the hydrometeors (rain/snow/ice) is not consistent/not-correlated. If the radar were seeing all rain, or all snow, the values shown in the image would be the red/pink shading. | |
 |
|
| Figure 7. By 9pm ET, the correlation melting layer had failed to transition further south as the warm nose strengthened. |
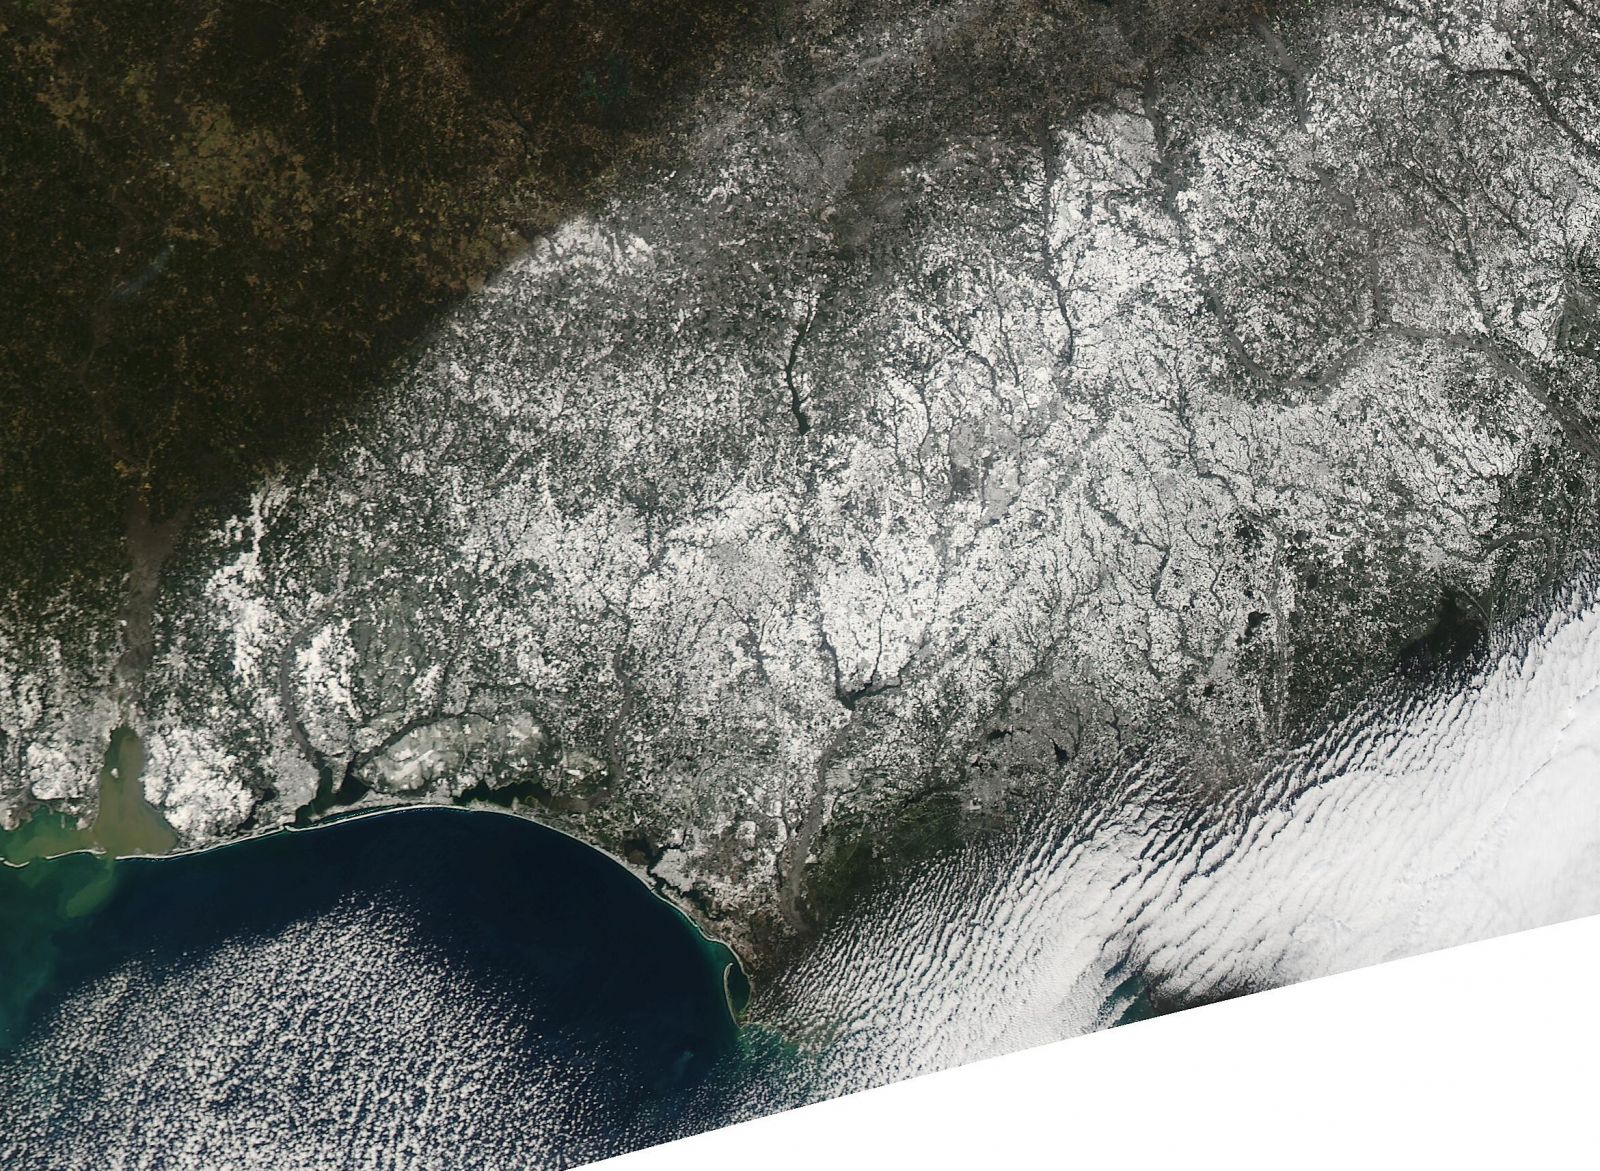 |
| Figure 8. Sun rises on a snow coverage landscape across the Gulf Coast |
 |
 |
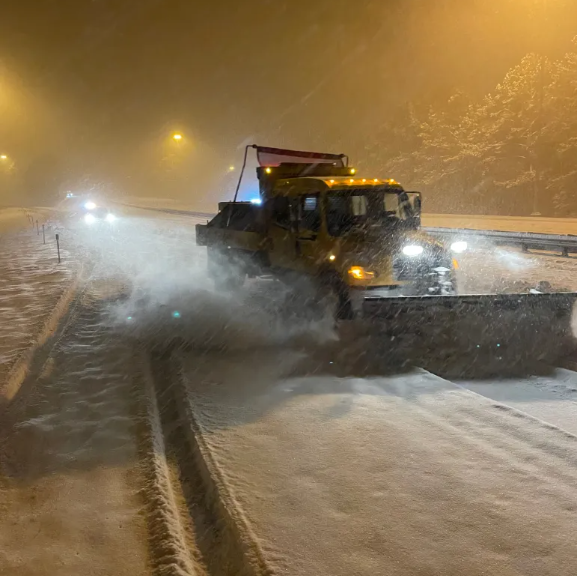 |
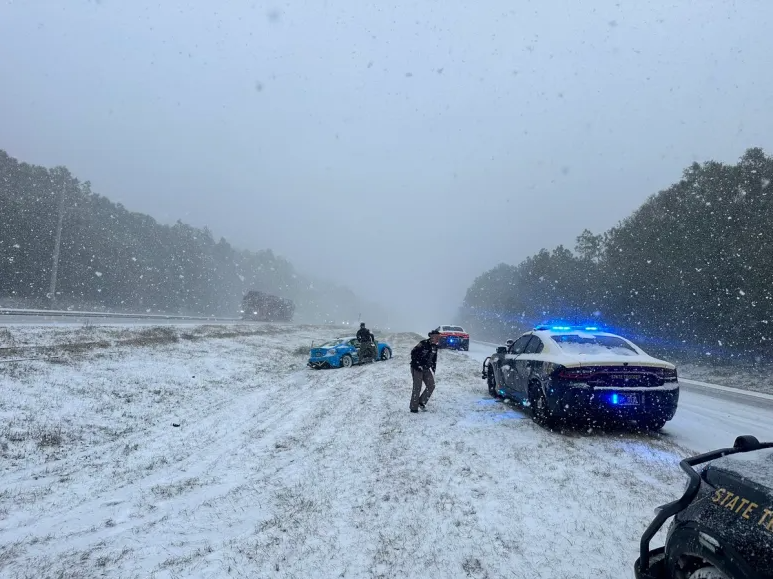
| Figure 9. Florida Highway Patrol Photo of Snow Impacts on Interstate - 10. | Figure 10. Jackson County Sheriff Photo | Figure 11. Florida Department of Transportation Photo |
 |
 |
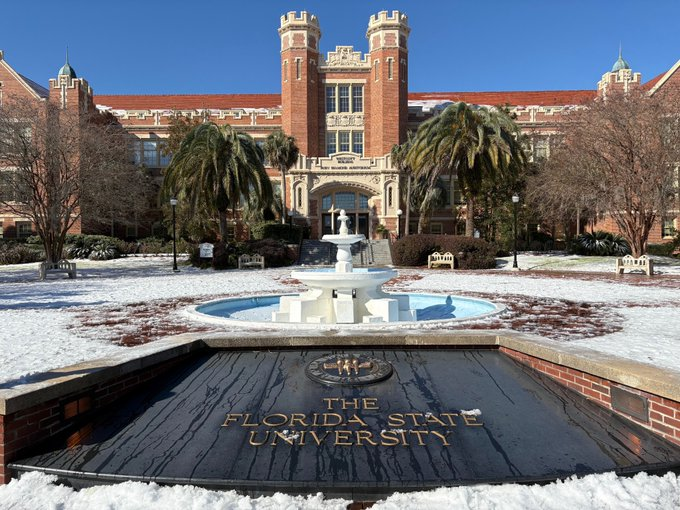 |
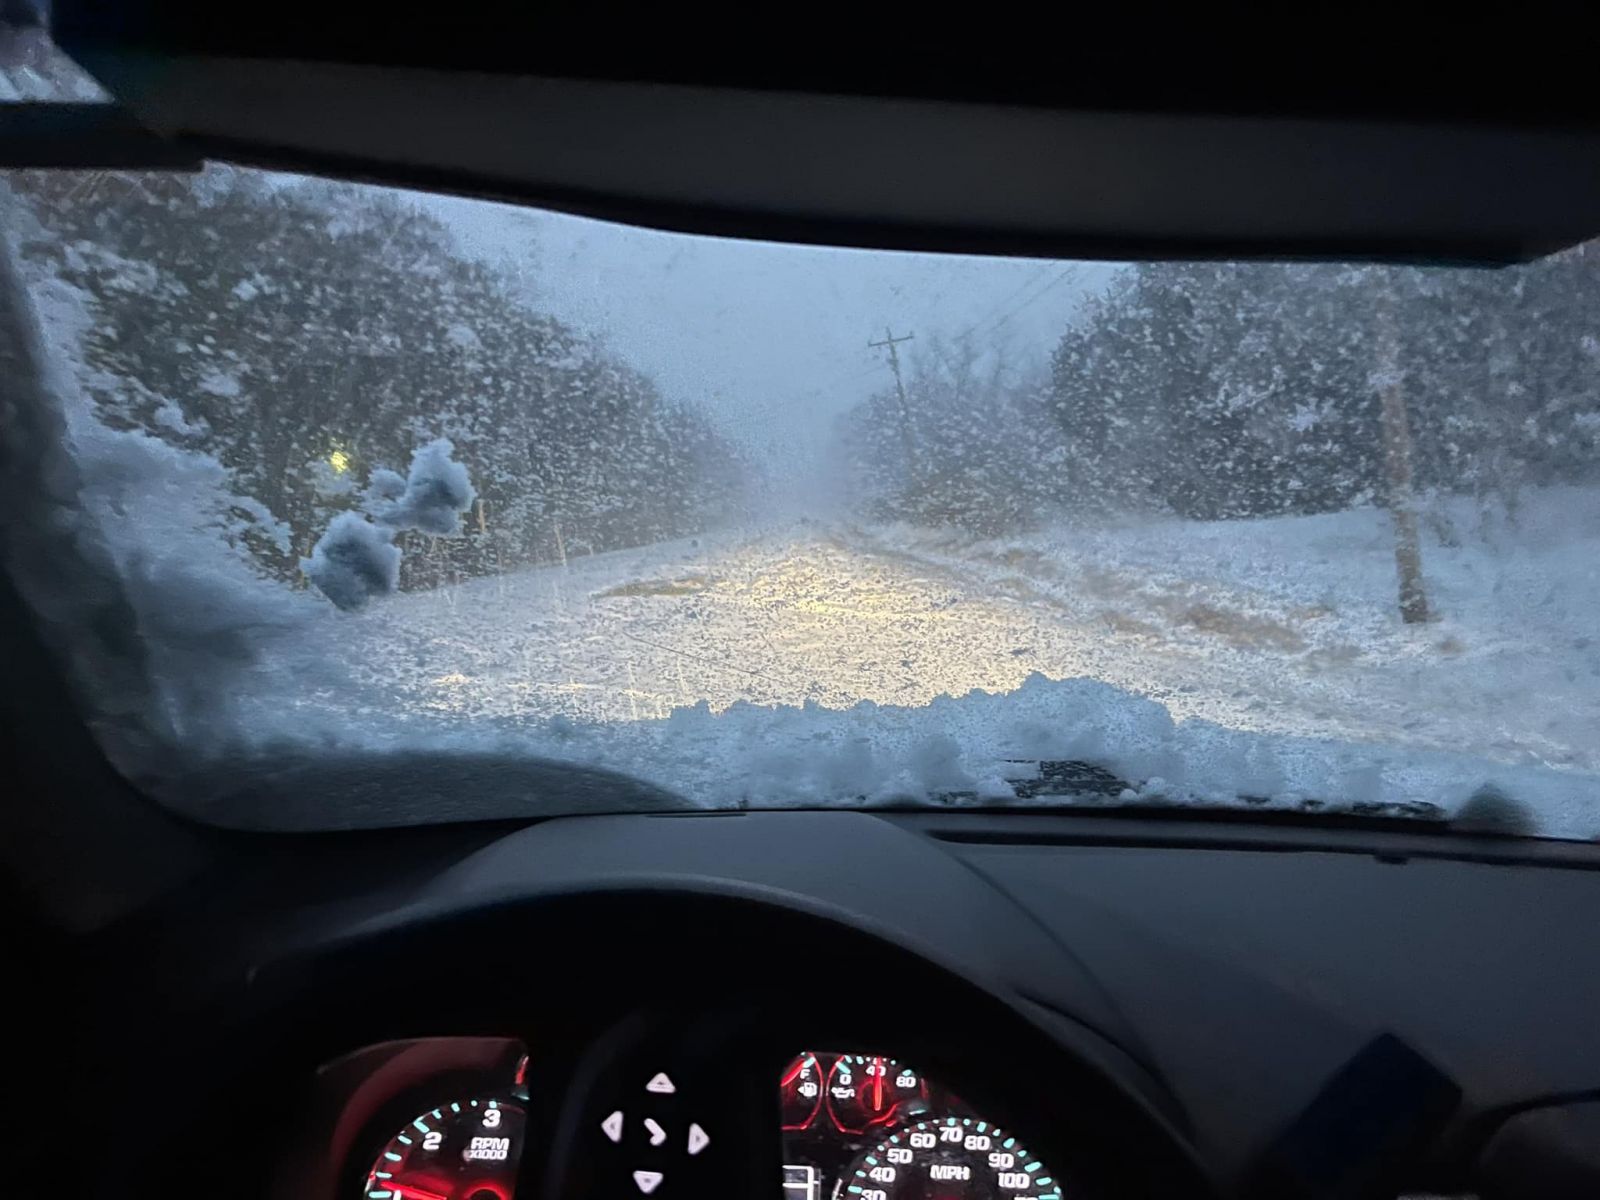
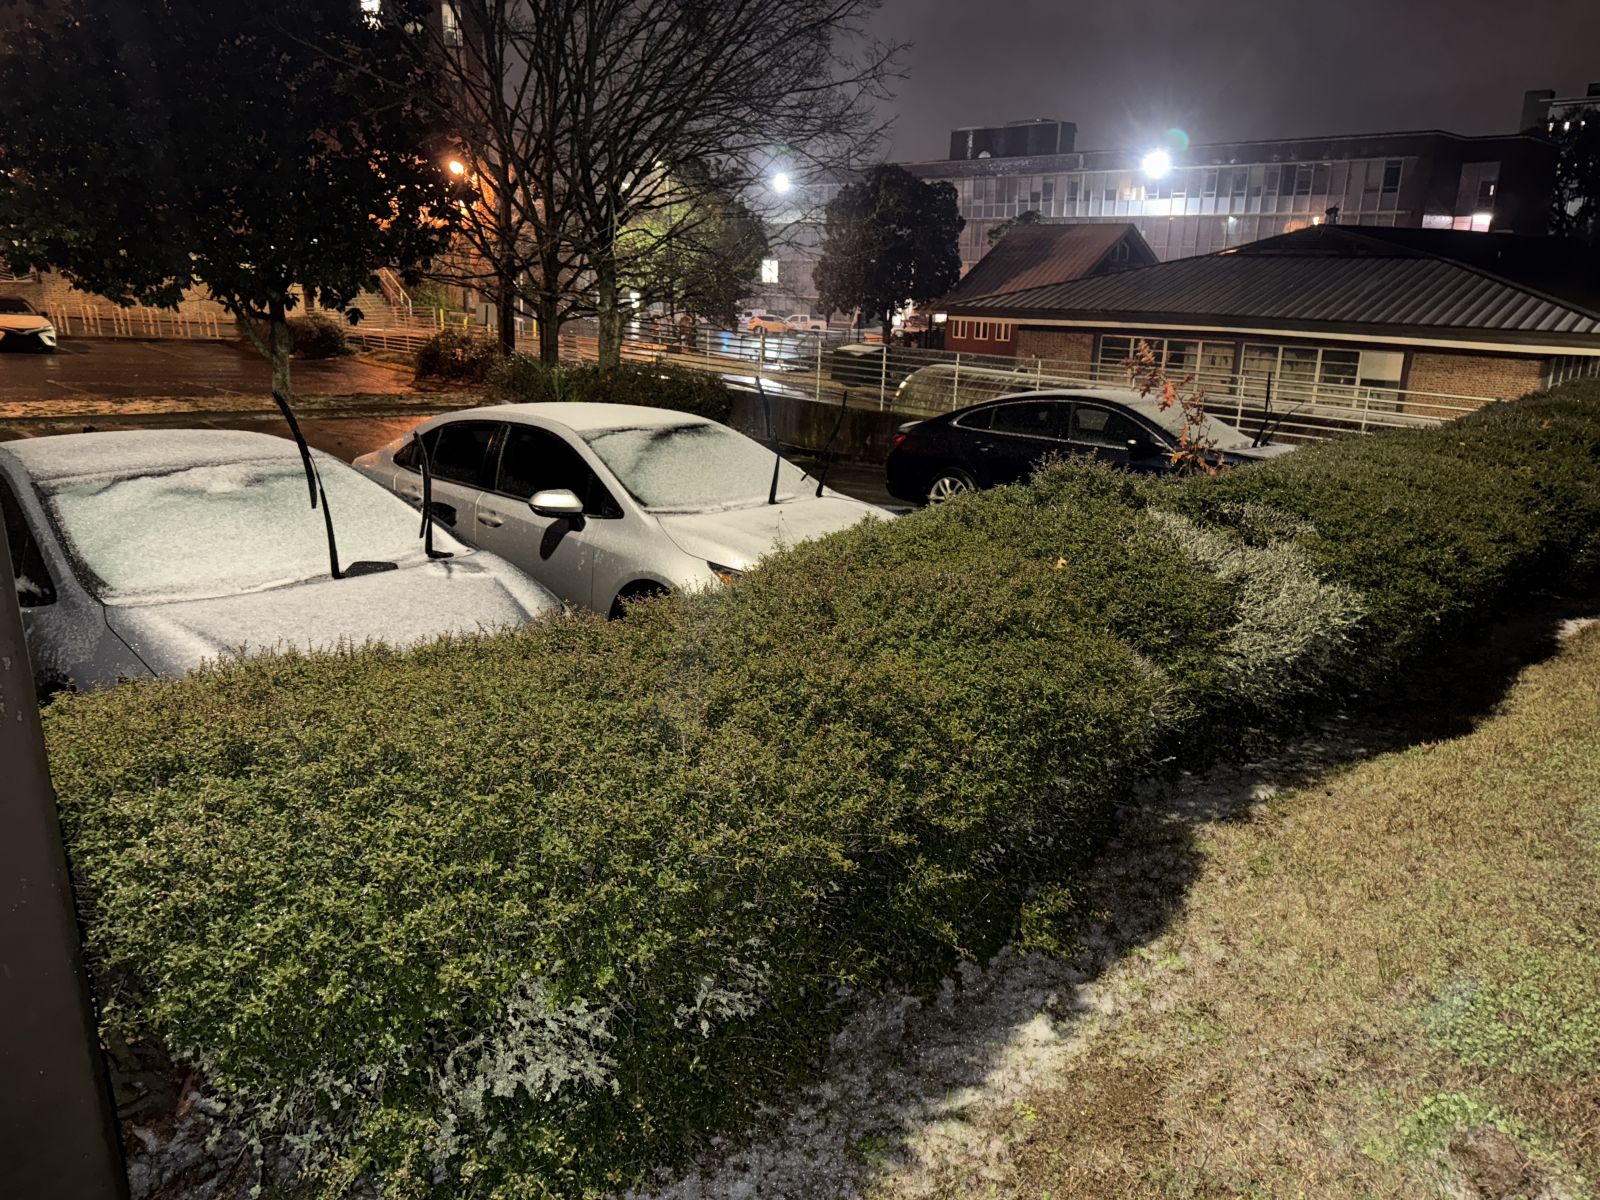
| Figure 12. Snow and ice covered roads near FSU. | Figure 13. Our parking lot as snow and sleet fell. | Figure 14. The morning after at FSU |

