| Labor Day 2011 Severe Weather Outbreak - Lee's Impacts |
A widespread outbreak of severe thunderstorms occurred on Labor Day across much of the NWS Tallahassee County Warning Area (CWA). This event was forced by unseasonably strong wind fields associated with a potent extra-tropical cyclone that was formerly Tropical Storm Lee. Post-tropical Cyclone Lee was moving slowly toward the east-northeast along the north central Gulf Coast during the morning hours of September 5, 2011. By 3:00PM EDT (1900 UTC), the cyclone was centered near Mobile Bay. It was at this point that the system finally began to accelerate off to the northeast. While tornadoes were initially considered to be the primary threat, examination of a special 1800 UTC KTAE sounding showed that low level winds had veered and that the flow was unidirectional through a deep layer. WFO Tallahassee coordinated with the Storm Prediction Center (SPC) to replace the existing tornado watch with a severe thunderstorm watch at 4:00 PM EDT (2000 UTC). Figure 1 shows all of the severe weather reports that came into NWS offices across the region. As can be see in the graphic, the vast majority of the reports were straight line wind damage.
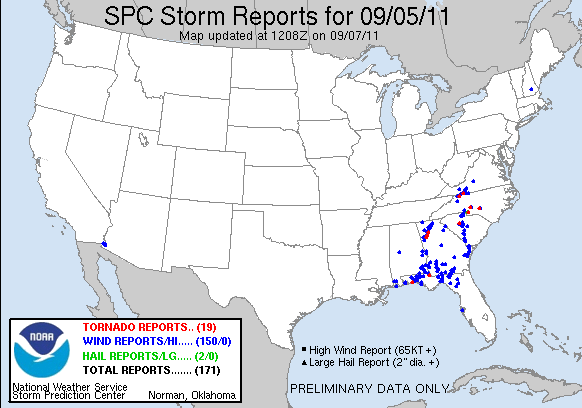
Figure 1. Storm reports relayed to the NWS on September 5, 2011 after 8:00 AM EDT (1200 UTC).
WFO Tallahassee issued a total of 35 convective warnings during the event along with several special marine warnings. Of those 35 warnings, 28 were verified. A total of 52 reports were received and 49 of those were warned for. Statistically, this resulted in a POD of 0.94, FAR of just 0.20 and a CSI a very impressive 0.76. Additional details on the damage reports can be found in our summary preliminary local storm report. Figure 2 depicts all of the local severe weather reports from the event. The average overall event lead time was 20.4 minutes. Many of the reports indicated estimated or measured winds of 60-70 mph.
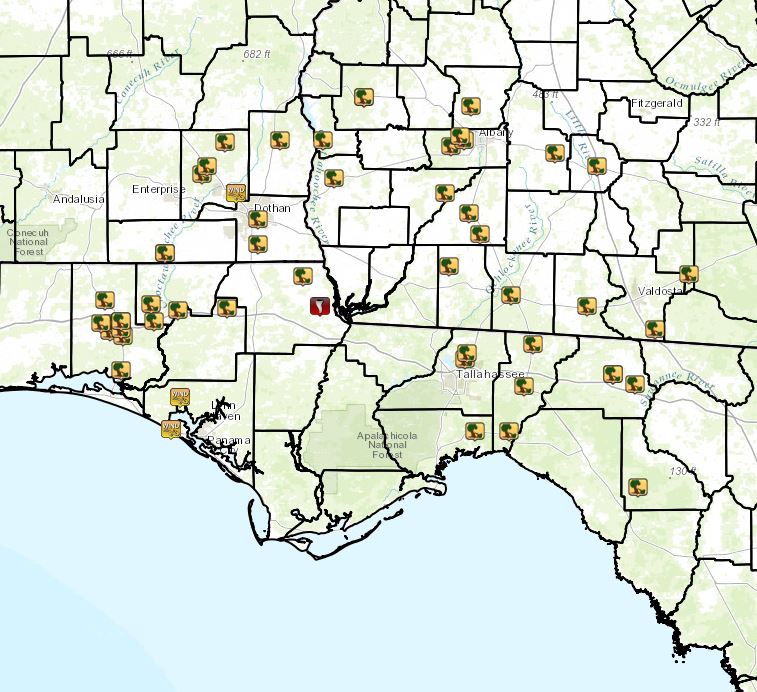
Figure 2. Severe weather reports on September 5, 2011. Locations of reported severe weather are shown by the icons. Click for a larger view.
Figures 3 and 4 show one of the first lines of severe thunderstorms to impact the forecast area. Note the 70-kt inbound winds in the base velocity (Figure 3) over southern Walton County and the bowing segments in the associated base reflectivity image (Figure 4). These storms produced numerous reports of wind damage across Walton County, an estimated 70-mph wind gust at Panama City Beach, and a measured 60-mph wind gust at the Northwest Florida Beaches Intl. Airport (KECP) at 2:58 PM EDT. Figure 5 shows some wind damage that occurred in DeFuniak Springs (Walton County). Similar radar signatures were observed throughout that afternoon and into the evening hours across much of the forecast area. most of the damage was in the form of downed trees and power lines. Fortunately, only one injury was reported.
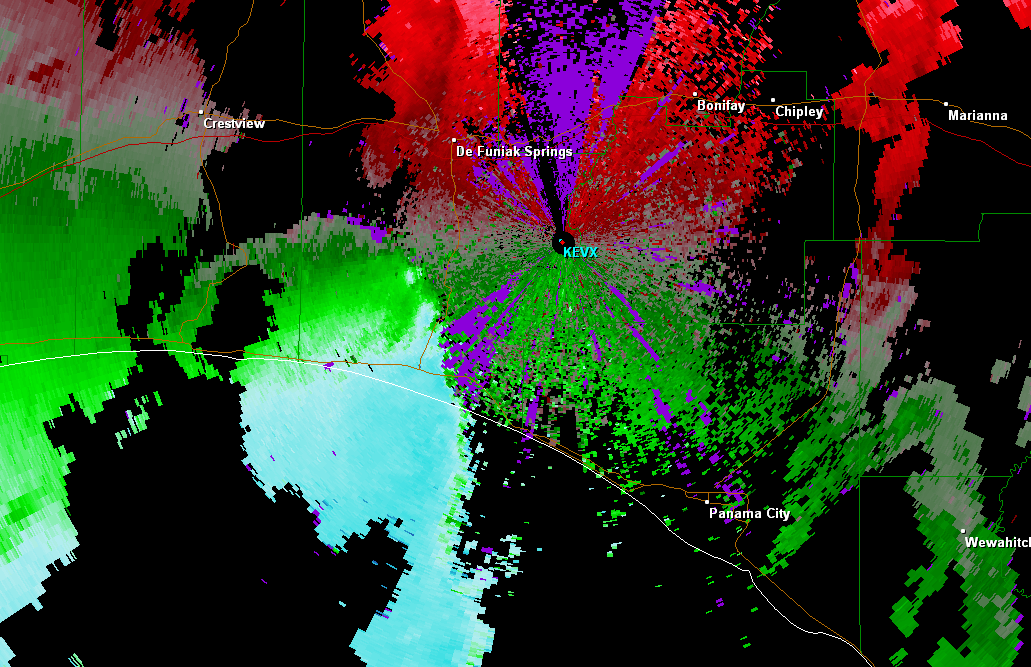
Figure 3. Base velocity imagery from the KEVX Doppler radar at 1833 UTC (2:33 PM EDT) Monday, September 5, 2011.
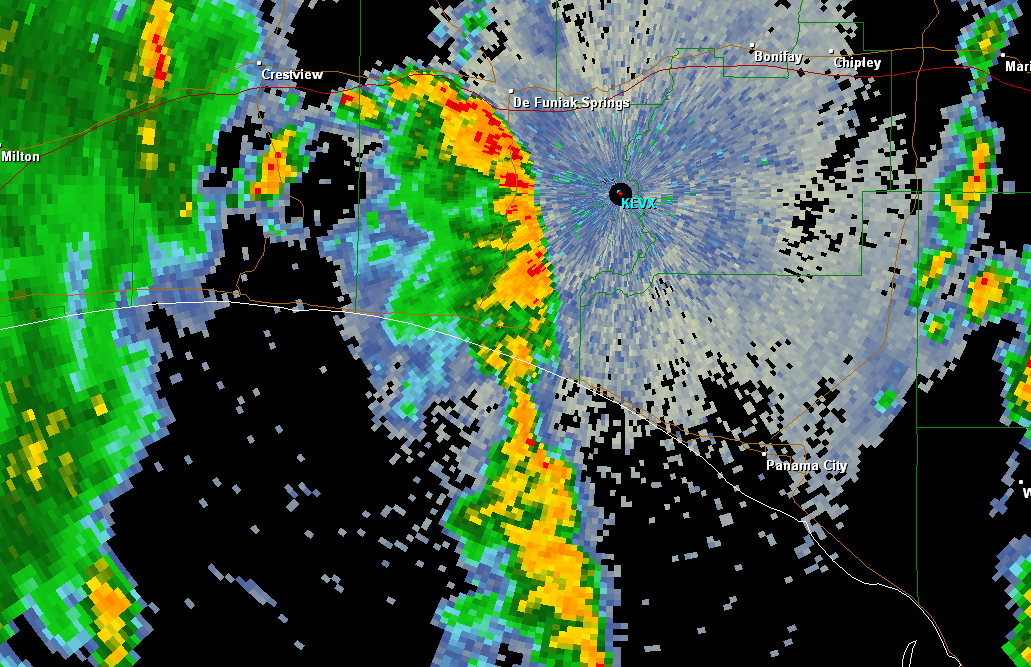
Figure 4. Base reflectivity imagery from the KEVX Doppler radar at 1833 UTC (2:33 PM EDT) Monday, September 5, 2011.
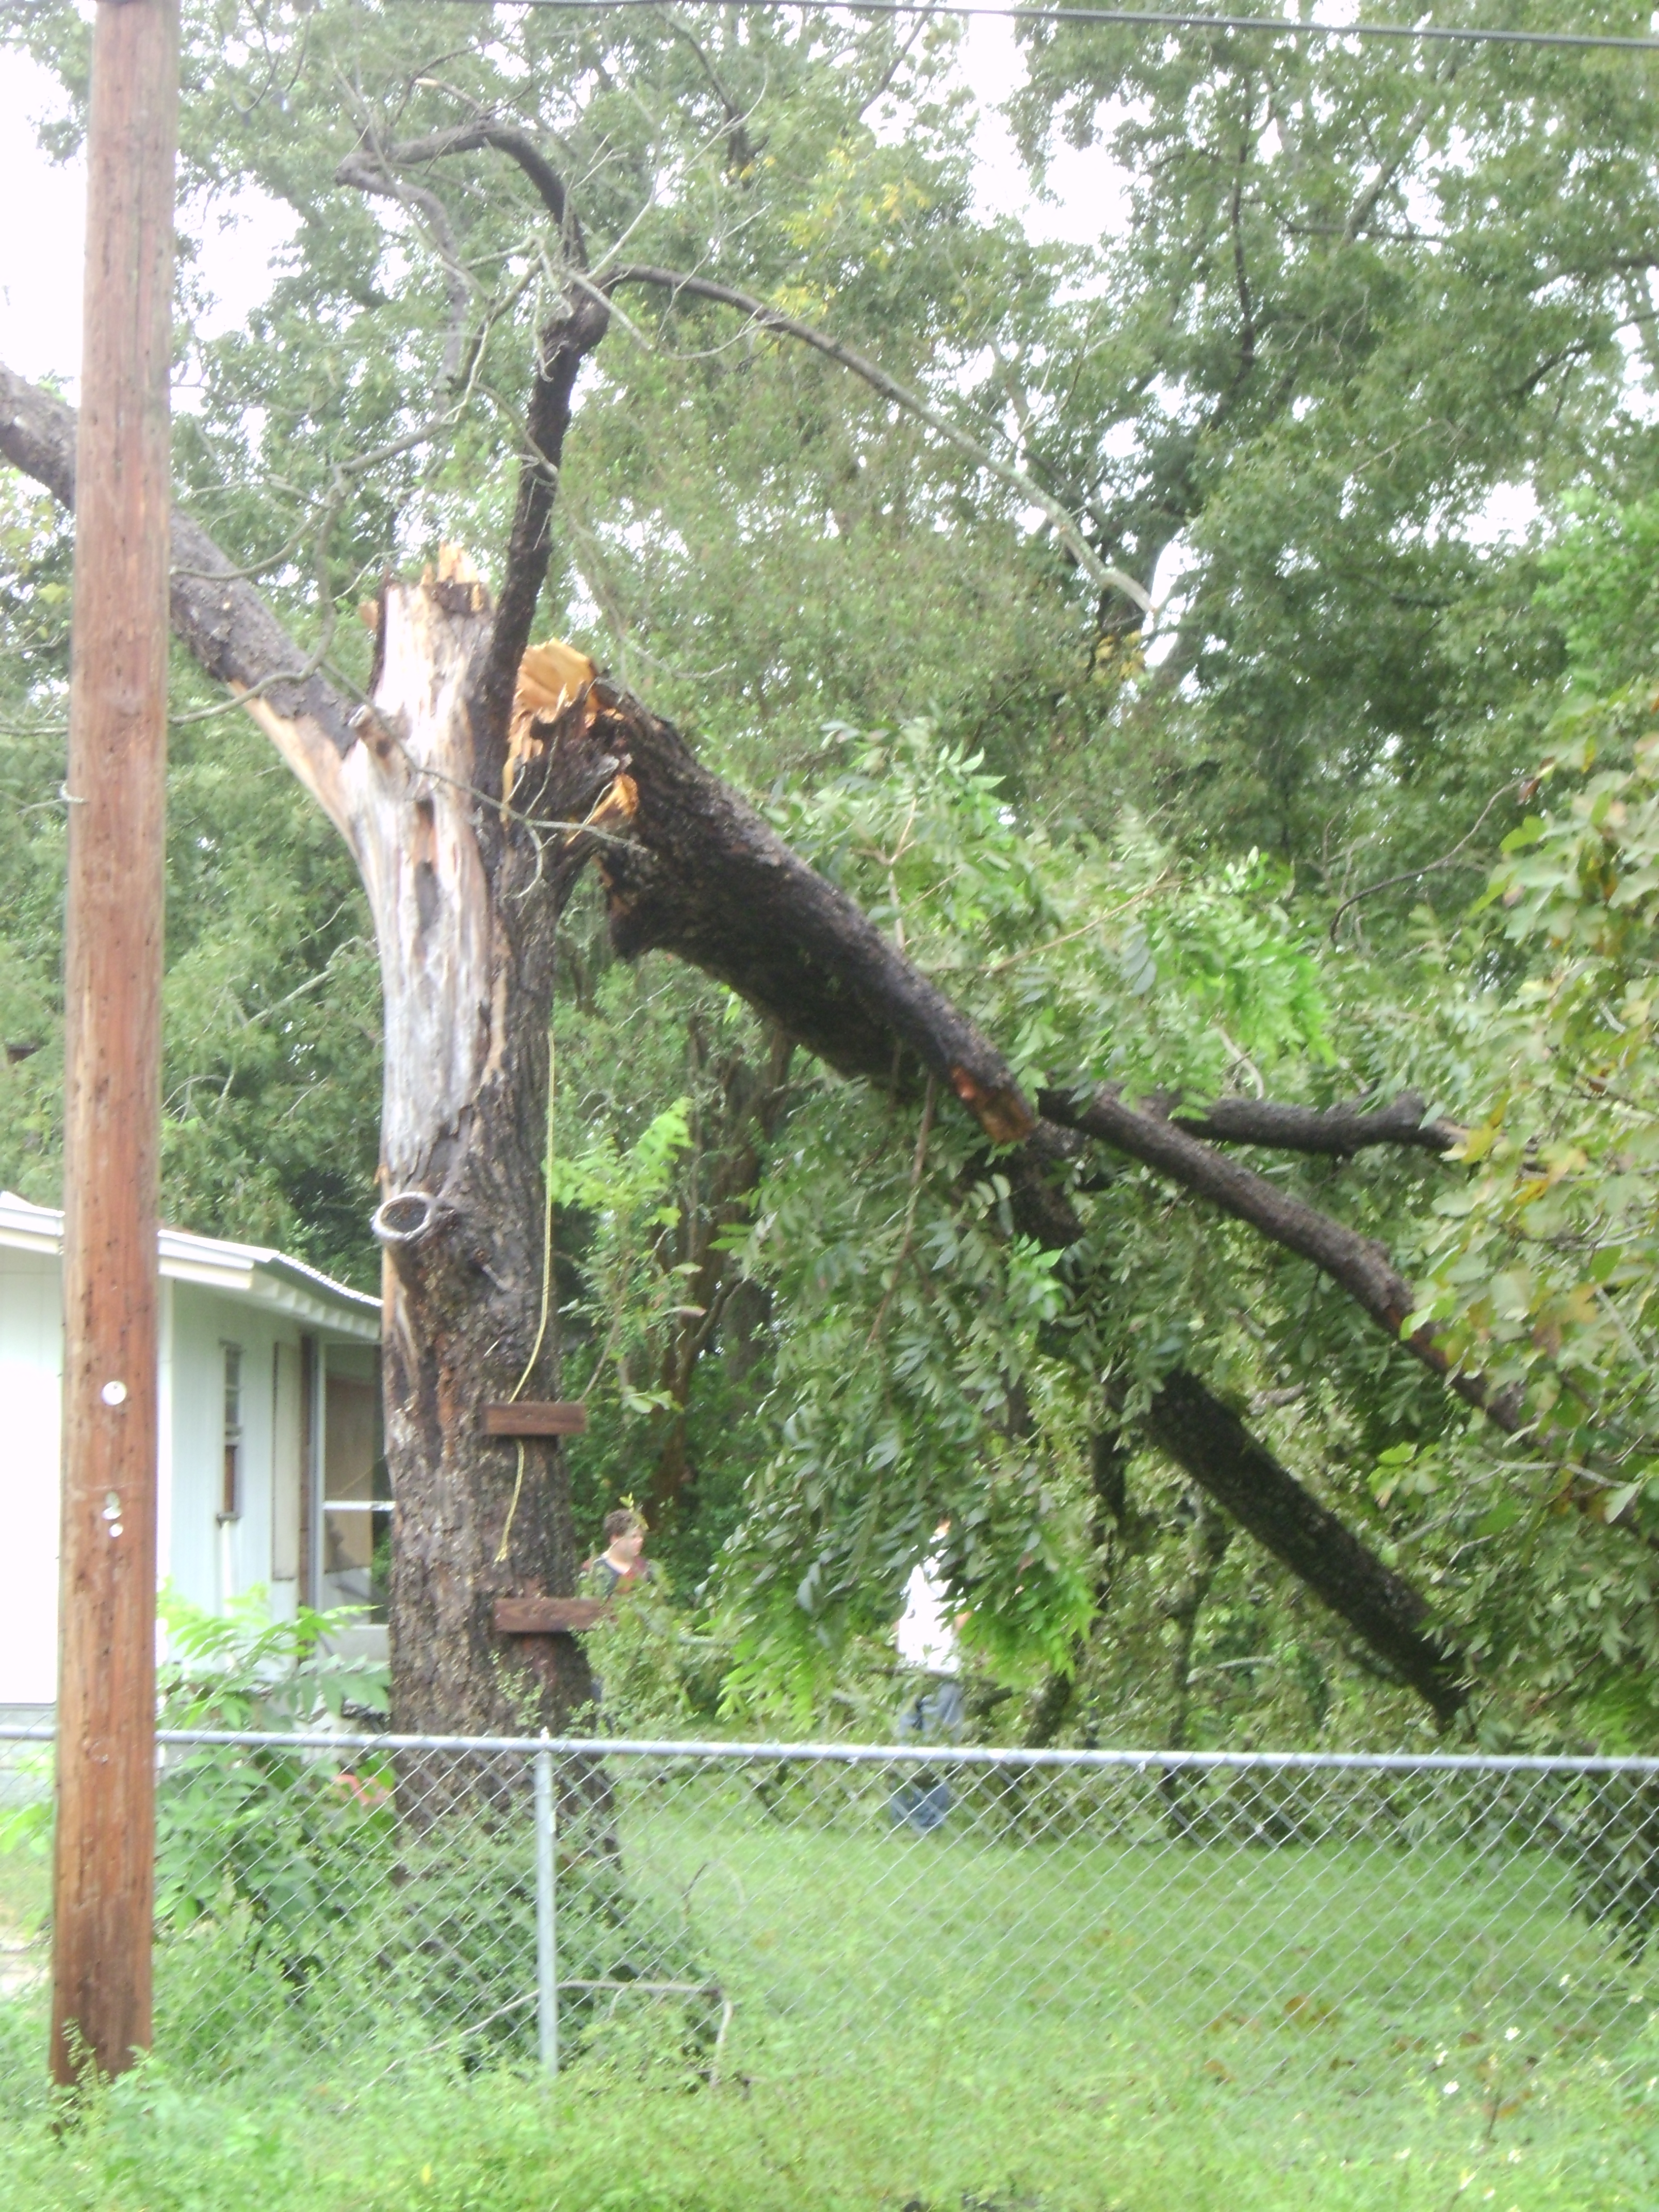
Figure 5. Tree snapped in half in Walton Co., FL by thunderstorm wind gusts on September 5, 2011. Photo courtesy of Joey Brown.
Aside from the severe weather, the forecast area experiences other peripheral impacts from Post-tropical Storm Lee. Widespread storm-total rainfall of 3 to 6 inches were measured across the Florida Panhandle and Big Bend, with 1 to 2 inch totals more common across the Alabama and Georgia portions of the CWA. A preliminary listing of rainfall measurements across the area are included in this Public information Statement.
Figure 6 from the Apalachicola and Cedar Key tide gages show that tidal departures ran just over 2 feet above normal along the Florida Big Bend coastline during the high tide cycle of Tuesday morning, September 6. For the most part, flooding was avoided. The water rose up to the top of the sea walls in Dixie County. There was some minor flooding in Wakulla County where the emergency manager reported about a 2-inch overwash in St. Marks on Old Fort Rd.
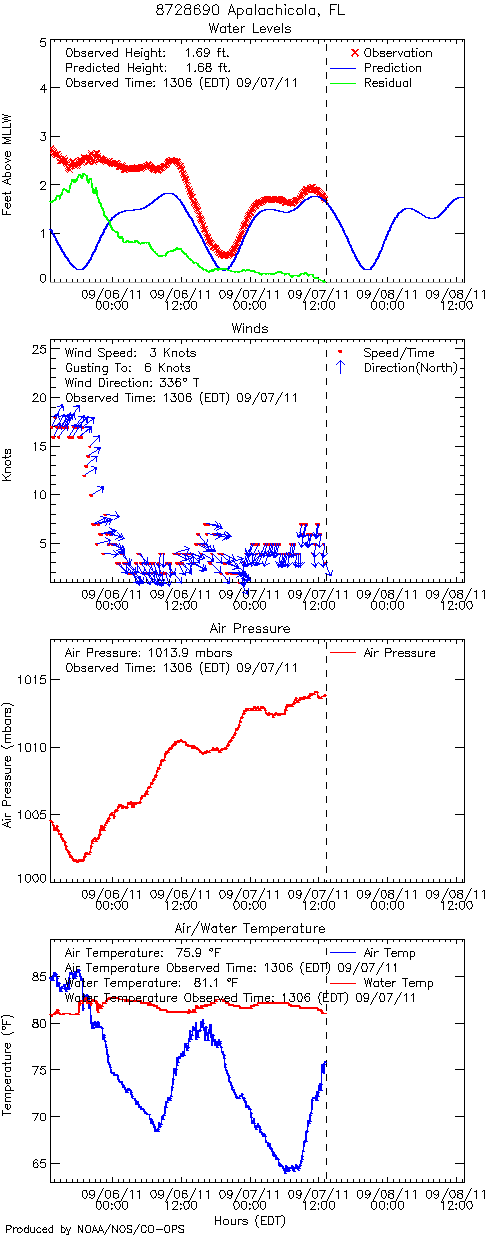
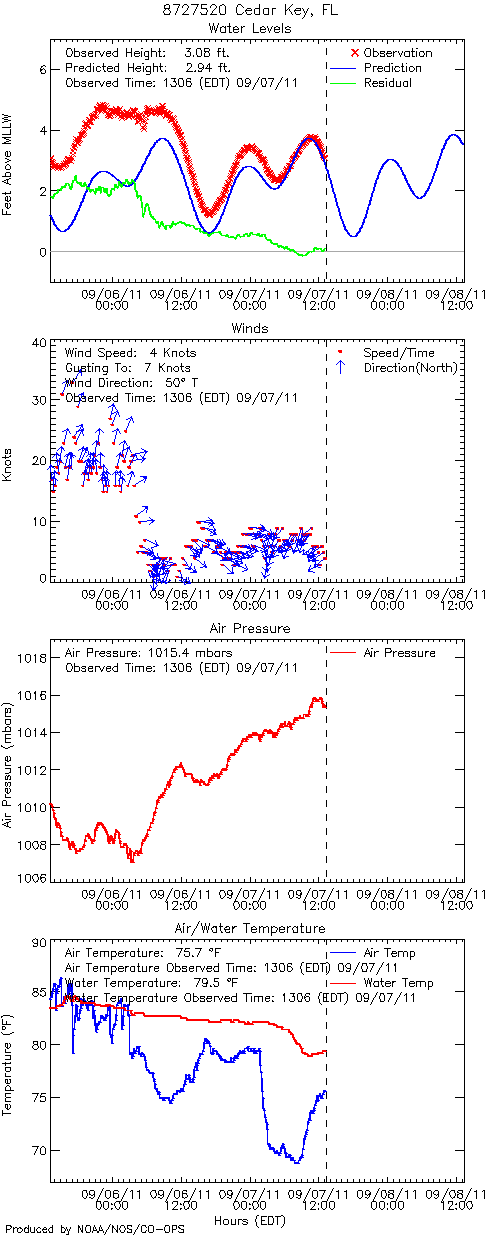
Figure 6. Data from the Apalachicola (left) and Cedar Key (right) tide gages. The top image shows observed water levels in red, normal astronomical tide levels in blue and the difference or surge in green.
Page created by Mark Wool. Thanks go to Don Van Dyke for the warning verification information and to Bryan Mroczka for assisting with the radar imagery.

