| The Blountstown EF2 Tornado and other Severe Weather of November 17, 2014 |
Severe weather, including a few tornadoes, impacted the forecast area on November 17, 2014. Figure 1 shows all of the severe weather reports that were received by this office, as well as any warnings that were in effect. As can be seen in the figure, most of the severe weather occurred in the Florida Panhandle and Southwest GA. There were also three tornadoes confirmed. One of those was a long-track tornado that reached EF2 intensity near Blountstown, FL and will be discussed in detail below. A detailed summary of all severe weather reports and a photo gallery are both available for this event.
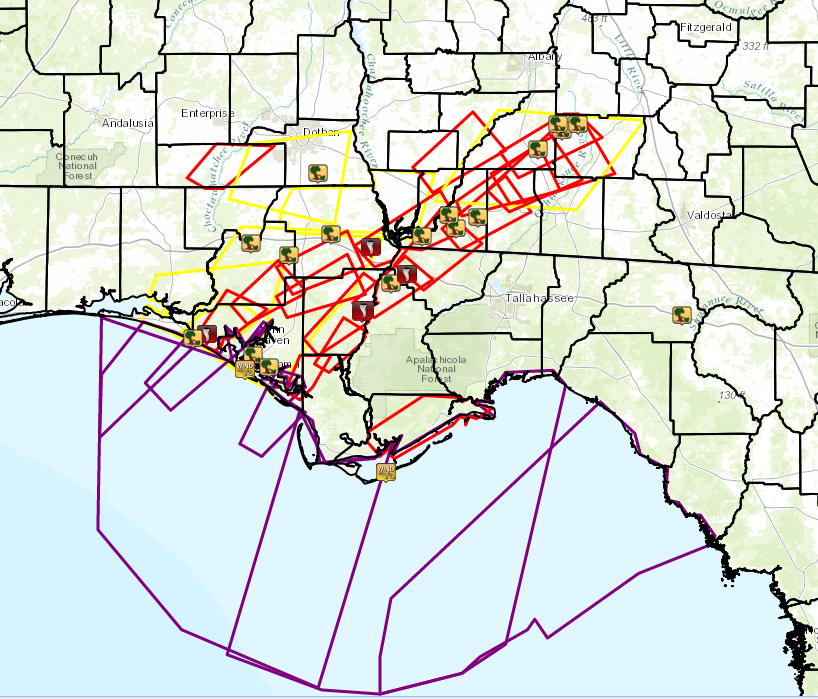
Figure 1. Map showing warning polygons and observed reports of severe weather that occurred on November 17, 2014. Polygons for tornado warnings (red), severe thunderstorm warnings (yellow), and special marine warnings (purple) are shown. Tornado and wind damage locations are indicated by the respective icons.
A long-track tornado was confirmed by an NWS survey team in Calhoun and Gadsden Counties in FL. The detailed survey team's report is available. As depicted in Figure 2, the tornado was on the ground for just over 22 miles and was over 400 yards wide at one point. This tornado produced the longest continuous damage path in Florida since the Central Florida outbreak of February 1, 2007. The tornado was at its strongest intensity shortly after touchdown, causing EF2 damage to the Calhoun Correctional Institution. This is only the third significant tornado (EF2 or higher) that has occurred in the WFO Tallahassee forecast area since the devastating EF4 tornado destroyed the high school in Enterprise, AL in March of 2007. Fortunately, there was no loss of life this time around, thanks in part to a 33-minute lead time on the warning. Figure 3 shows an aerial view of damage at the prison. Note the flipped vehicles and damage to concrete buildings. Figure 4 shows debris from the tornado that was swept into the Apalachicola River. Figure 5 shows a radar depiction of the tornado as it passed near Blountstown. Notice the familiar hook echo in the base reflectivity (BR) and gate-to-gate shear in the storm-relative velocity (SRV). These areas are coincident with a region of low correlation coefficient (CC) in the dual pol data resulting in a tornado debris signature around the time of the EF2 damage at the prison. A YouTube video of the radar depiction of the tornado has been posted.
While this long-track tornado was the most significant of the event, there were two others. The first tornado of the night was verified by the dual pol signature evident in Figure 6. This tornado occurred one mile south of Laird in Bay County, FL. Another tornado produced EF0 damage in Jackson County near Grand Ridge, FL. Figure 7 shows damage to a mobile home in that vicinity.
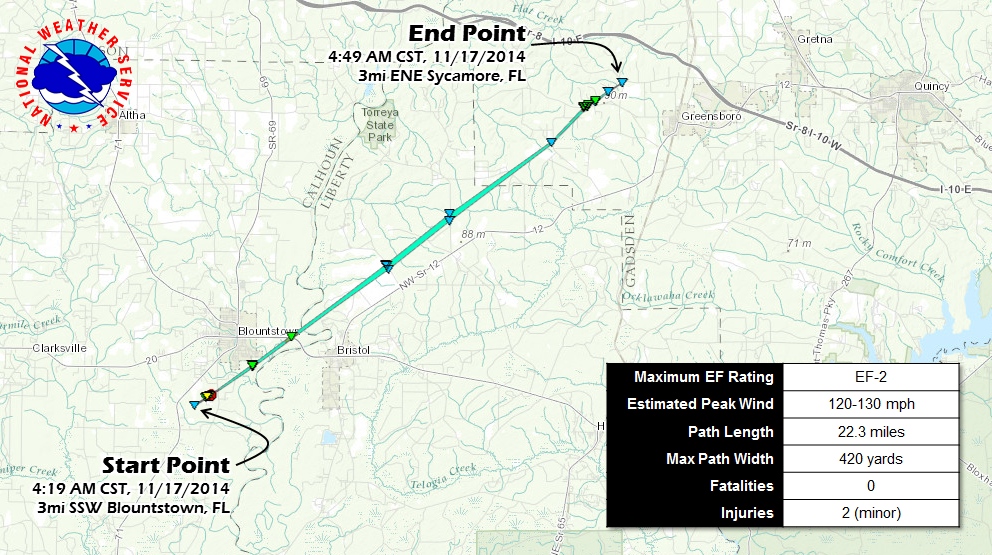
Figure 2. Map showing the approximate 22-mile long track of the tornado that touched down just southwest of Blountstown, FL in Calhoun County on November 17, 2014. The tornado was at its strongest just after touchdown where it caused EF2 damage. Click here for the kmz file.
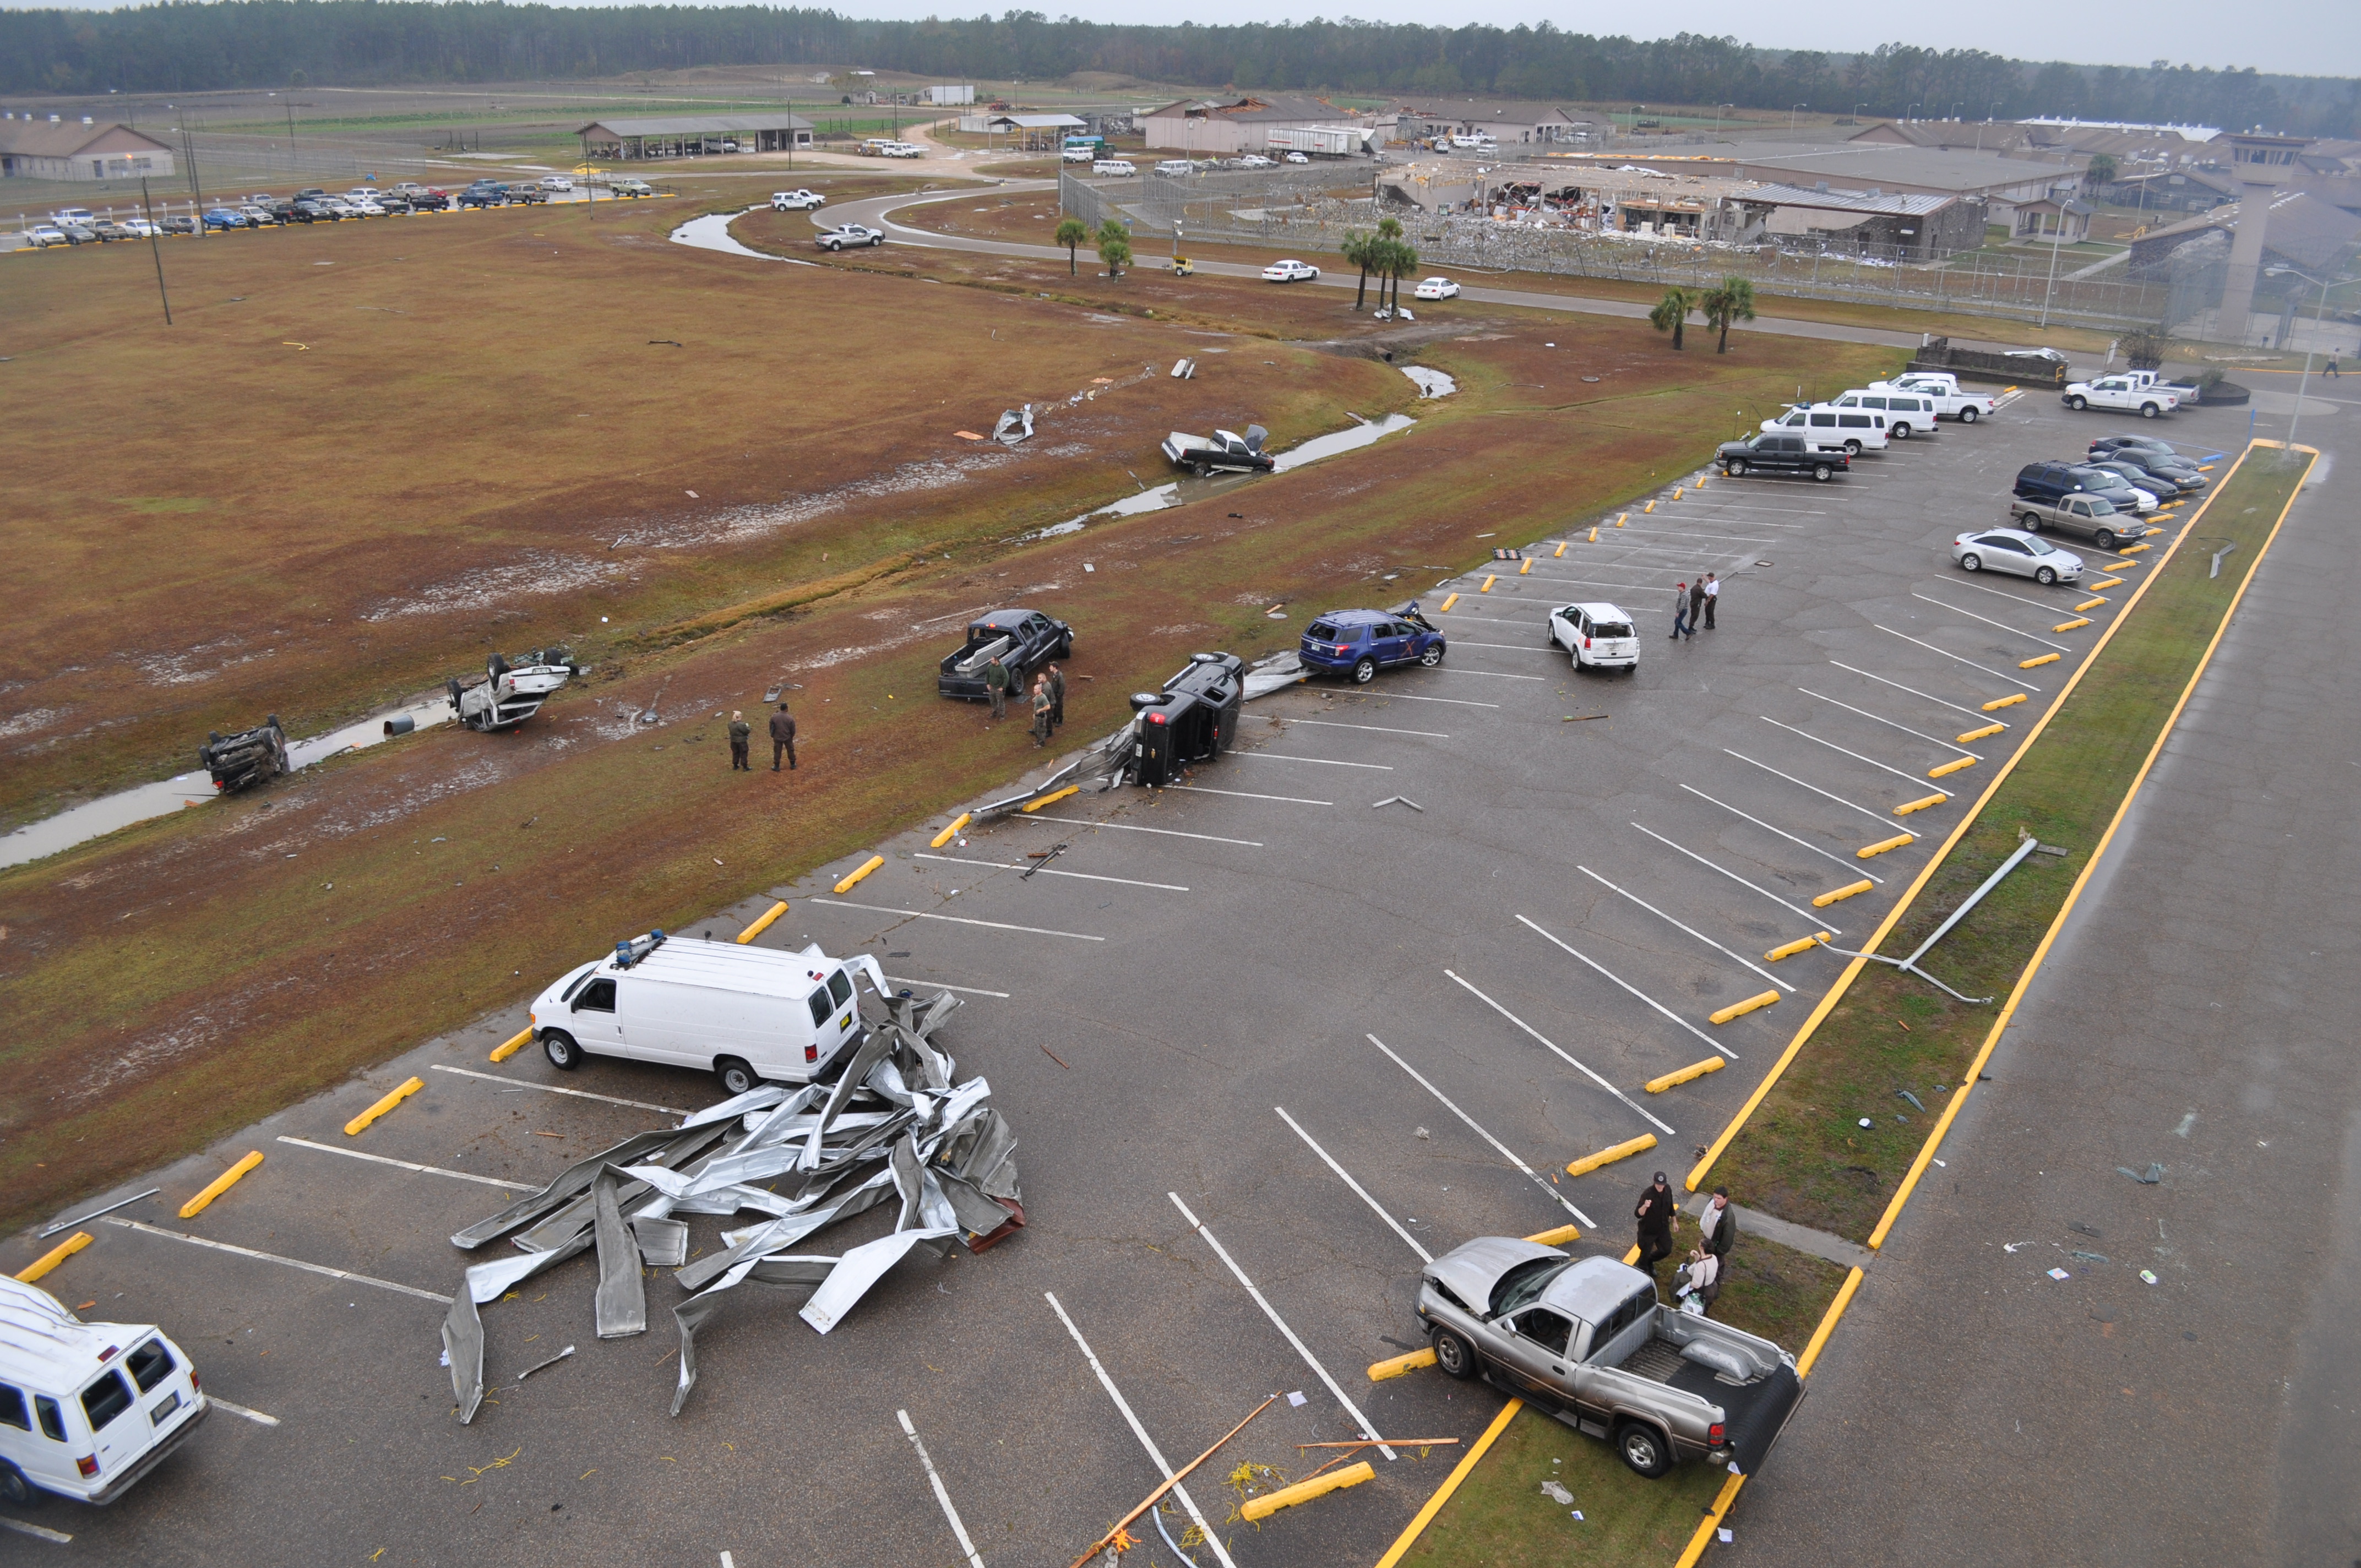
Figure 3. Damage to the Calhoun Correctional Institution southwest of Blountstown, FL that resulted from an EF2 tornado on November 17, 2014. Click for a larger view.
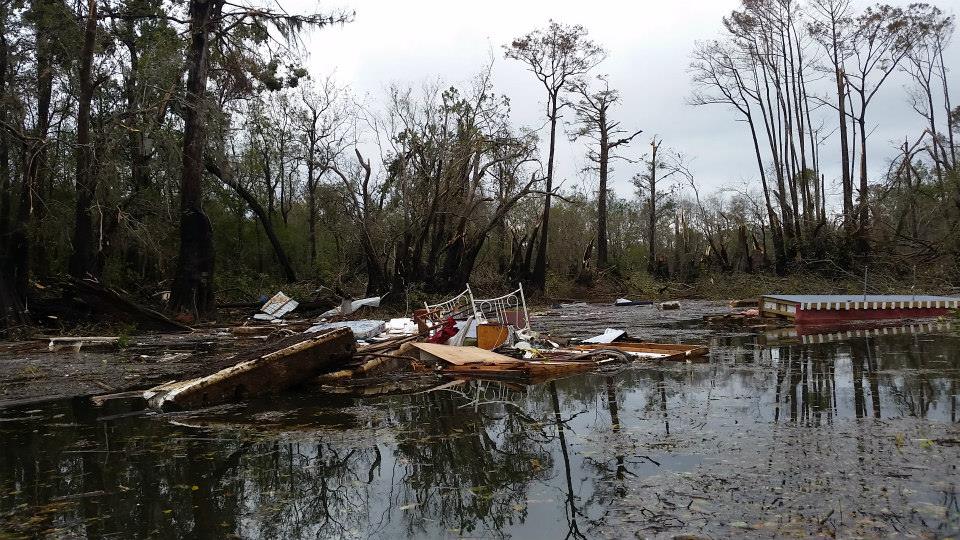
Figure 4. Debris from a tornado is deposited in the Apalachicola River on November 17, 2014. Click for a larger view.
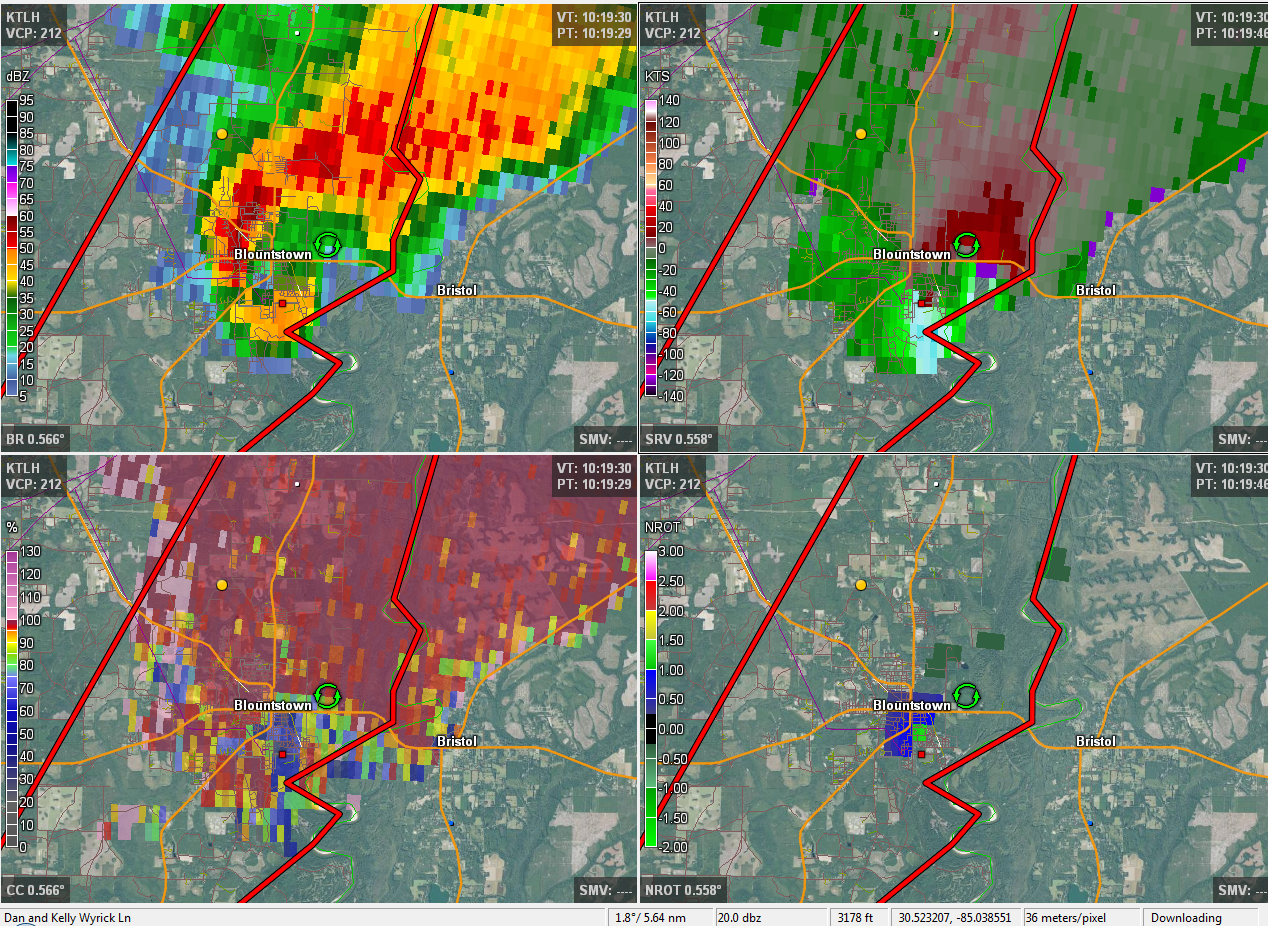
Figure 5. A 4-panel image from the Tallahassee, FL (KTLH) radar valid 1020 UTC 17 November 2014. Clockwise from top left, the images depict base reflectivity, storm-relative velocity, rotational velocity and correlation coefficient, all on the 0.5-degree slice. Click the image for a larger view.
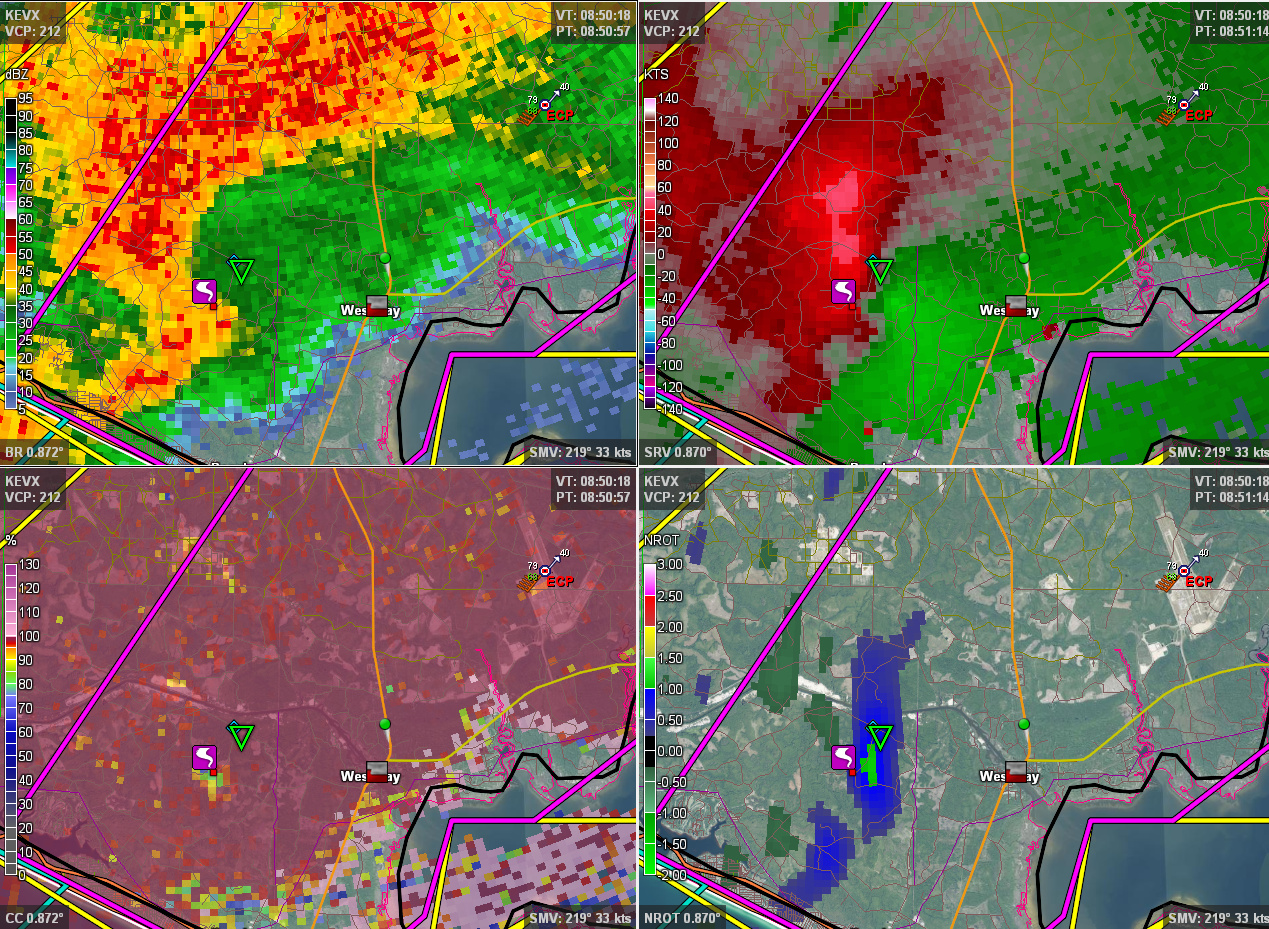
Figure 6. A 4-panel image from the Eglin AFB , FL (KEVX) radar valid 851 UTC 17 November 2014. Clockwise from top left, the images depict base reflectivity, storm-relative velocity, rotational velocity and correlation coefficient, all on the 0.5-degree slice. Click the image for a larger view.
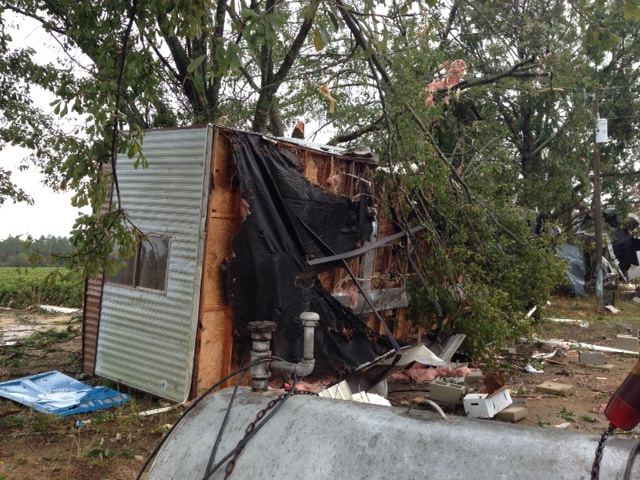
Figure 7. A mobile home overturned by an EF0 tornado near Grand Ridge, FL on November 17, 2014. Click for a larger view.
This page was authored by Mark Wool. The map of storm reports and warning polygons was created by Don Van Dyke. The tornado track map was assembled using the Damage Assessment Toolkit base on information gathered by Kelly Godsey, Alex Lamers and Wright Dobbs during a damage survey. The associated kmz file was created by Don Van Dyke.

