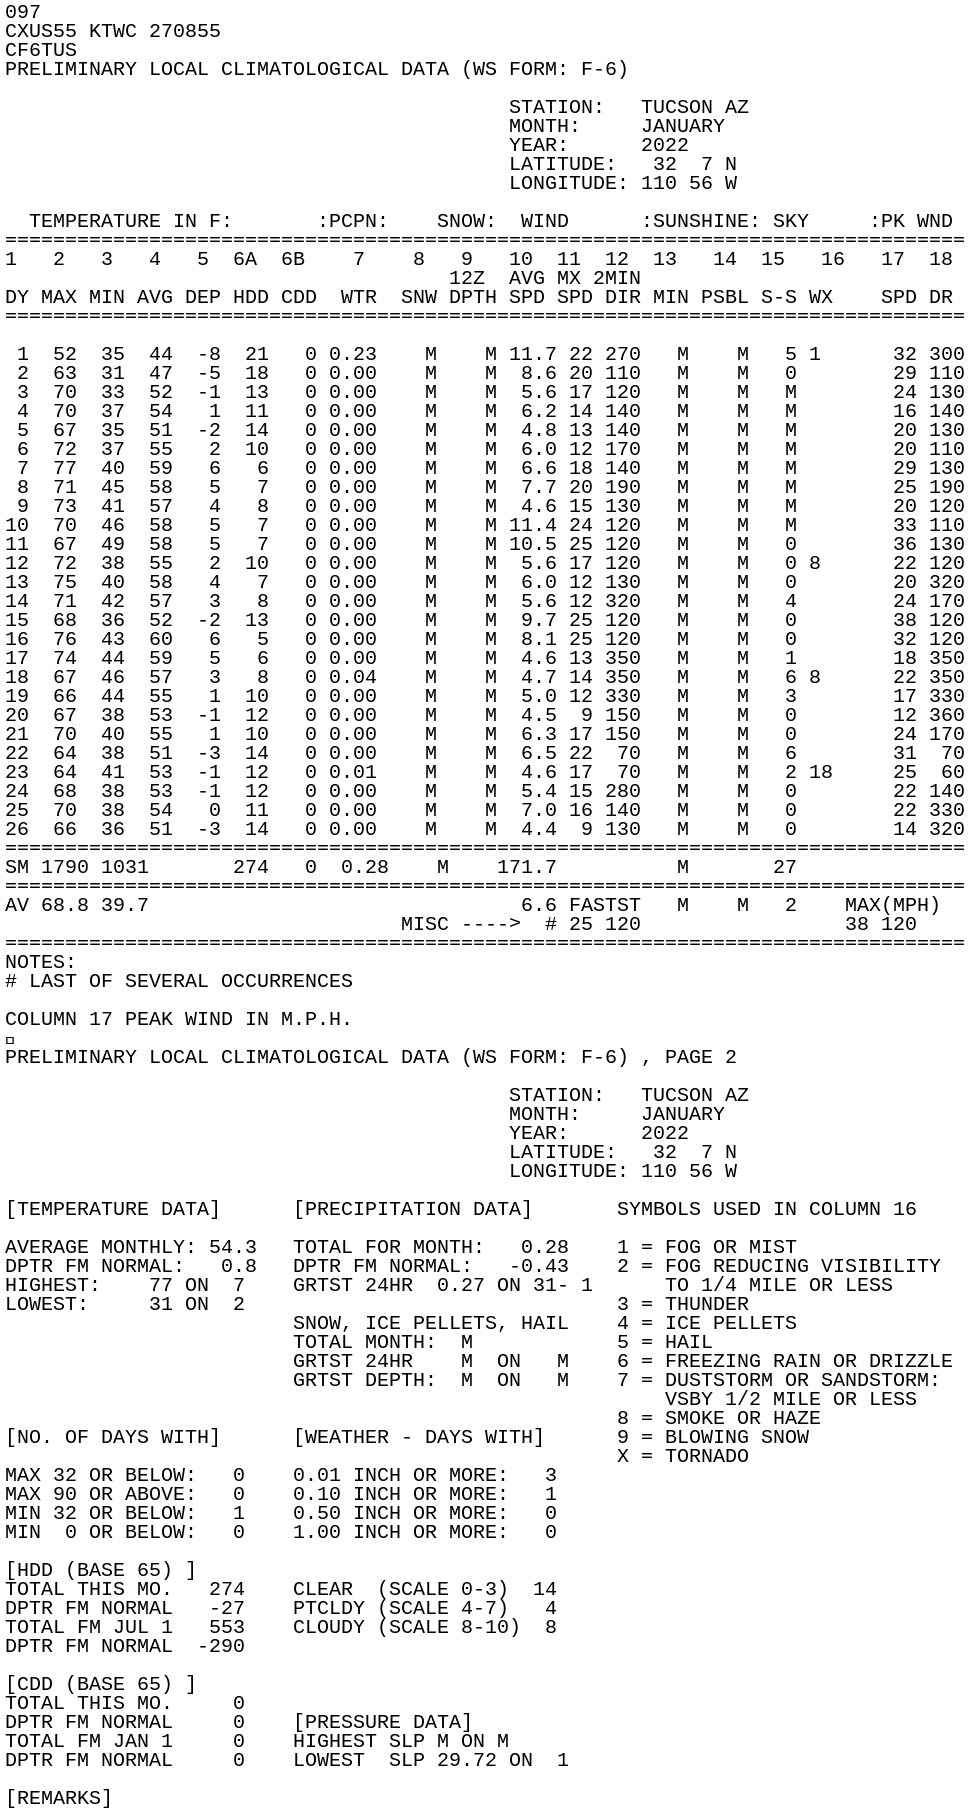
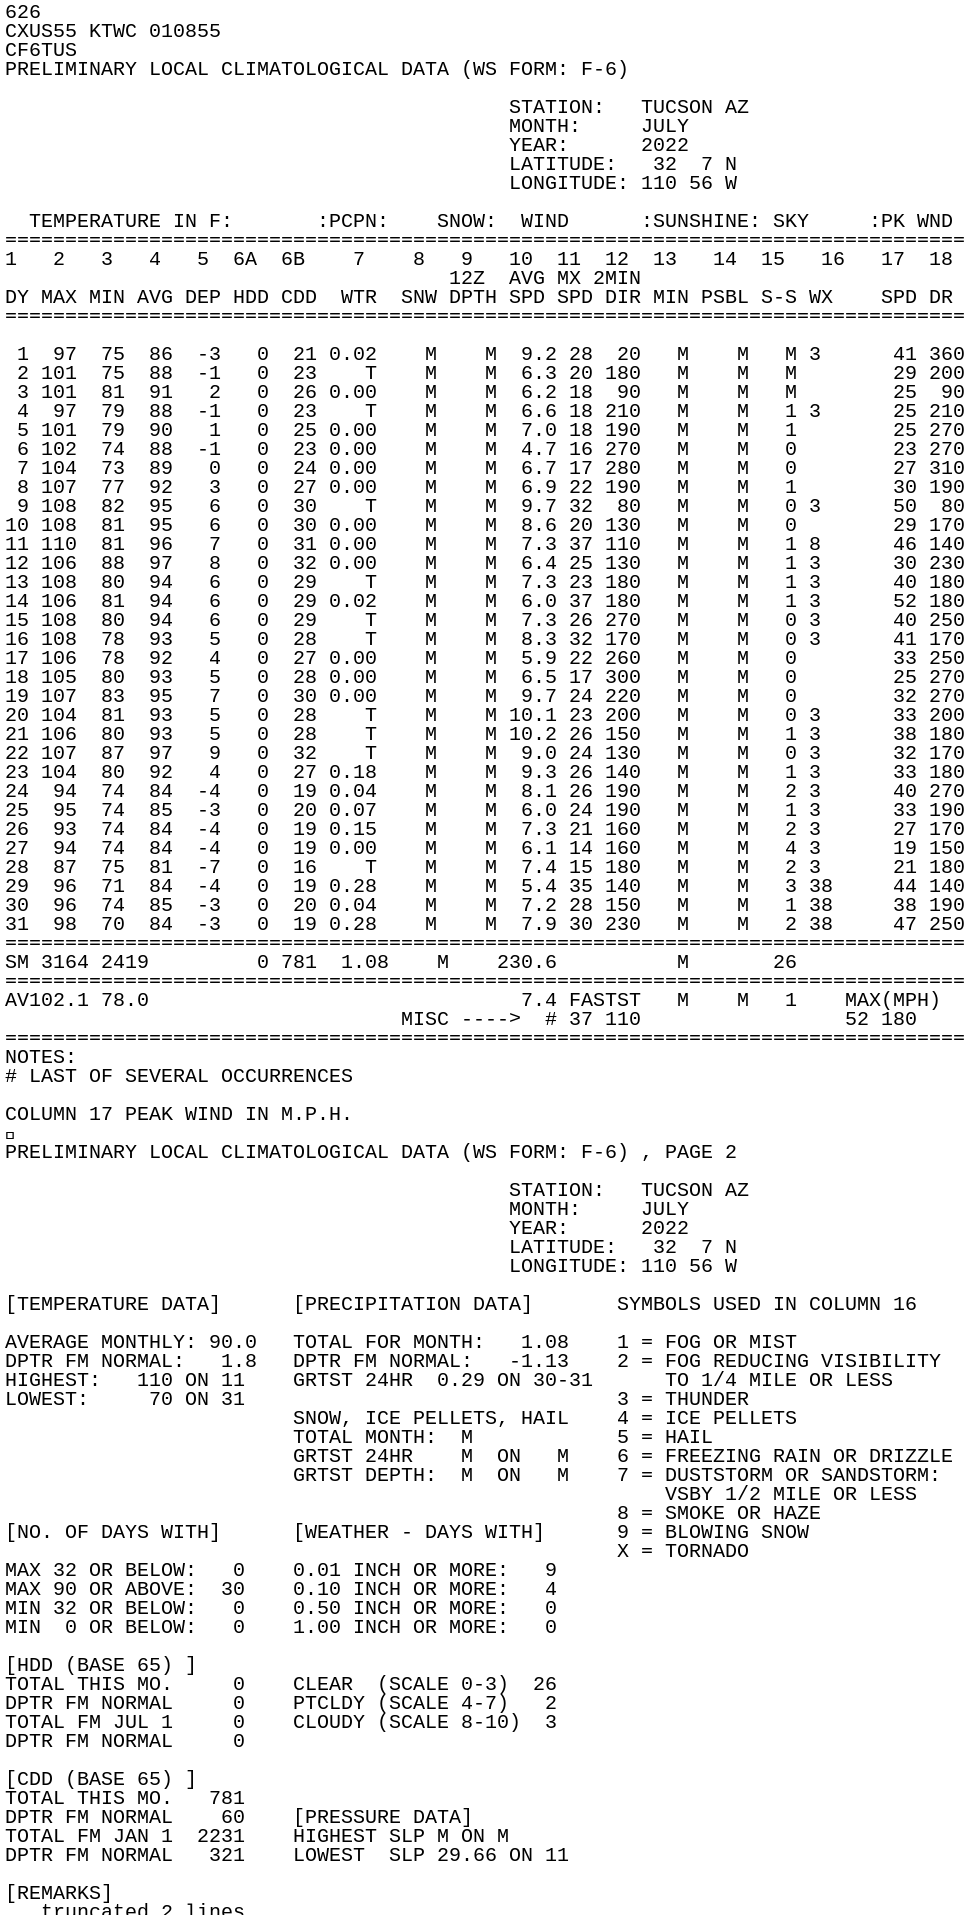
| August 2022 climate report for Tucson |
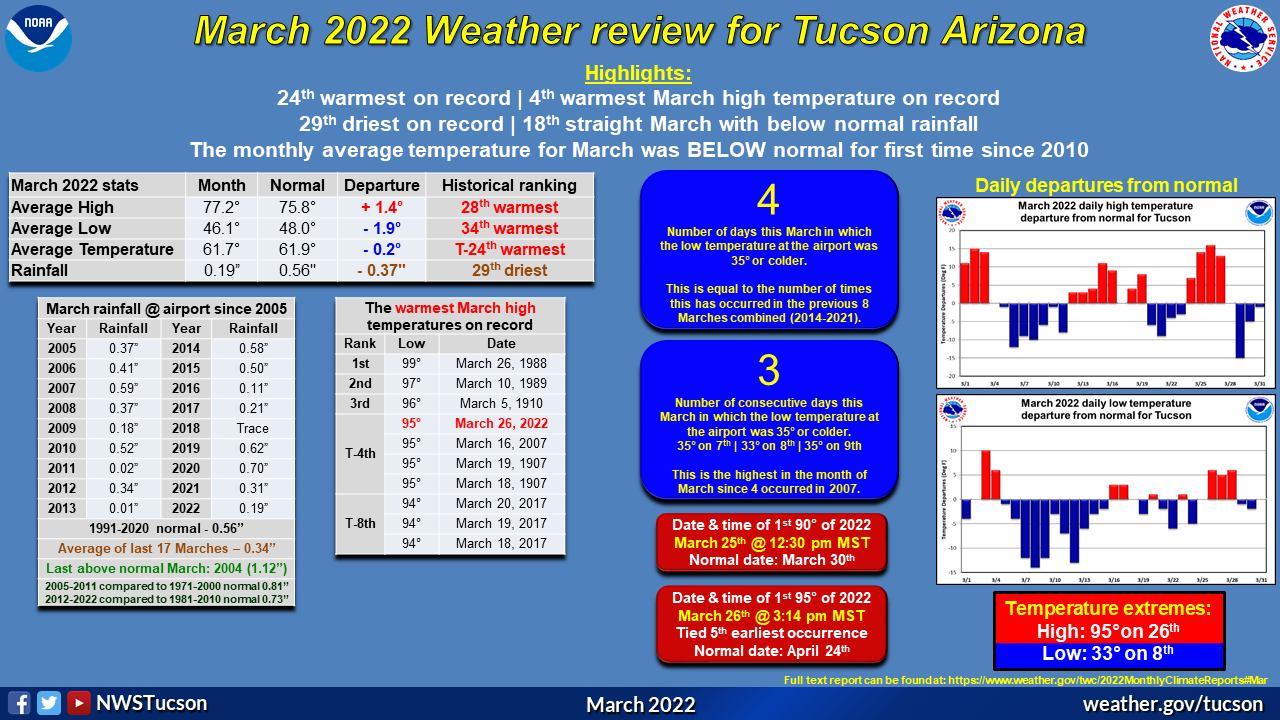
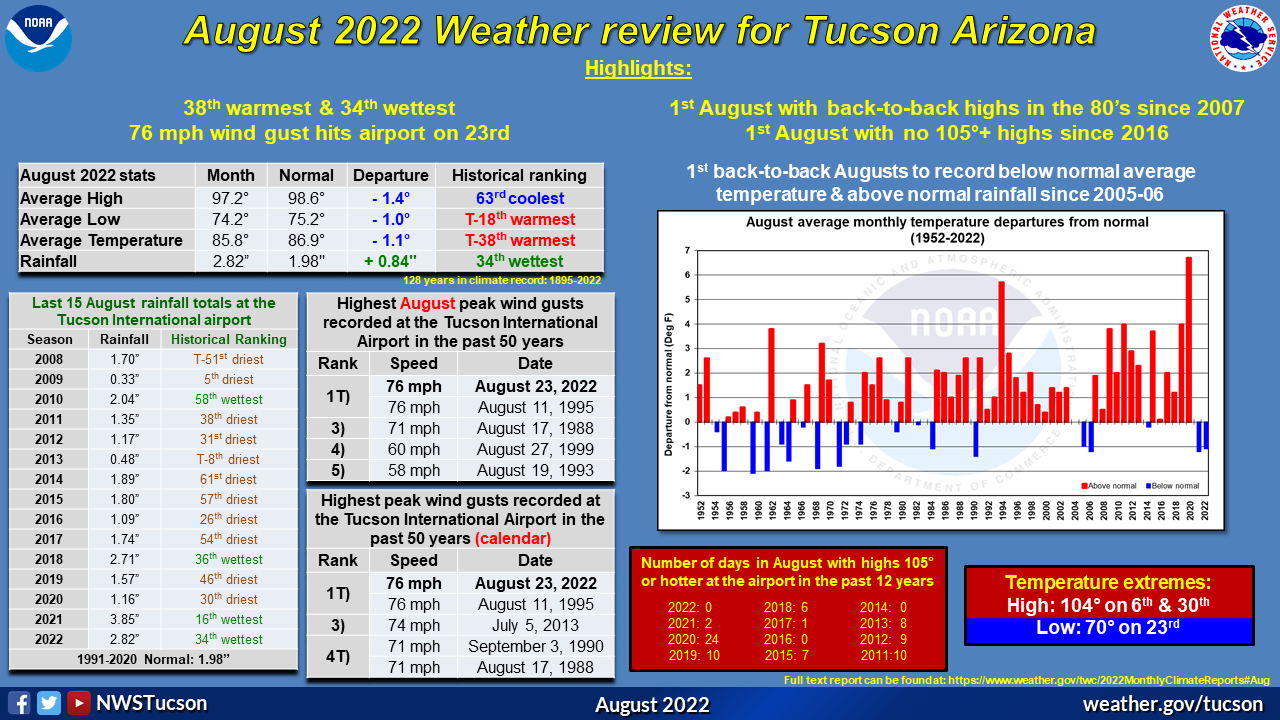
| 38th warmest and 34th wettest on record |
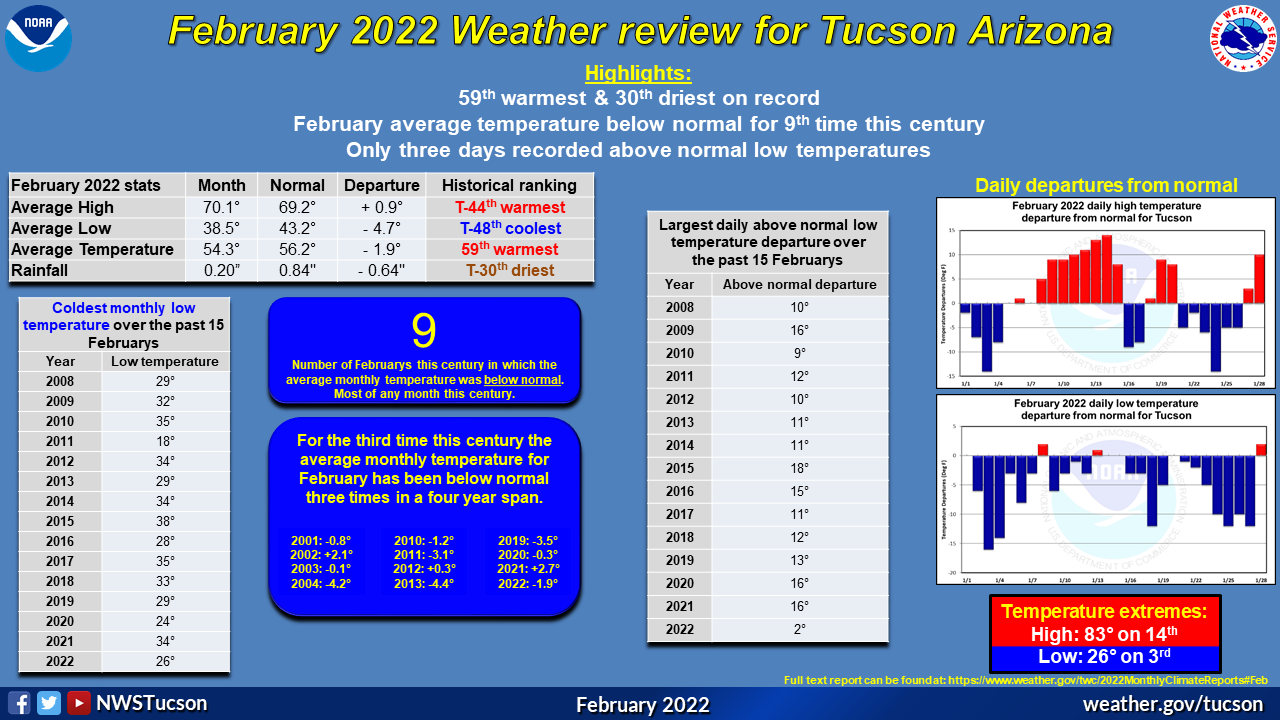
| The average monthly temperature was below normal for 2nd consecutive August |
| First August with no 105°+ highs since 2016 |
| 76 mph thunderstorm wind gust recorded at the airport |
| 2nd consecutive August that airport records above normal rainfall |
| |
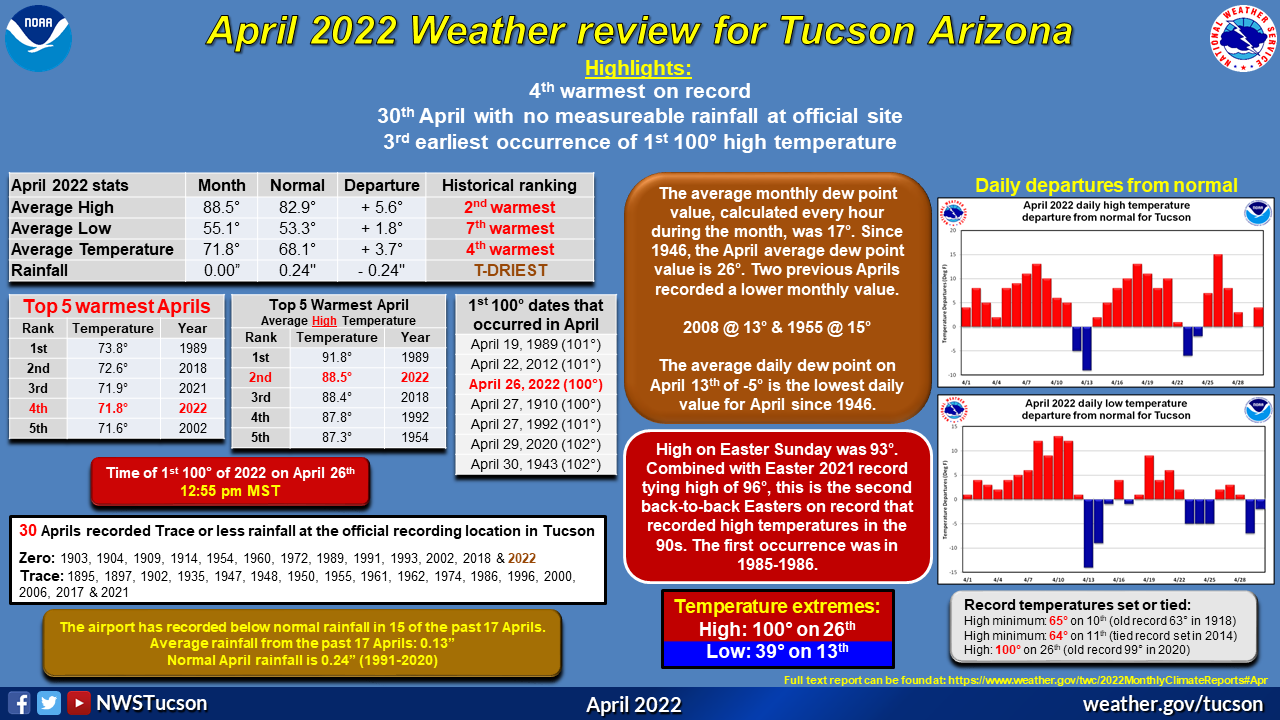
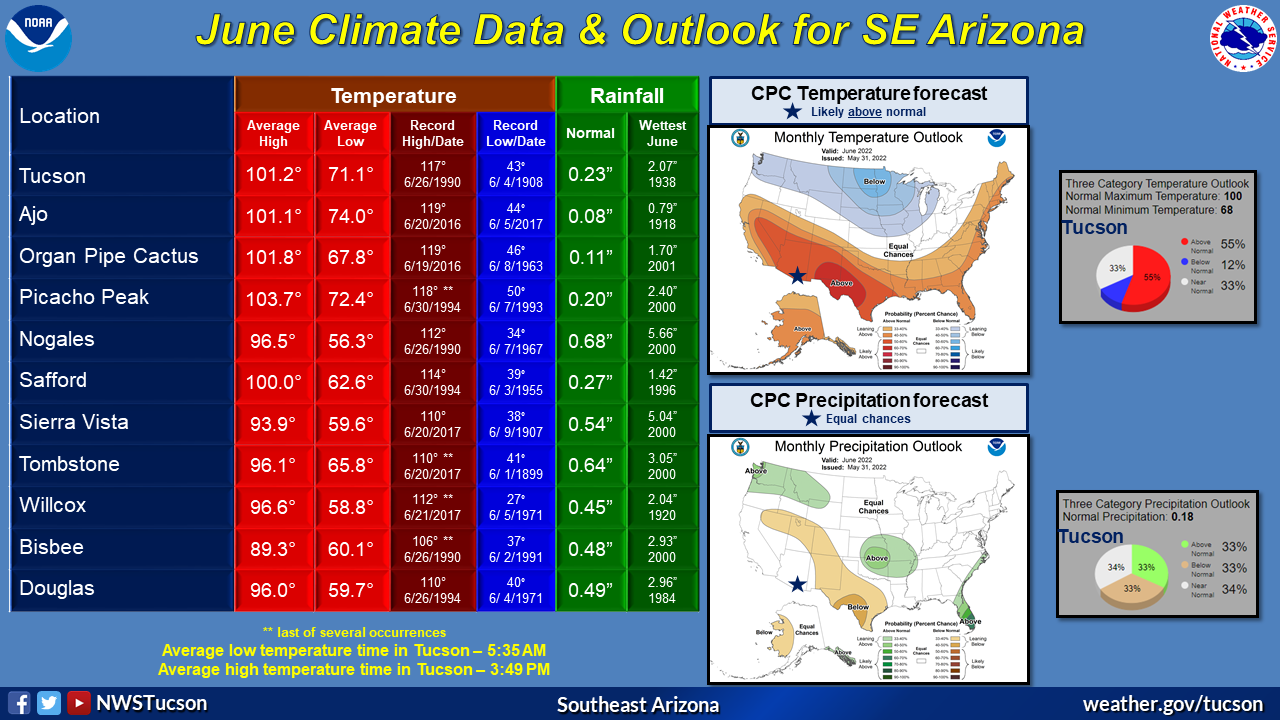
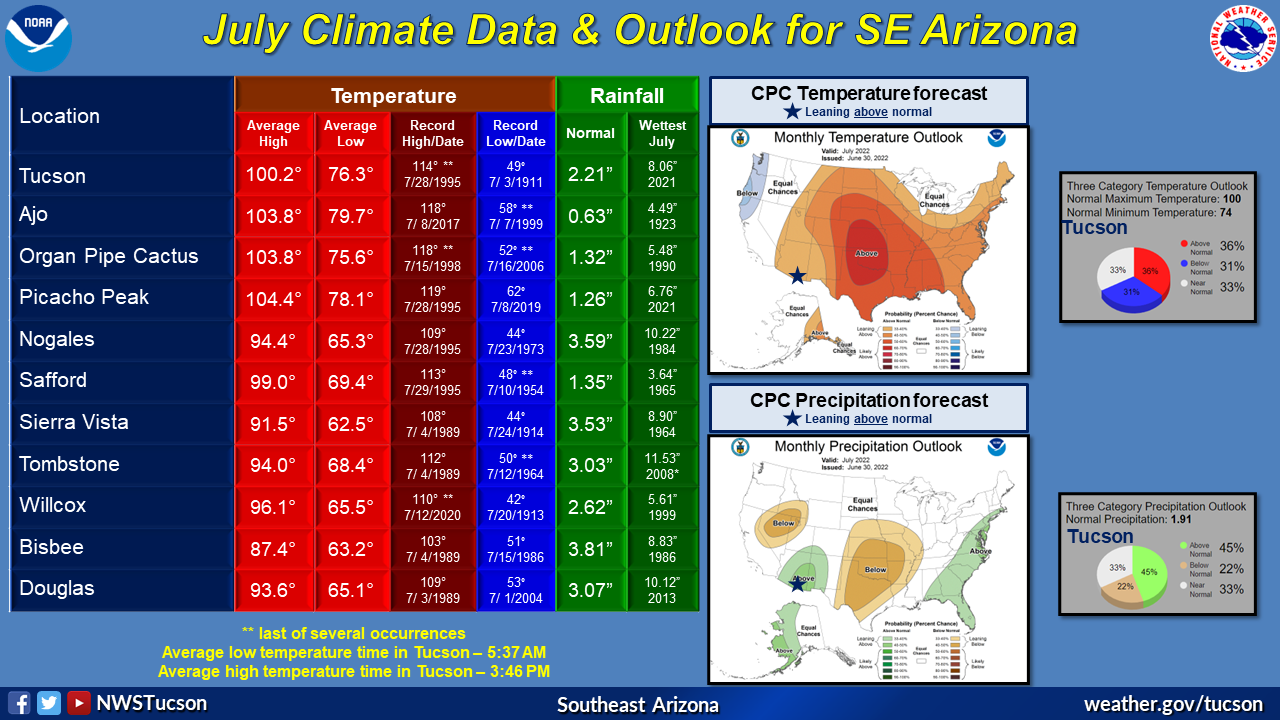
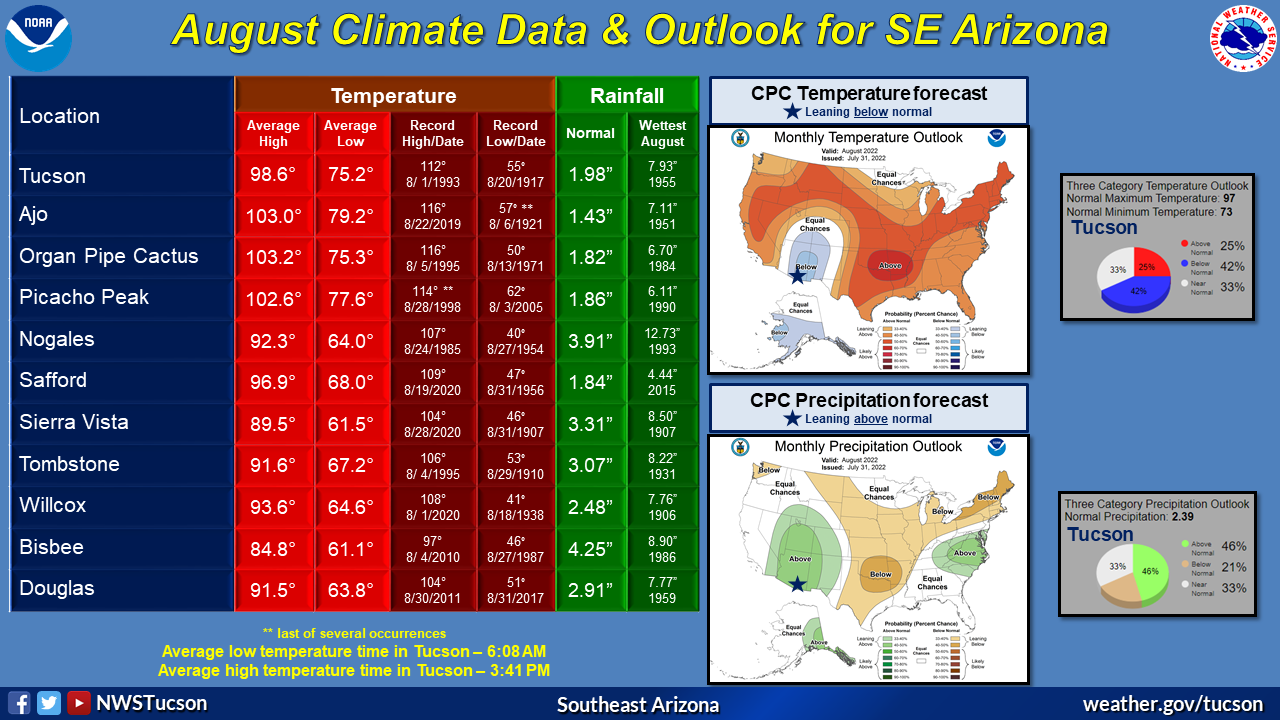
| The Climate Prediction Center August outlook for Tucson, issued on July 31st, called for a 42% chance that temperatures will be below normal and a 46% chance that rainfall will be above normal. That forecast turned out correct with the August average temperature at the airport coming in below normal and rainfall coming in above normal. |
| |
|
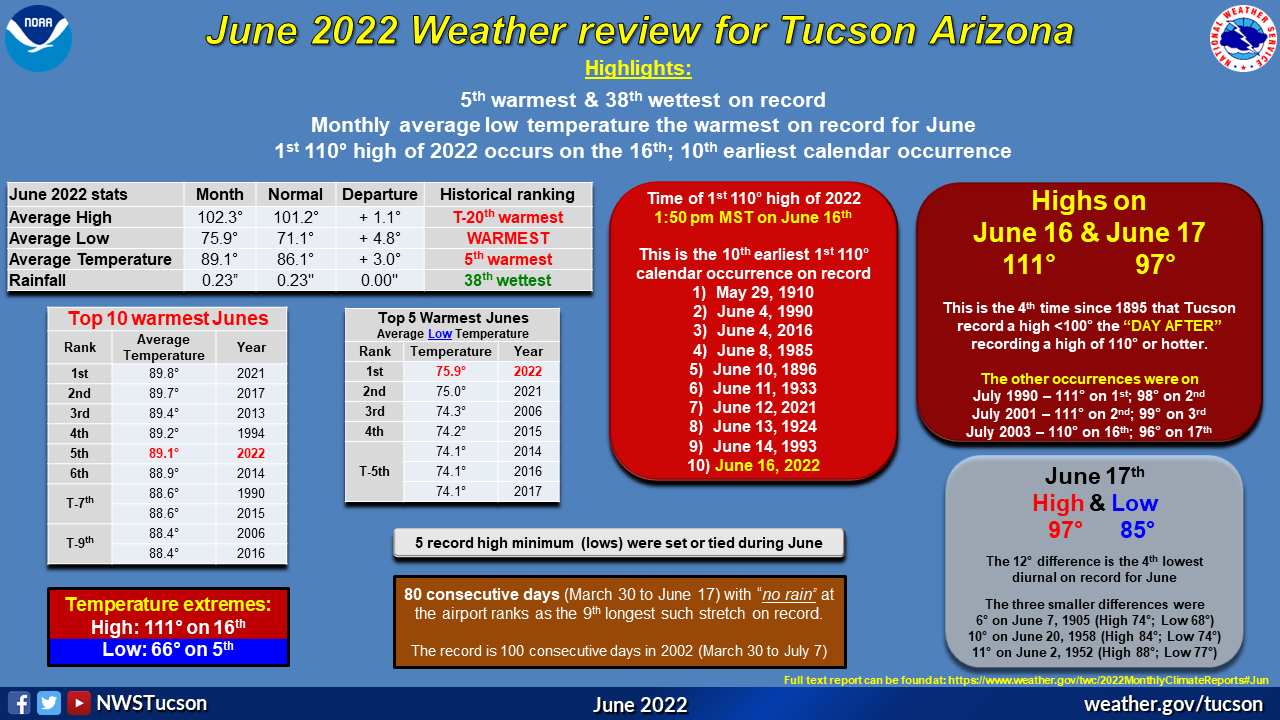
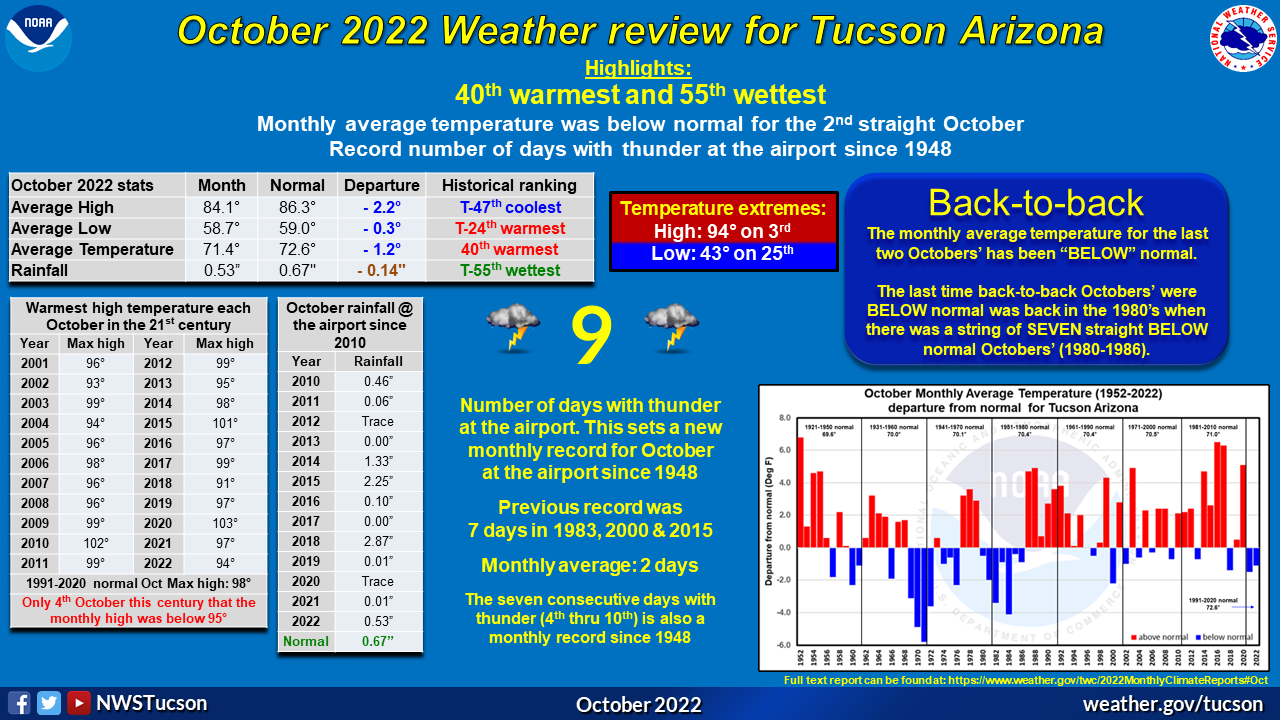
The metro area for most of the month remained under a favorable monsoon flow pattern that brought daily round of showers and thunderstorms which produced strong gusty winds, heavy rain and flash flooding. One of the strongest thunderstorms of the month hit the airport on the evening of the 23rd with a wind gust of 76 mph. This is the highest wind gust, tied with August 11, 1995, to be recorded at the airport in the past 50 years. The deep monsoonal moisture that was over the area for most of the month started to dry out during the last week of the month under a drier upper air pattern.
|
| |
|
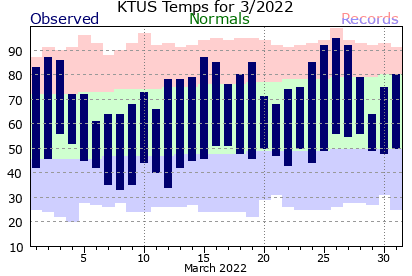
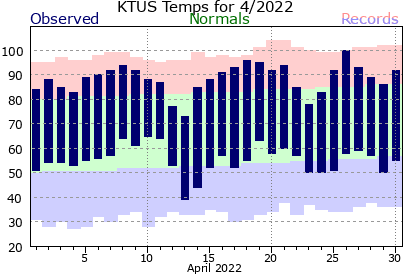
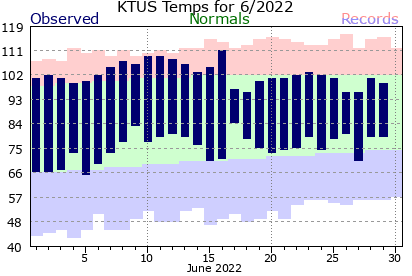
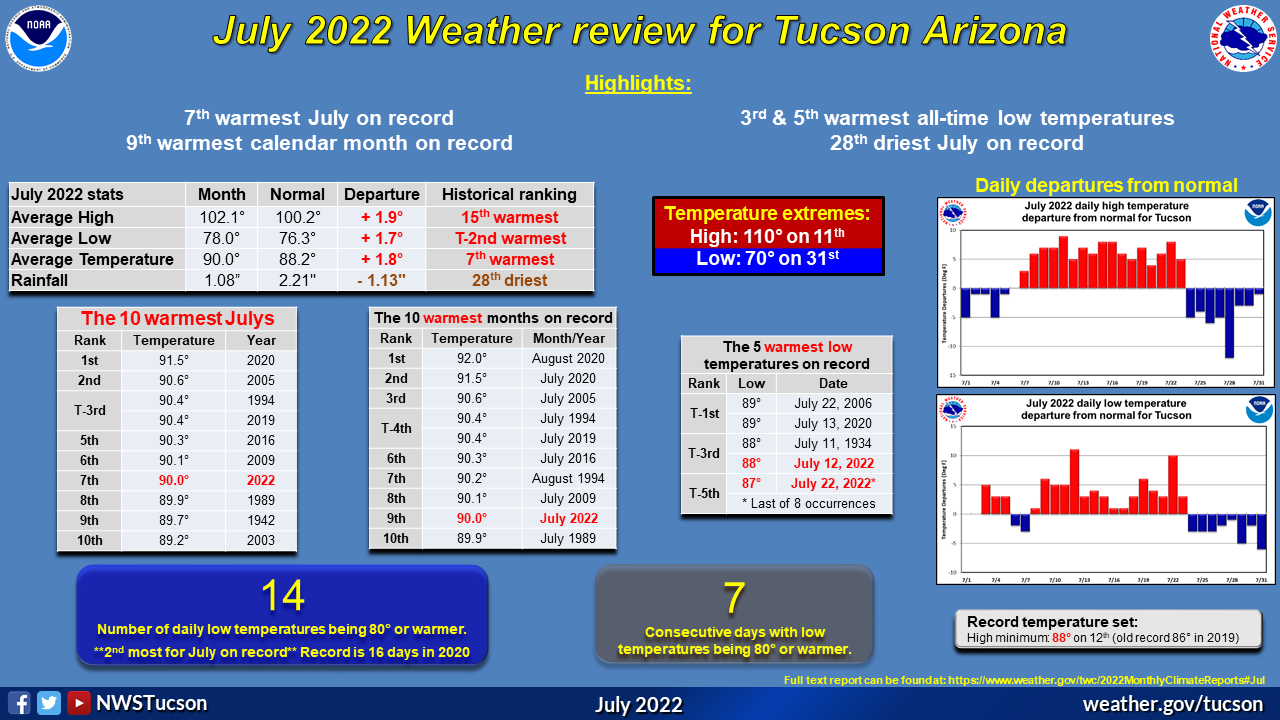
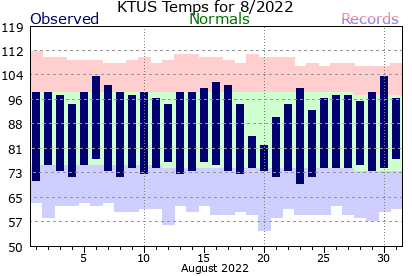
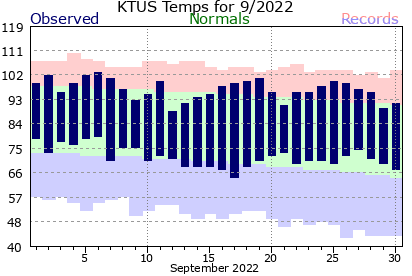
The monthly average temperature of 85.8° is 1.1° BELOW normal ranks as the 38th warmest August on record. Combined with last years August average temperature being 1.2° below normal, this is the first back-to-back Augusts since 2005-06 to be below normal. Temperature extremes for the month ranged from a high of 104° on the 6th and 30th to a low of 70° on the 23rd. There were only seven days that recorded triple digit highs, which is eight days below the normal of 15 days for August. The number could've been higher as there were eight days that recorded a high of 99°. For an oddity record, the eight days with a high of 99° is the most on record for the month of August & any calendar month dating back to 1895. One temperature record was set during the month when the high of 85° on the 19th set a daily cool high record, besting the old record of 86° from 1966. The high temperature of 82° on the 20th marked the first August since 2007 that recorded back-to-back days with highs in the 80's.
|
| |
|
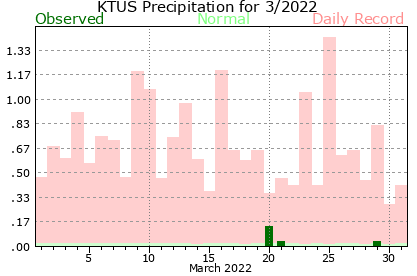
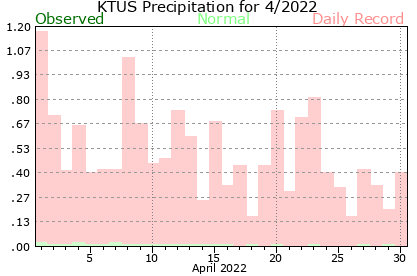
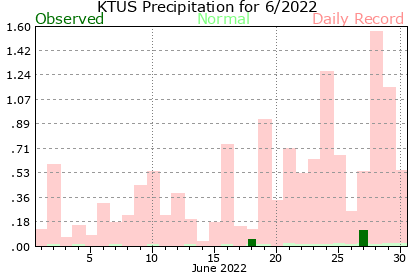
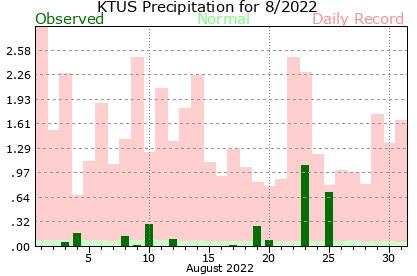
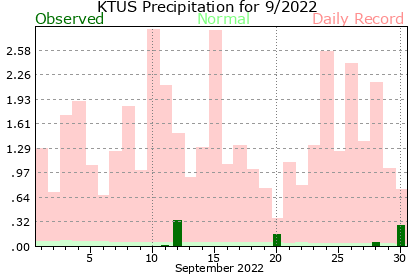
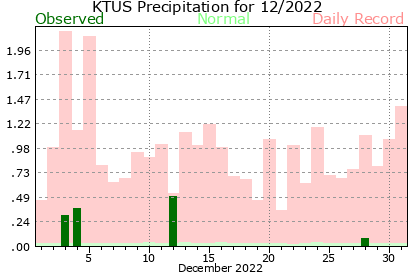
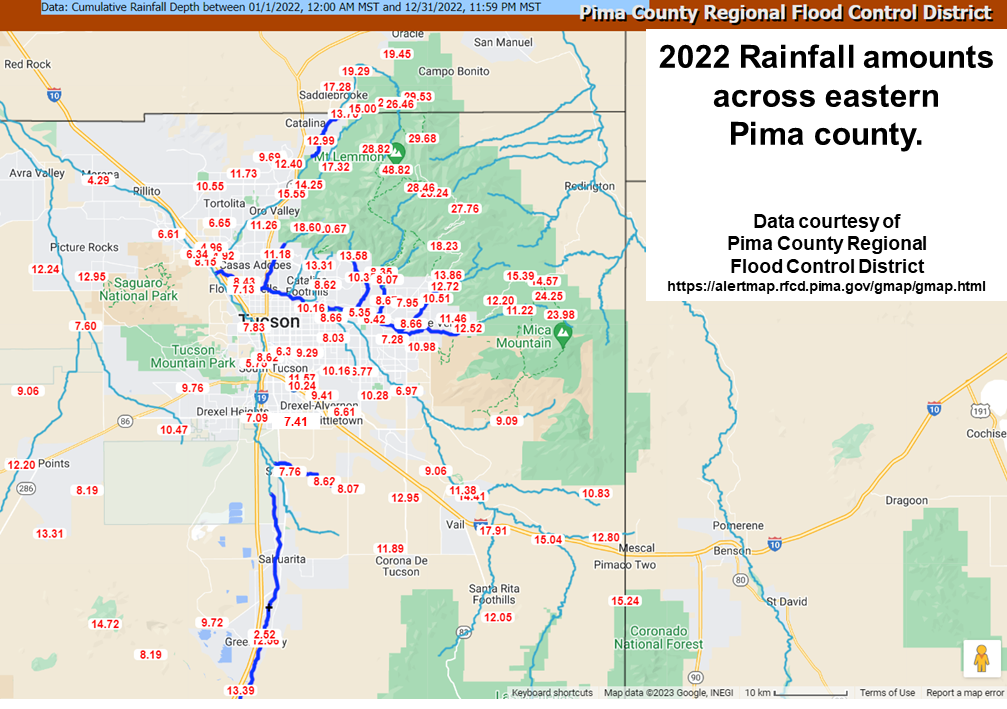
Rainfall amounts, using several sources like rainlog.org, the Pima County Regional Flood Control District gages and CoCoRaHS, varied widely across the metro area which is always the case during the summer thunderstorm season. Amounts ranged from 1.00" to 4.50" with localized amounts up to 6.50". The International airport, which is the official recording spot in Tucson, recorded 2.82" which is just over eight-tenths of an inch above normal and ranks as the 34th wettest August on record. Combined with last years August total of 3.85", this is the first back-to-back Augusts since 2005-06 to be above normal.
|
| |
| August 2022 stats |
Month
|
Normal
|
Departure
|
| Average high temperature |
97.2°
|
98.6°
|
- 1.4°
|
| Average low temperature |
74.4°
|
75.2°
|
- 0.8°
|
| Average temperature |
85.8°
|
86.9°
|
- 1.1°
|
| Days with highs 100° or hotter |
7
|
15
|
- 8
|
| Days with highs 105° or hotter |
0
|
5
|
- 5
|
| Days with highs 110° or hotter |
0
|
<1
|
0
|
| Days with lows 80° or warmer |
0
|
3
|
- 3
|
| Rainfall |
2.82"
|
1.98"
|
+ 0.84"
|
|
| |
|
| |
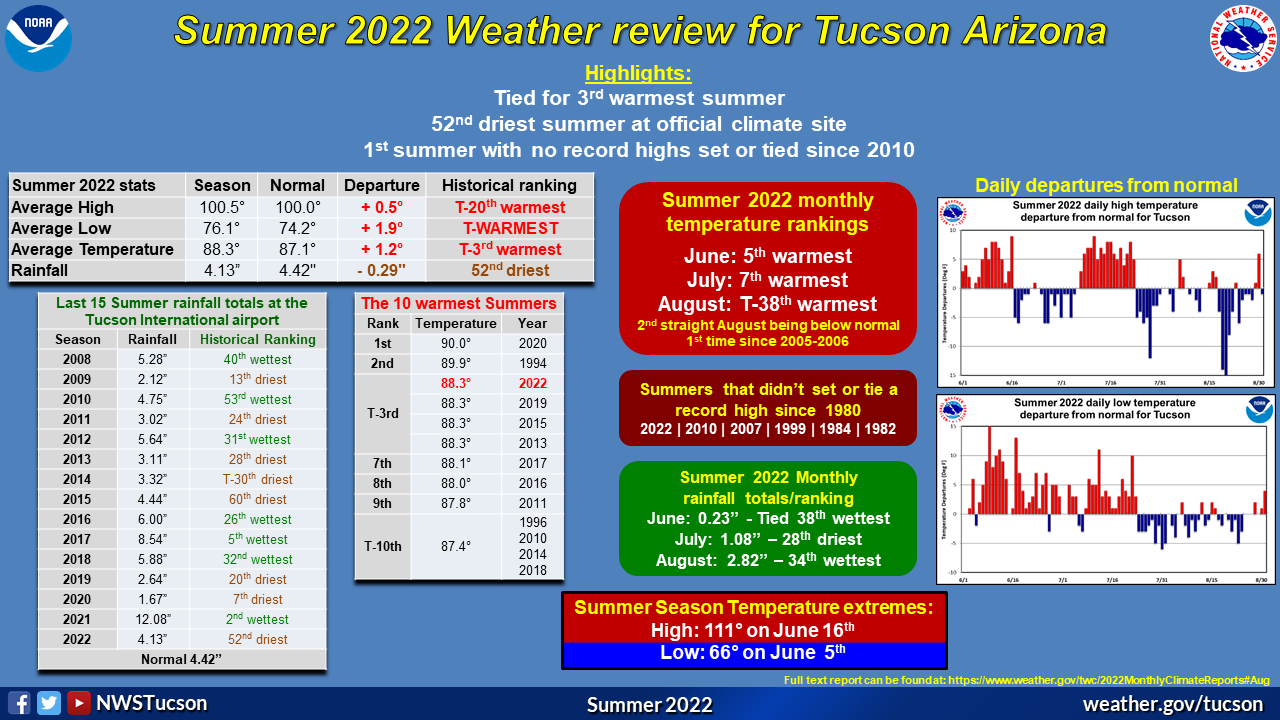
| Summer 2022 climate report for Tucson |
| 3rd warmest and 52nd driest on record |
| Warmest summer average low temperature on record tied |
| 2nd most number of days with daily low temperatures in the 80's |
| 1st summer with no record highs set or tied since 2010 |
| |
|
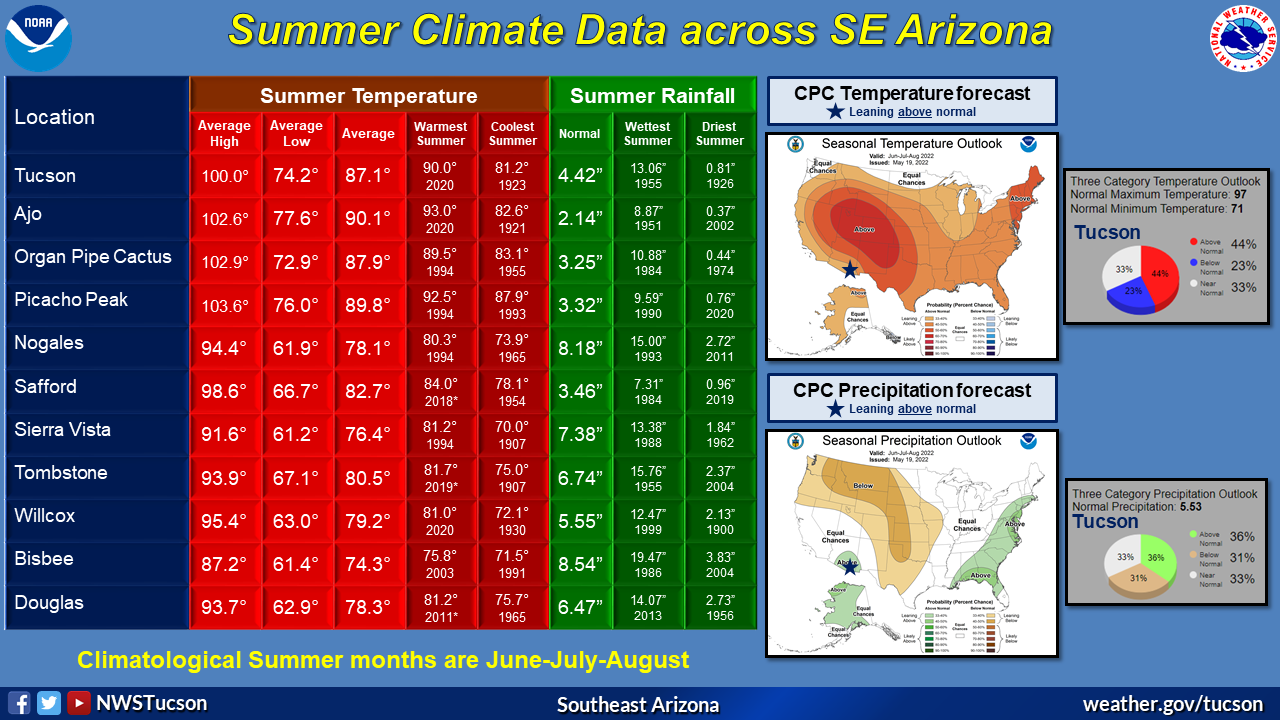
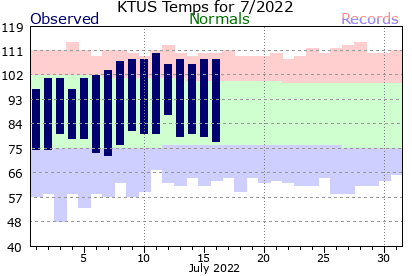
Backed by the 5th warmest June and 7th warmest July and the warmest Summer average low temperature on record (tied with 2020), Summer 2022 goes into the record books as the 3rd warmest Summer on record, tied with the Summers of 2013, 2015 & 2019. The average Summer temperature of 88.3° is 1.2° above normal and is well shy of the two warmest Summers on record (90.0° in 2020 & 89.9° in 1994).
Temperature extremes ranged from a high of 111° on June 16th to a low of 66° on June 5th. For the first Summer since 2010 & the sixth time since 1980, there were no record highs set or tied at the airport. There were 23 days in which the daily low temperature was in the 80s. This is the 2nd most number of days during Summer on record but well behind the record of 33 days set in 2020.
|
| |
|
As is usually the case during the summer thunderstorm season rainfall amounts, using several sources like rainlog.org, the Pima County Regional Flood Control District gages and CoCoRaHS, ranged widely from 3.00" to 9.00" with localized amounts between 9" and 11" along the lower elevations of the Catalina and Rincon mountains. The International airport, which is the official recording spot in Tucson, recorded 4.13" which ranks as the 52nd driest Summer on record.
|
| |
| Summer 2022 stats |
Season
|
Normal
|
Departure
|
| Average high temperature |
100.5°
|
100.0°
|
+ 0.5°
|
| Average low temperature |
76.1°
|
74.2°
|
+ 1.9°
|
| Average temperature |
88.3°
|
87.1°
|
+ 1.2°
|
| Days with highs 100° or hotter |
52
|
55
|
- 3
|
| Days with highs 105° or hotter |
23
|
24
|
- 1
|
| Days with highs 110° or hotter |
2
|
2
|
0
|
| Days with lows 80° or warmer |
23
|
11
|
+12
|
| Rainfall |
4.13"
|
4.42"
|
- 0.29"
|
|
| |
|
| 2022 |
|
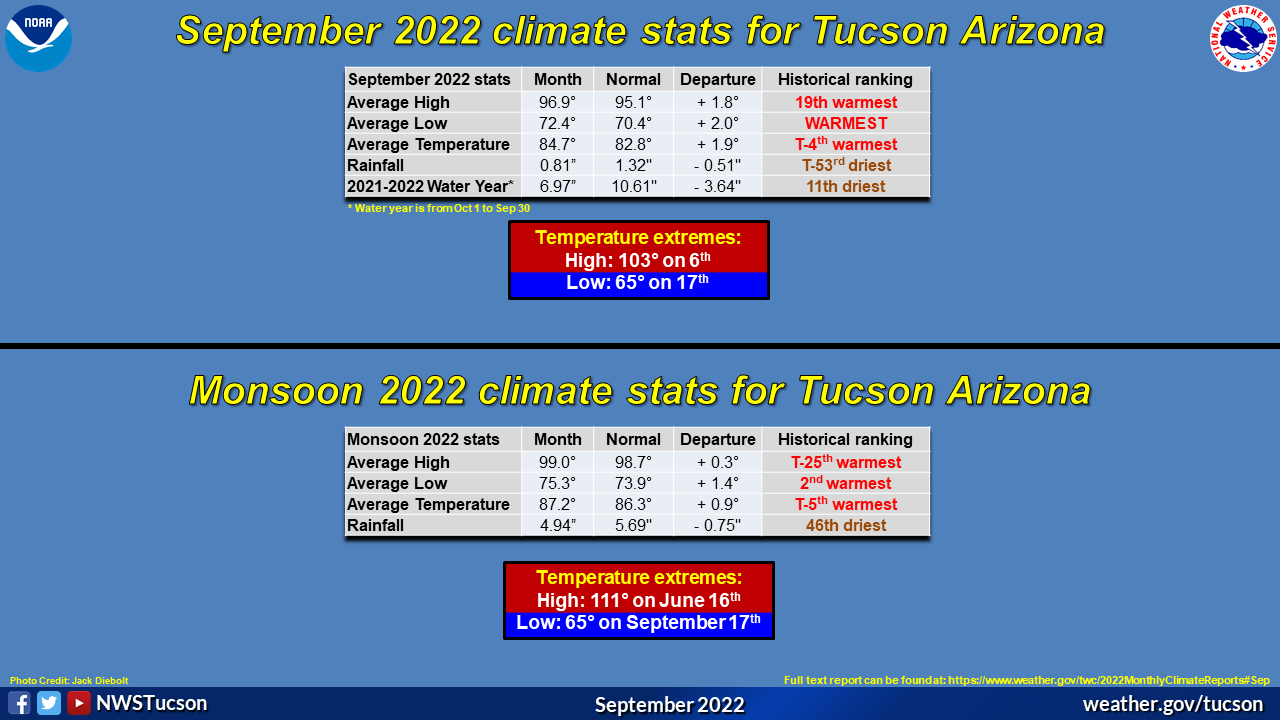
The average yearly temperature, through the end of August, of 73.5° is 1.0° above normal and ranks as the 6th warmest on record. Rainfall at the Tucson International airport, the official location in Tucson, of 4.80" is just under two & a third inches below normal and ranks as the 19th driest January through August period on record. The water year is below normal since October 1st at 6.16" which ranks as the 17th driest water year to date with one month left in the water year calendar.
|
| |
| 2022 stats thru August |
Year
|
Normal
|
Departure
|
| Average high temperature |
87.9°
|
86.0°
|
+ 1.9°
|
| Average low temperature |
59.0°
|
58.9°
|
+ 0.1°
|
| Average temperature |
73.5°
|
72.5°
|
+ 1.0°
|
| Days with highs 100° or hotter |
58
|
59
|
- 1
|
| Days with highs 105° or hotter |
24
|
25
|
- 1
|
| Days with highs 110° or hotter |
2
|
2
|
0
|
| Days with lows 80° or warmer |
23
|
11
|
+ 12
|
| Rainfall |
4.80"
|
7.10"
|
- 2.30"
|
| Water year rainfall (Oct-Aug) |
6.16"
|
9.29"
|
- 3.13"
|
|
| |
|
| |
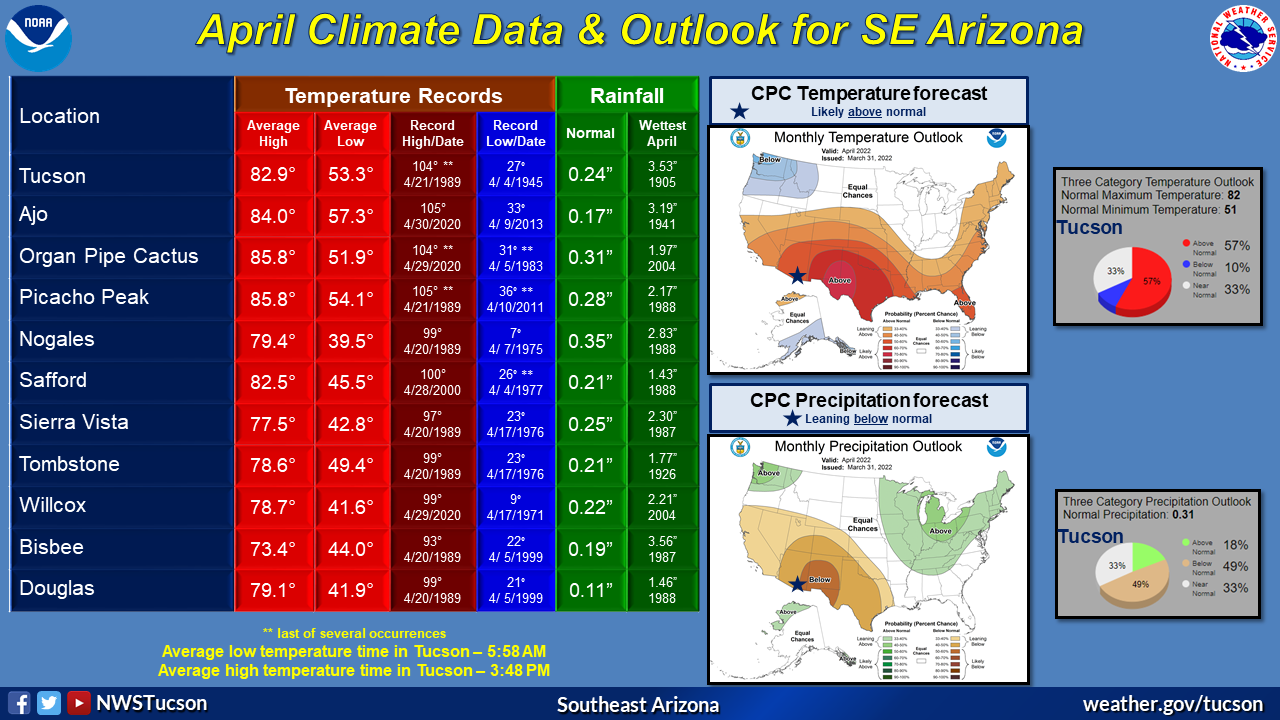
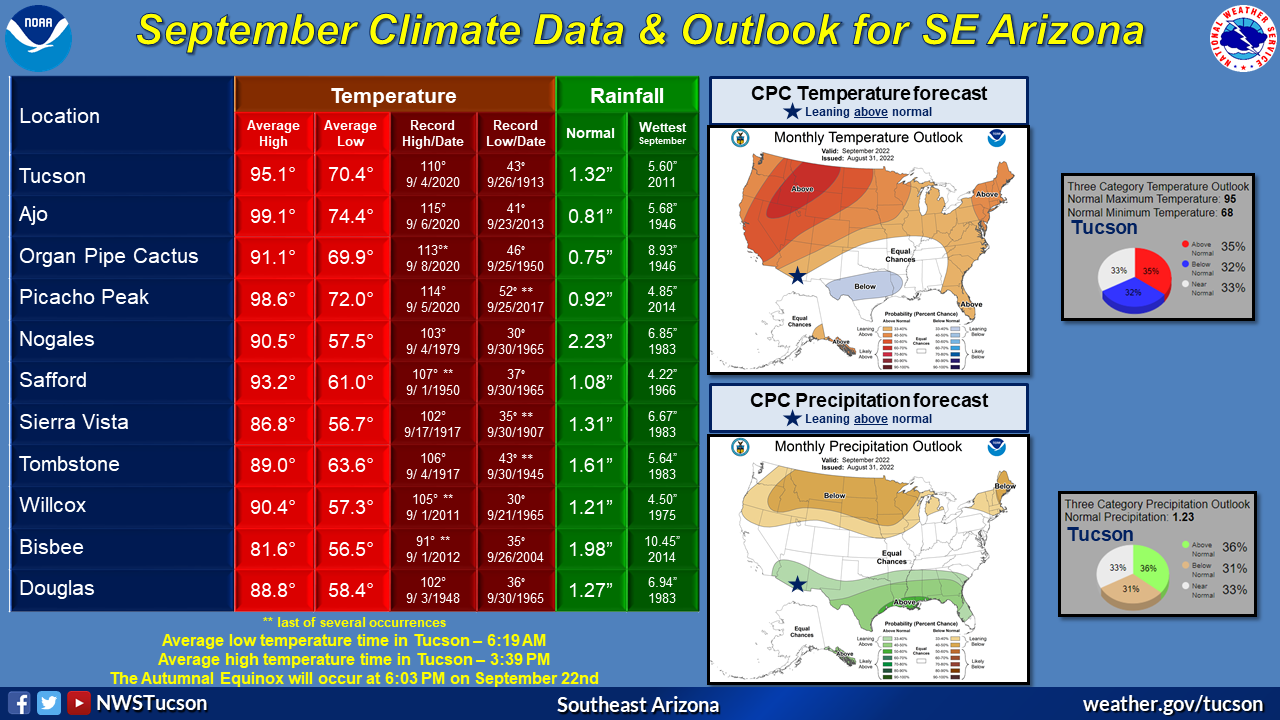
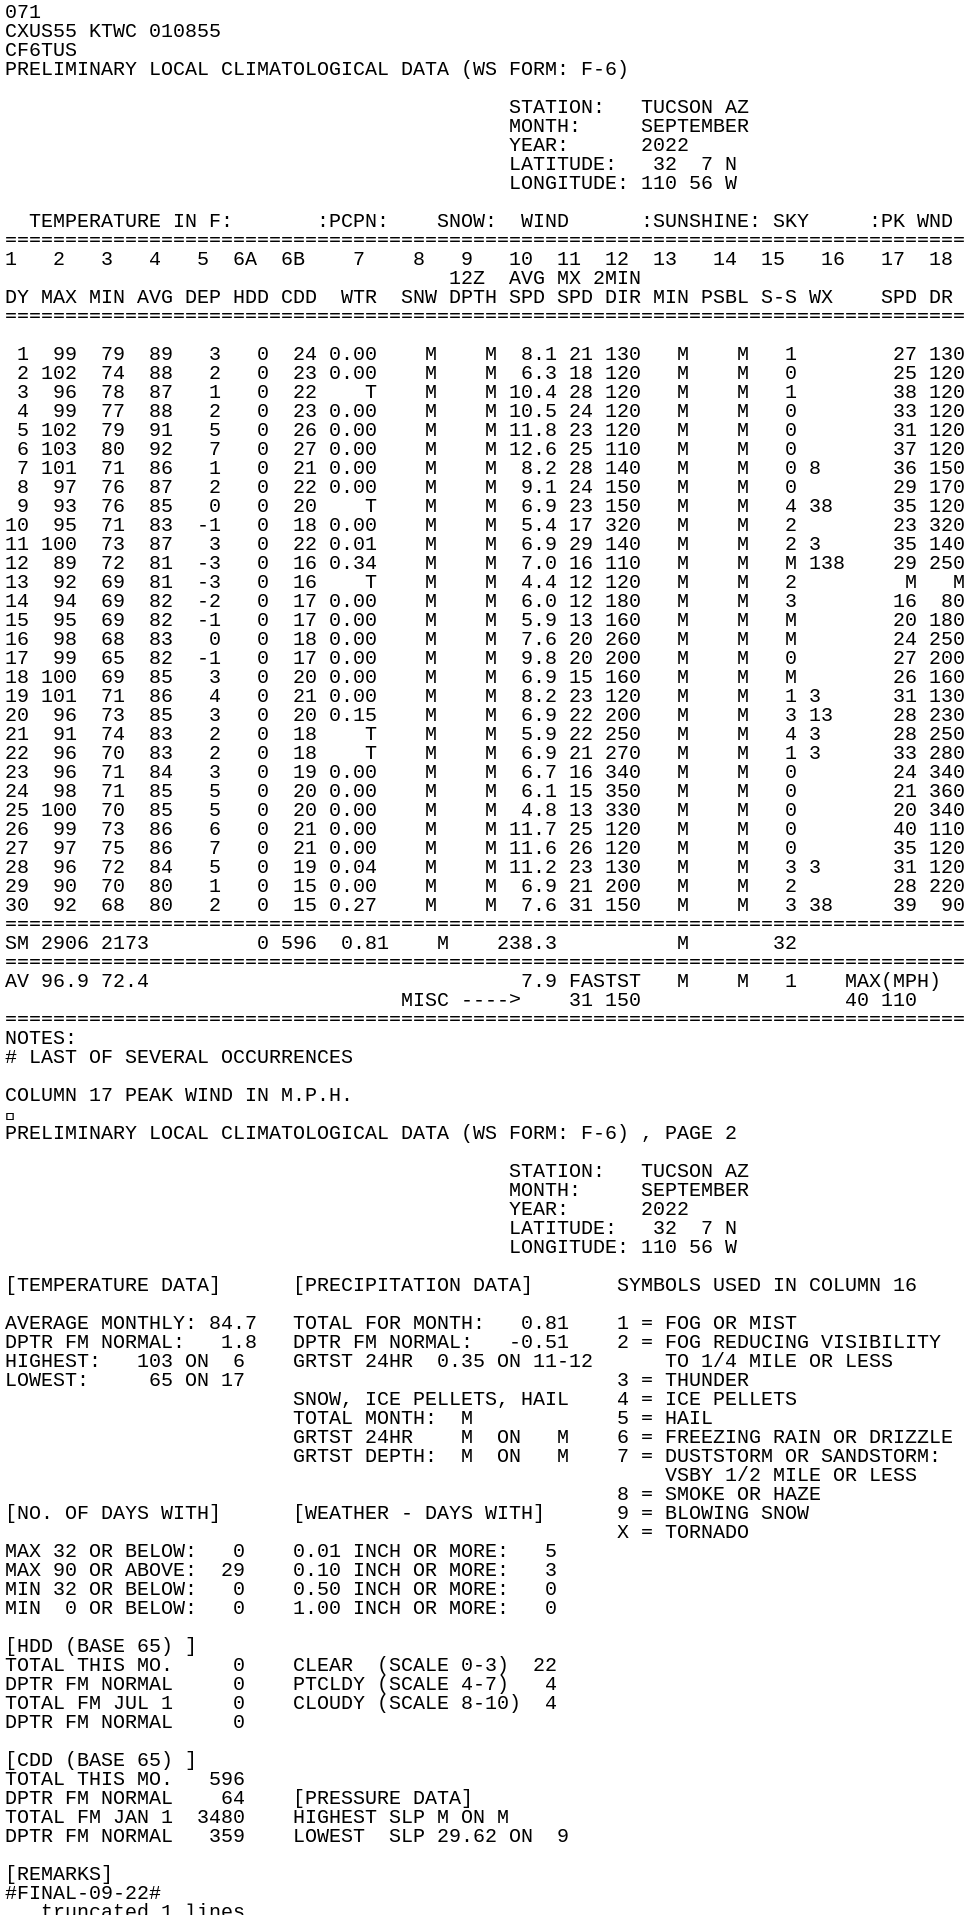
| Looking ahead into September |
|
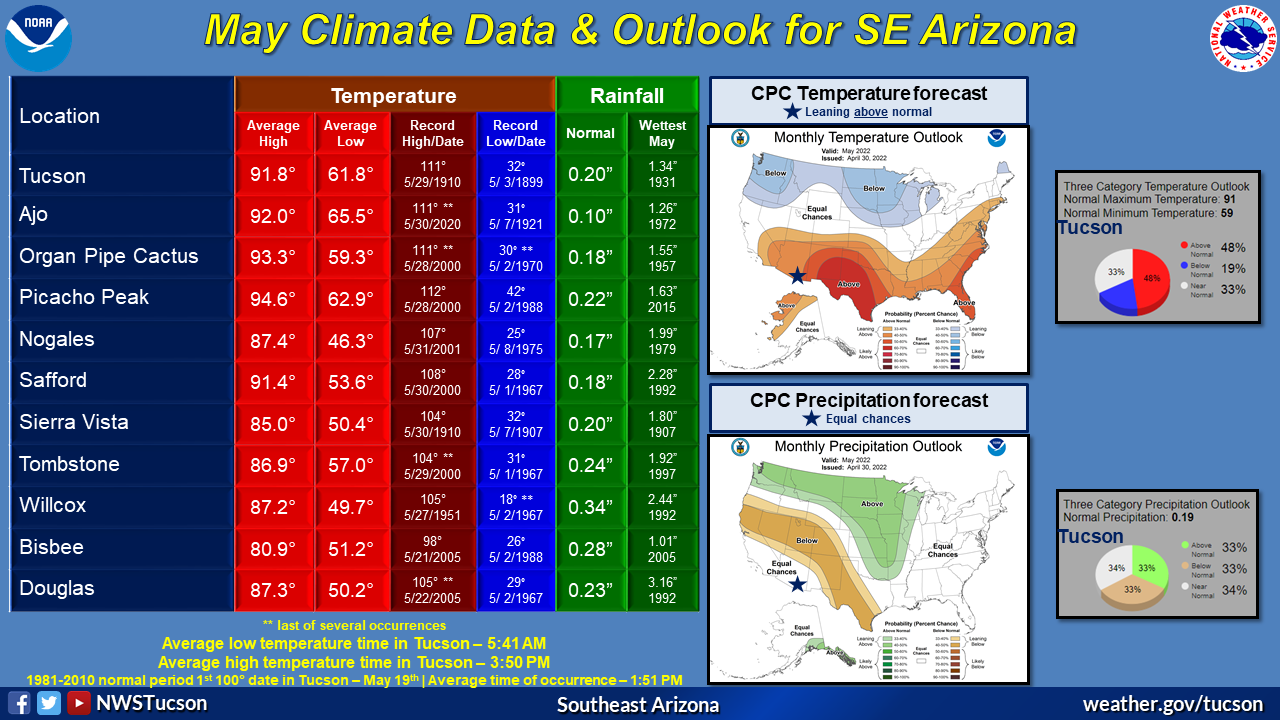
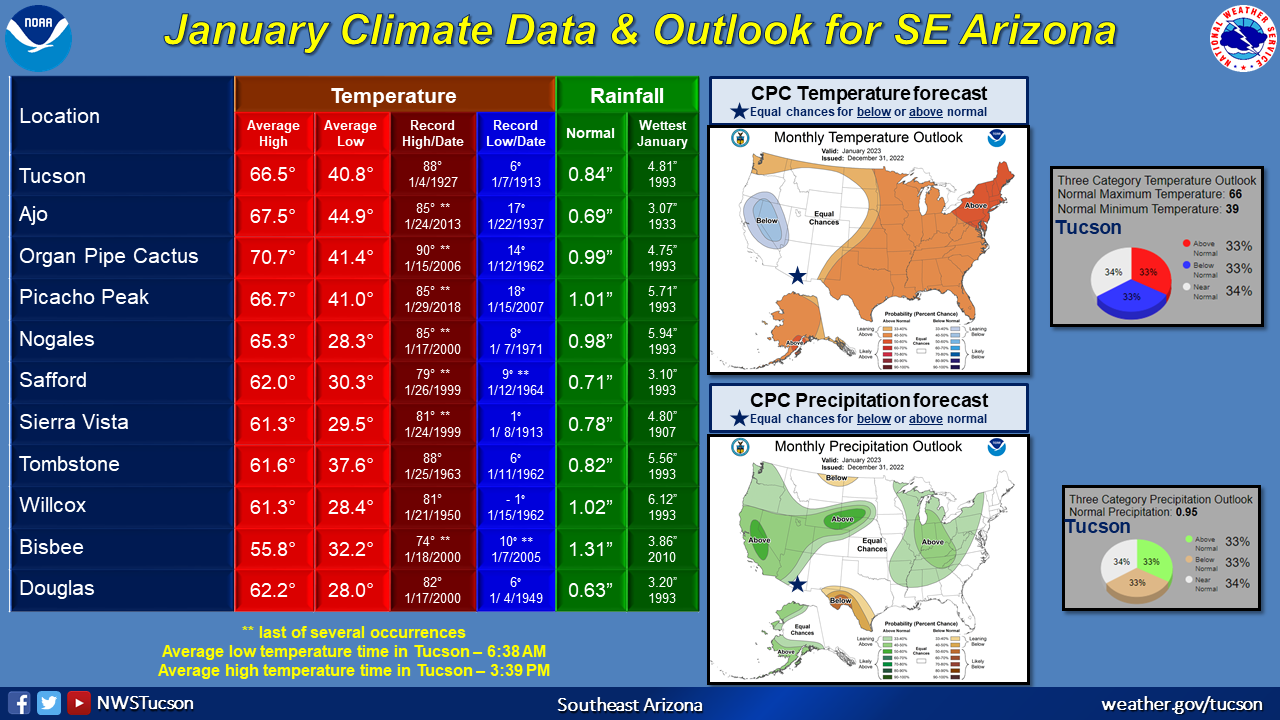
The Climate Prediction Center forecasts for temperature a 35% chance that they will end up above normal and a 32% chance that they will end up below normal. The forecast for precipitation is a 36% chance that they will be above normal and a 31% chance that they will end up below normal.
|
| |
| Normal monthly high temperature |
95.1° |
| Normal monthly low temperature |
70.4° |
| Normal monthly temperature |
82.8° |
| Record high temperature |
110° on September 4, 2020 |
| Record low temperature |
43° on September 26, 1913 |
| Warmest September (avg.) |
85.7° in 2020 |
| Coldest September (avg.) |
76.3° in 1964 |
| Normal rainfall |
1.32" |
| Wettest September day |
2.85" on September 10, 1964 |
| Wettest September |
5.60" in 2011 |
| Driest September |
0.00" in 1953 & 2020 |
| Daily normals | Daily records |
|
|
| The number of daylight hours will decrease from 12 hours 48 minutes and 46 seconds on the 1st to 11 hours 52 minutes and 27 seconds on the 30th, a loss of 56 minutes 19 seconds. |
| |
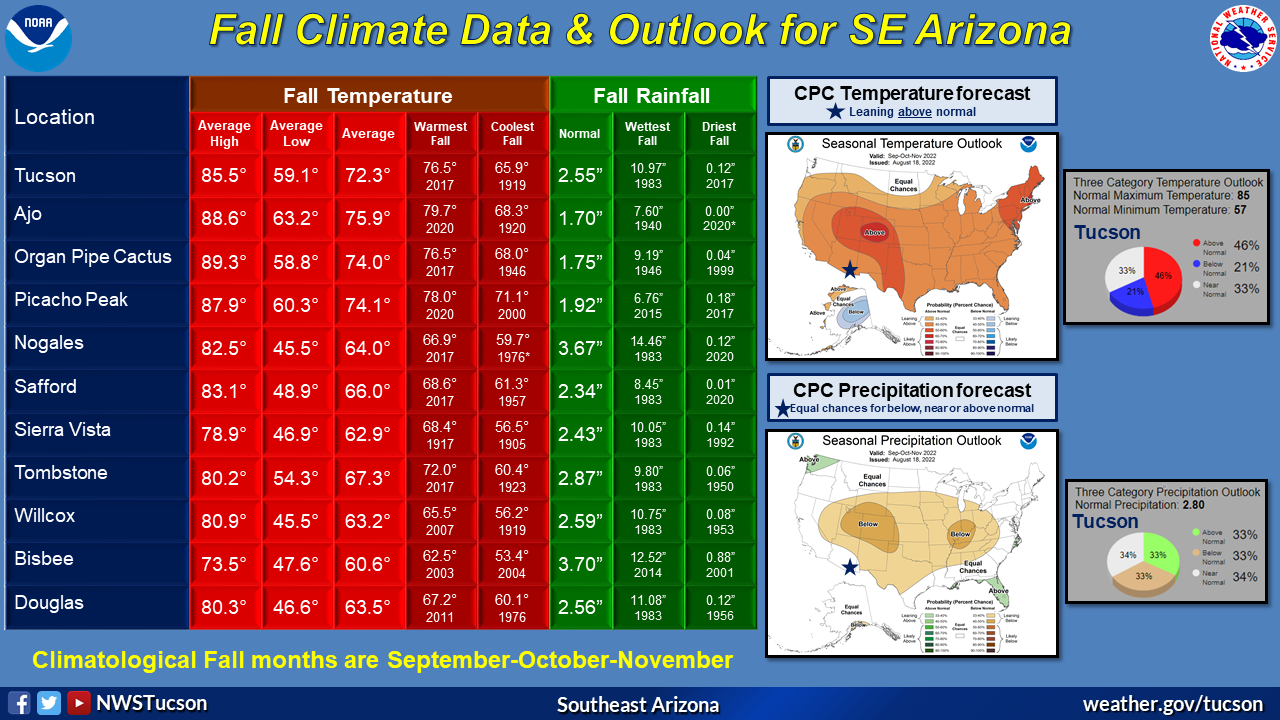
| Looking ahead into Fall |
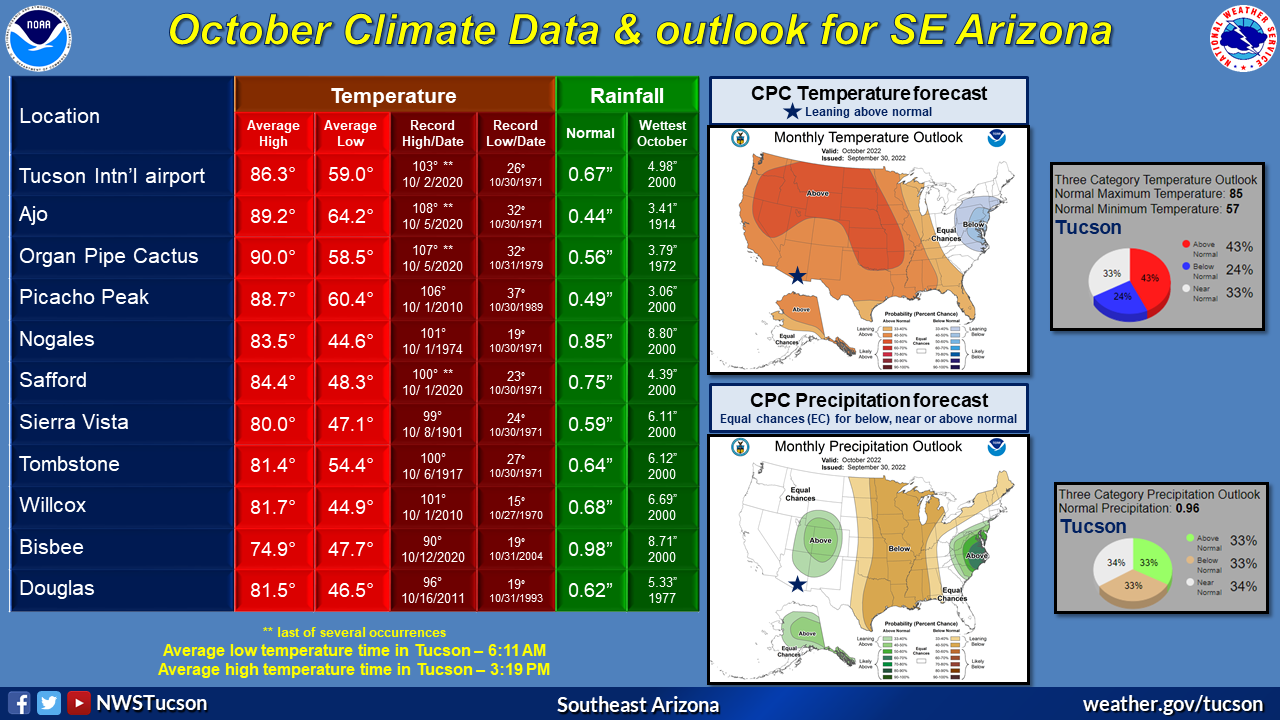
| The Climate Prediction Center forecasts for temperature a 46% chance that they will end up above normal and a 21% chance that they will end up below normal. The forecast for precipitation is a 33% chance that they will be above normal and a 33% chance that they will end up below normal. |
| |
| Normal seasonal high temperature |
85.5° |
| Normal seasonal low temperature |
59.1° |
| Normal seasonal temperature |
72.3° |
| Warmest Fall (avg.) |
76.5° in 2017 |
| Coldest Fall (avg.) |
66.0° in 1919, 1923 & 1972 |
| Normal Fall rainfall |
2.55" |
| Wettest Fall |
10.97" in 1983 |
| Driest Fall |
0.12" in 2017 |
| |
|
|
| The autumnal equinox, otherwise known as the beginning of fall, will occur on September 22nd at 6:03 PM when the sun begins to cross the equator into the southern hemisphere. |
| |
| Glueck |


 for Tucson Arizona")


