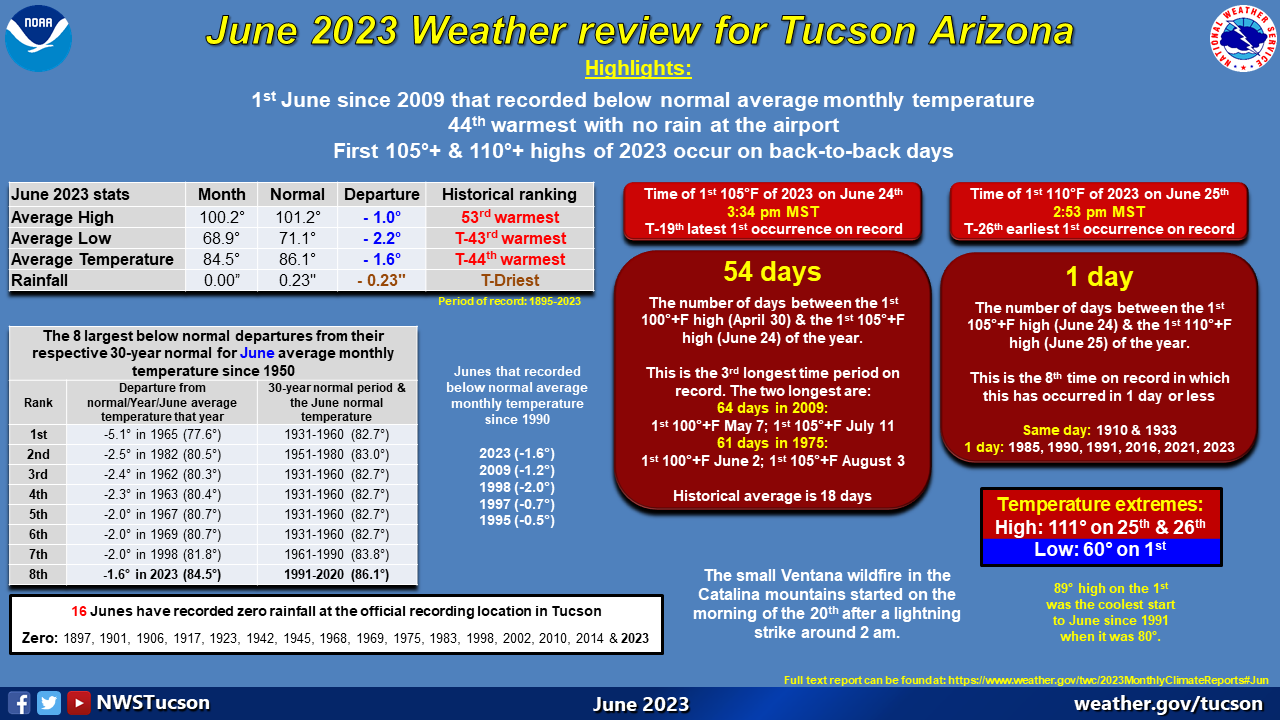
| July 2023 climate report for Tucson |
| HOTTEST & 61st wettest on record |
| Numerous July, calendar month and yearly records set or tied |
| 2nd calendar month to record triple-digit highs every day |
| Strong to severe thunderstorms pummel portions of the area on several days |
| |
| Relentless record-setting heat, thanks to a dome of high pressure over the desert southwest, and a late starting monsoon that had a several strong to severe thunderstorm days but overall was lackluster, were the main stories for the month. |
| |
|
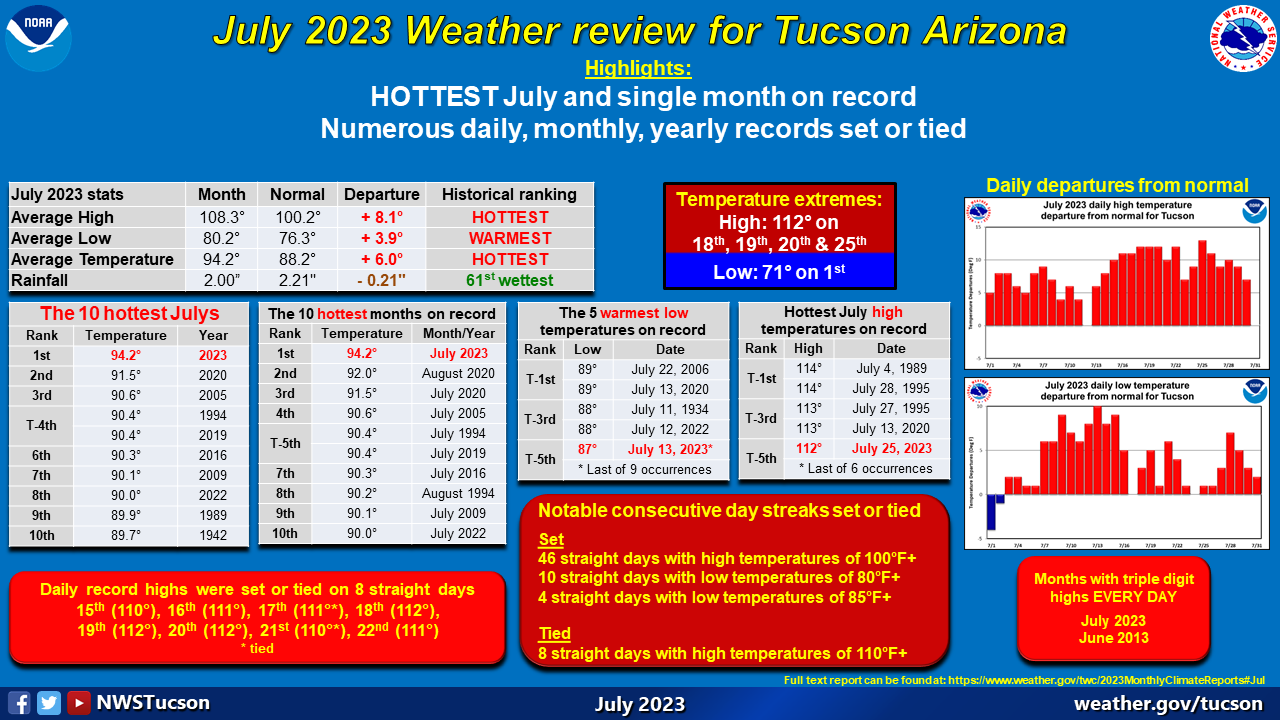
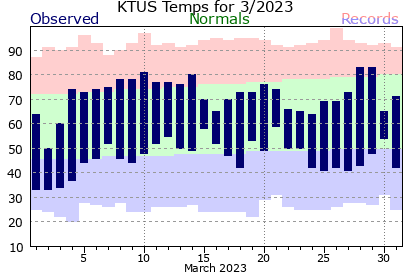
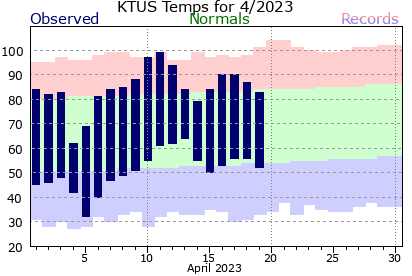
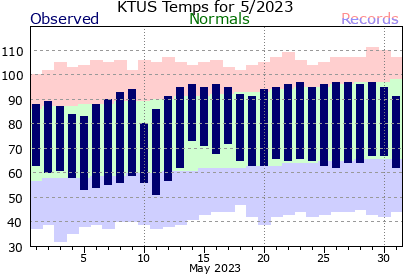
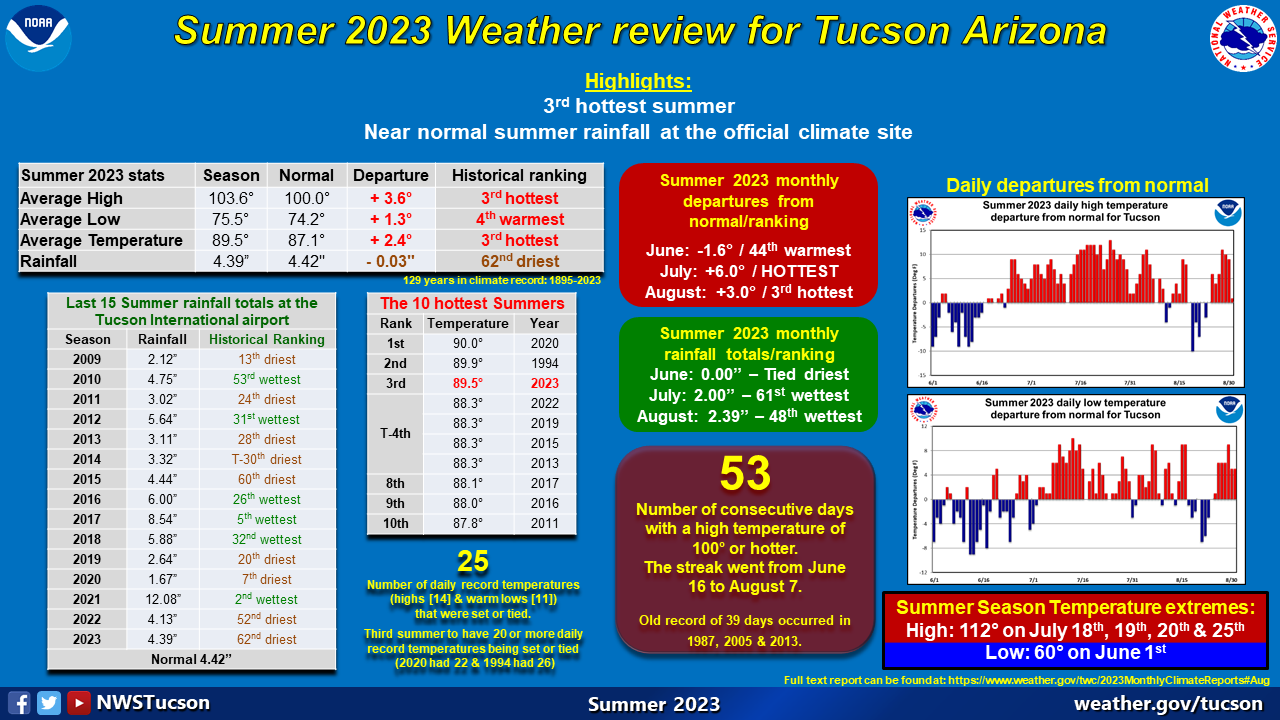
The monthly average temperature of 94.2° is a whopping 6.0° ABOVE normal and ranks as the following:
- the HOTTEST July on record, shattering the previous July record of 91.5° from 2020, and
- the HOTTEST single month on record, shattering the old record of 92.0° from August 2020.
Temperature extremes for the month ranged from a high of 112° on the 18th, 19th, 20th & 25th to a low of 71° on the 1st.
|
| |
|
Below is an extensive listing of July temperature records that were set or tied:
|
- Hottest with an average temperature of 94.2° (old record 91.5° from 2020)
- Hottest average monthly high temperature of 108.4° (old record 105.1° from 1994)
- Warmest average monthly low temperature 80.0° (old record 79.0° from 2020)
- Set daily high temperature on 6th: 110° (old record 109° from 1989, 2005 & 2017)
- Tied daily high temperature on 15th: 110° (previously set in 1997 & 1998)
- Set daily high temperature on 16th: 111° (old record 110° from 2003 & 2009)
- Tied daily high temperature on 17th: 111° (previously set in 2005)
- Set daily high temperature on 18th: 112° (old record 109° from 1989 & 1992)
- Set daily high temperature on 19th: 112° (old record 109° from 2009)
- Set daily high temperature on 20th: 112° (old record 109° from 1989)
- Tied daily high temperature on 21st: 110° (previously set in 2006)
- Set daily high temperature on 22nd: 111° (old record 108° from 2006)
- Set daily high temperature on 25th: 112° (old record 110° from 2018)
- Tied daily high minimum temperature on 14th: 85° (previously set in 1925, 1936 & 2010)
- Tied daily high minimum temperature on 15th: 86° (previously set in 1979)
- Set daily high minimum temperature on 21st: 83° (old record 82° from 1932, 2004 & 2005)
- Tied daily high minimum temperature on 28th: 83° (previously set in 2000 & 2019)
- Set monthly occurrences of high temperatures 100° or hotter: 31 days (old record 28 days from 1920 & 1942)
- Set monthly occurrences of high temperatures 105° or hotter: 29 days (old record 23 days from 1994)
- Set monthly occurrences of high temperatures 110° or hotter: 14 days (old record 5 days from 1989)
- Tied monthly occurrences of low temperatures 80° or warmer: 16 days (previously set in 2020)
- Set monthly occurrences of low temperatures 85° or warmer: 5 days (old record 4 days from 2010)
- Set consecutive days with high temperatures 100° or hotter: 31 days (old record 22 days in 2005, 1st to 22nd)
- Set consecutive days with high temperatures 105° or hotter: 18 days from 13th to 30th (old record 16 days in 1994, 1st to 16th)
- Set consecutive days with high temperatures 110° or hotter: 8 days from 15th to 22nd (old record 4 days from 1995, 26th to 29th)
- Set consecutive days with low temperatures 80° or warmer: 10 days from 7th to 16th (old record 9 days from 2020, 7th to 15th)
- Set consecutive days with low temperatures 85° or warmer: 4 days from 12th to 15th (old record 2 days from July 1915, July 2006, July 2007 & July 2018)
- The monthly low temperature of 71° occurred on the 1st. Only three other Julys (2013, 2014 & 2015) had a monthly low temperature as warm as 71°. Yeah, an odd record to be recognized.
Although not a monthly record, the four days with highs of 112° (18th, 19th, 20th & 25th) rank, tied, as the 5th hottest July days on record.
Although not a monthly record, the low temperature of 87° on the 13th ranks tied as the 5th warmest July low temperature on record.
|
| |
|
Below is an extensive listing of monthly temperature records that were set or tied in July:
|
- Hottest month: July 2023 with average temperature of 94.2° (old record 92.0° from August 2020)
- Hottest average monthly high temperature of 108.4° (old record 105.7° from June 1990)
- Warmest average monthly low temperature 80.0° (old record 78.7° from August 2020)
- Set monthly occurrences of high temperatures 100° or hotter: 31 days (old record 30 days from August 1994 and June 2013)
- Set monthly occurrences of high temperatures 105° or hotter: 29 days (old record 24 days from August 2020)
- Set monthly occurrences of high temperatures 110° or hotter: 14 days (old record 9 days from June 1990)
- Tied monthly occurrences of low temperatures 80° or warmer: 16 days (previously set in July 2020 & August 2020)
- Set monthly occurrences of low temperatures 85° or warmer: 5 days (old record 4 days from July 2010)
- Set consecutive days with high temperatures 100° or hotter: 31 days (old record 29 days August 1994, 1st to 29th)
- Set consecutive days with high temperatures 105° or hotter: 18 days from July 13th to 30th (old record 16 days from July 1994, 1st to 16th)
- Tied consecutive days with high temperatures 110° or hotter: 8 days from July 15th to 22nd (previously set in June 2021, 12th to 19th)
- Set consecutive days with low temperatures 80° or warmer: 10 days from July 7th to 16th (old record 9 days from June 2017 & July 2020)
- Set consecutive days with low temperatures 85° or warmer: 4 days from July 12th to 15th (old record 2 days from July 1915, July 2006, July 2007 & July 2018)
- Set monthly occurrences of high temperatures 100° or hotter: 31 days (old record 30 days in June 2013 and August 1994)
|
| |
|
Below is an listing of yearly temperature records that were set or tied in July:
|
- Set consecutive days with high temperatures 100° or hotter: 46 days from June 16th to July 31st (old record 39 days from 1987, 2005 & 2013)
- Tied consecutive days with high temperatures 110° or hotter: 8 days from July 15th to 22nd (previously set in June 2021, 12th to 19th)
- Set consecutive days with low temperatures 80° or warmer: 10 days from July 7th to 16th (old record 9 days from June 2017 & July 2020)
- Set consecutive days with low temperatures 85° or warmer: 4 days from July 12th to 15th (old record 2 days from July 1915, July 2006, July 2007 & July 2018)
Although not a yearly record, the low temperature of 87° on the July 13th ranks tied as the 5th warmest low temperature overall on record.
|
| |
|
This years Monsoon started late, possibly due to increasing El Niño conditions, which led to below normal rainfall across most of the metro area. However, there were several noteworthy severe thunderstorm days/events that produced significant wind damage across parts of the metro area along with hail and brief heavy rainfall.
- 17th: Severe thunderstorms rolled through the area between 3 PM and 6 PM producing winds gusts of 58 mph at Davis-Monthan AFB, 60 mph at Marana regional airport, 64 mph at Tucson International Airport and 67 mph near Tanque Verde and Speedway, large hail (1"), and lots of wind damage to trees, power poles and structures across parts of the foothills. Up to 5,000 TEP customers lost power.
- 23rd: A severe thunderstorm hit the southwest part of the metro area between 630 PM and 730 PM producing damage to trees, power poles and structures. Up to 9,000 TEP customers lost power.
- 28th: A very intense thunderstorm rolled through the metro area producing wind gusts up to 70 mph, large hail up to 1.5, and wind damage to trees, power poles and structures. Up to 50,000 TEP customers were without power a one time.
- 31st: A line of severe thunderstorms moved through the metro area between 530 PM and 730 PM producing wind gusts to 58 mph at Tucson International Airport and 72 mph at Marana Regional Airport. Heavy rain accompanied these storms with up to 2" of rain in spots that led to localized flash flooding.
|
| |
|
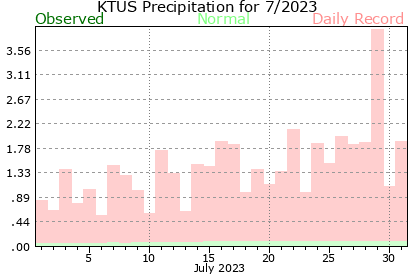
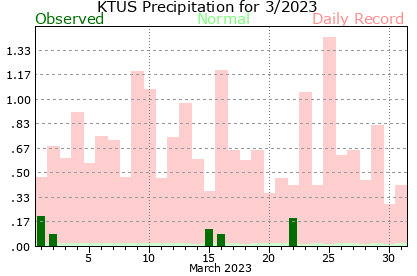
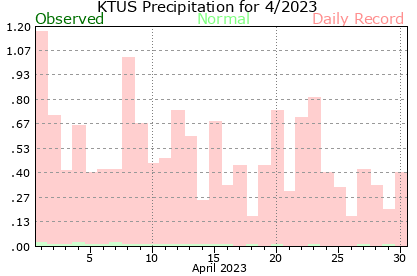
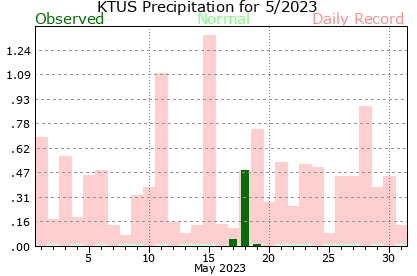
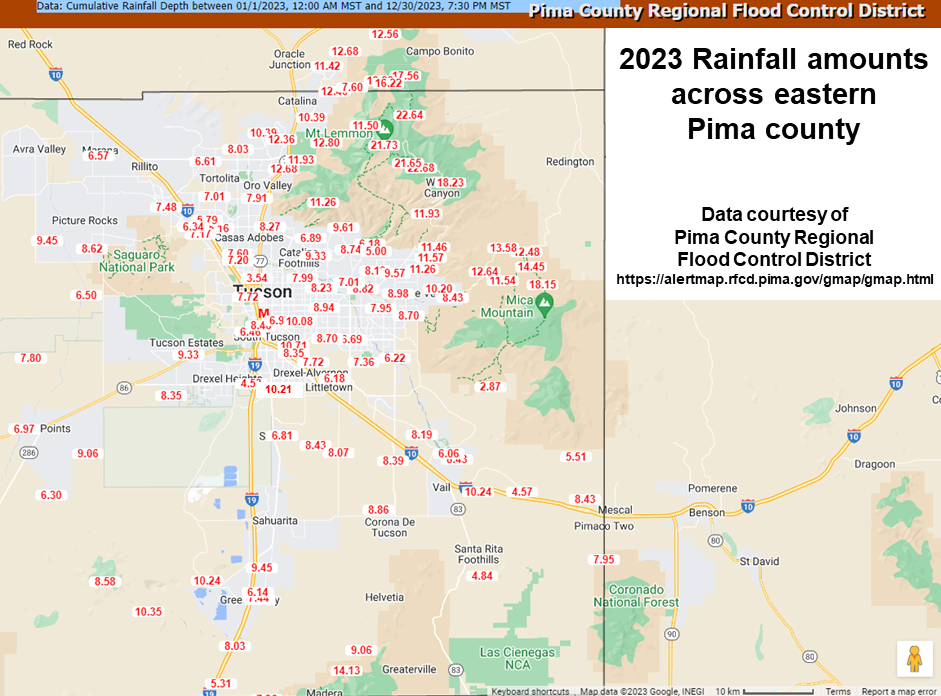
Rainfall amounts across the metro area, using several sources like rainlog.org, the Pima County Regional Flood Control District gages and CoCoRaHS, ranged widely from a tenth of an inch to 4.00". The International Airport, which is the official recording spot in Tucson, recorded 2.00" which is below normal and ranks as the ranks as the 61st wettest on record.
|
| |
| July 2023 stats |
Month
|
Normal
|
Departure
|
| Average high temperature |
108.4°
|
100.2°
|
+ 8.2°
|
| Average low temperature |
80.0°
|
76.3°
|
+ 3.7°
|
| Average temperature |
94.2°
|
88.2°
|
+ 6.0°
|
| Days with highs 100° or warmer |
31
|
19
|
+ 12
|
| Days with highs 105° or warmer |
29
|
9
|
+ 20
|
| Days with highs 110° or warmer |
14
|
1
|
+ 13
|
| Rainfall |
2.00"
|
2.21"
|
- 0.21"
|
|
Period of record: 129 years (1895-2023)
|
|
| |
|
| Monsoon 2023 |
|
Monsoon 2023 is running below below normal through the end of July with 2.00" being recorded at the Tucson International Airport. This ranks as the 63rd driest on record for the first 47 days of the monsoon. Rainfall totals across the Tucson metro area for the season so far ranged widely from a tenth of an inch to 4.00".
|
| |
|
| 2023 |
|
Coming into July, the 2023 average yearly temperature was running 1.2° below normal. After the hottest calendar month on record, the average yearly temperature stands at only one-tenth of a degree below normal.
The average yearly temperature, through the end of July, of 70.2° ranks as the 23rd warmest on record. Rainfall at the Tucson International Airport, the official location in Tucson, of 5.54" is around a half an inch above normal and ranks as the 54th wettest January through July period on record. The water year rainfall since October 1st of 7.34" is a smidge above normal and ranks as the 61st wettest water year to date with two months left in the water year calendar.
|
| |
| 2023 stats thru July |
Year
|
Normal
|
Departure
|
| Average high temperature |
84.5°
|
84.1°
|
+ 0.4°
|
| Average low temperature |
55.9°
|
56.5°
|
- 0.6°
|
| Average temperature |
70.2°
|
70.3°
|
- 0.1°
|
| Days with highs 100° or warmer |
49
|
44
|
+ 5
|
| Days with highs 105° or warmer |
36
|
20
|
+ 16
|
| Days with highs 110° or warmer |
16
|
2
|
+ 14
|
| Rainfall |
5.54"
|
5.12"
|
+ 0.43"
|
| Water year rainfall (Oct-Jul) |
7.34"
|
7.31"
|
+ 0.03"
|
|
Period of record: 129 years (1895-2023)
|
|
| |
|
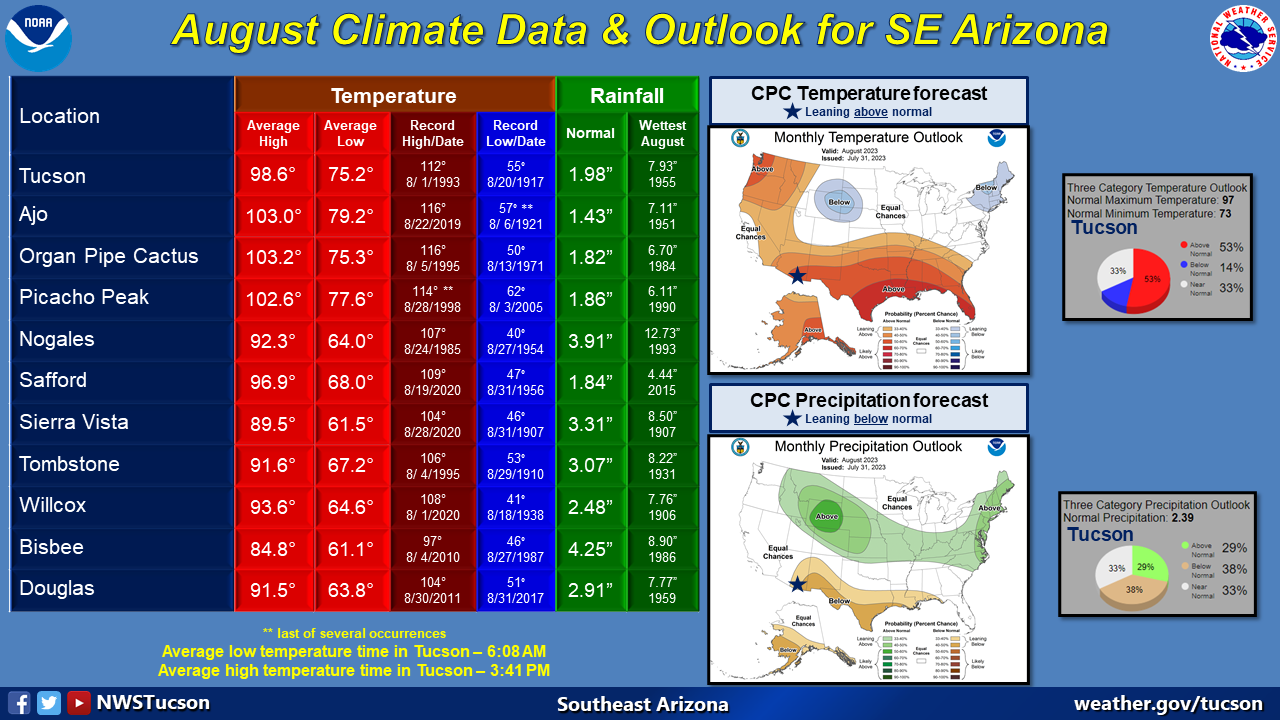
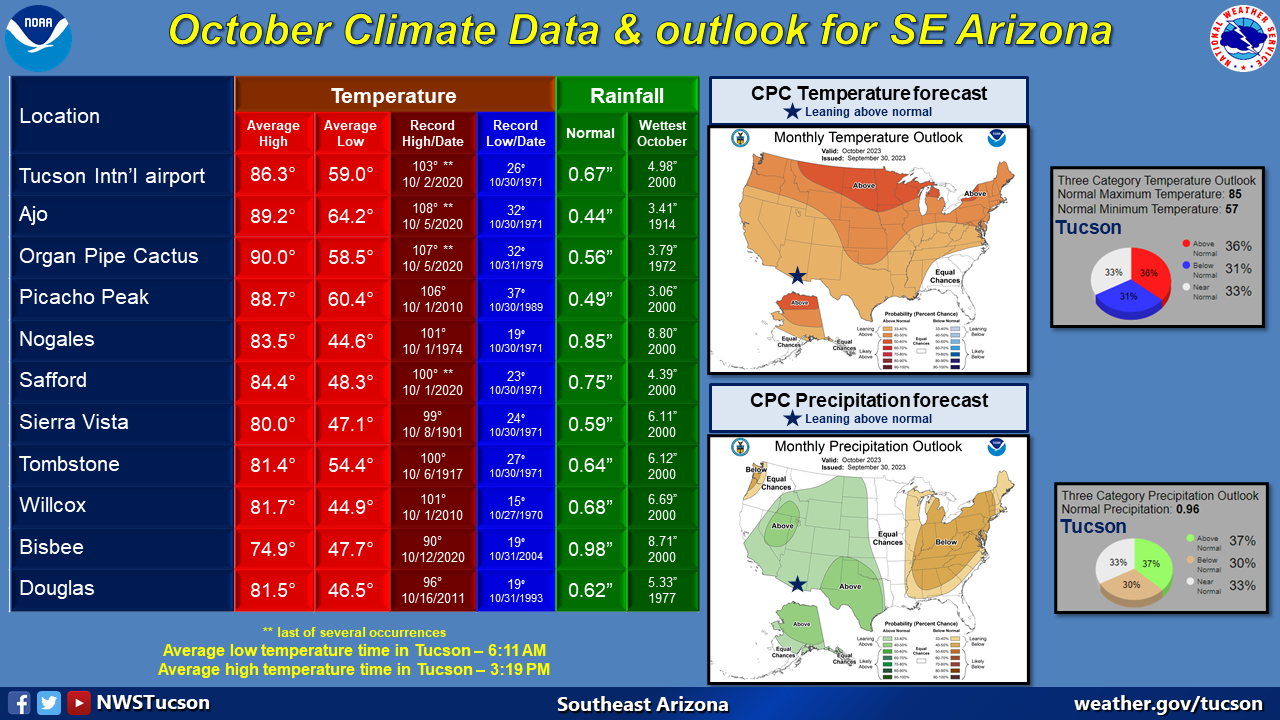
| Looking ahead into August |
|
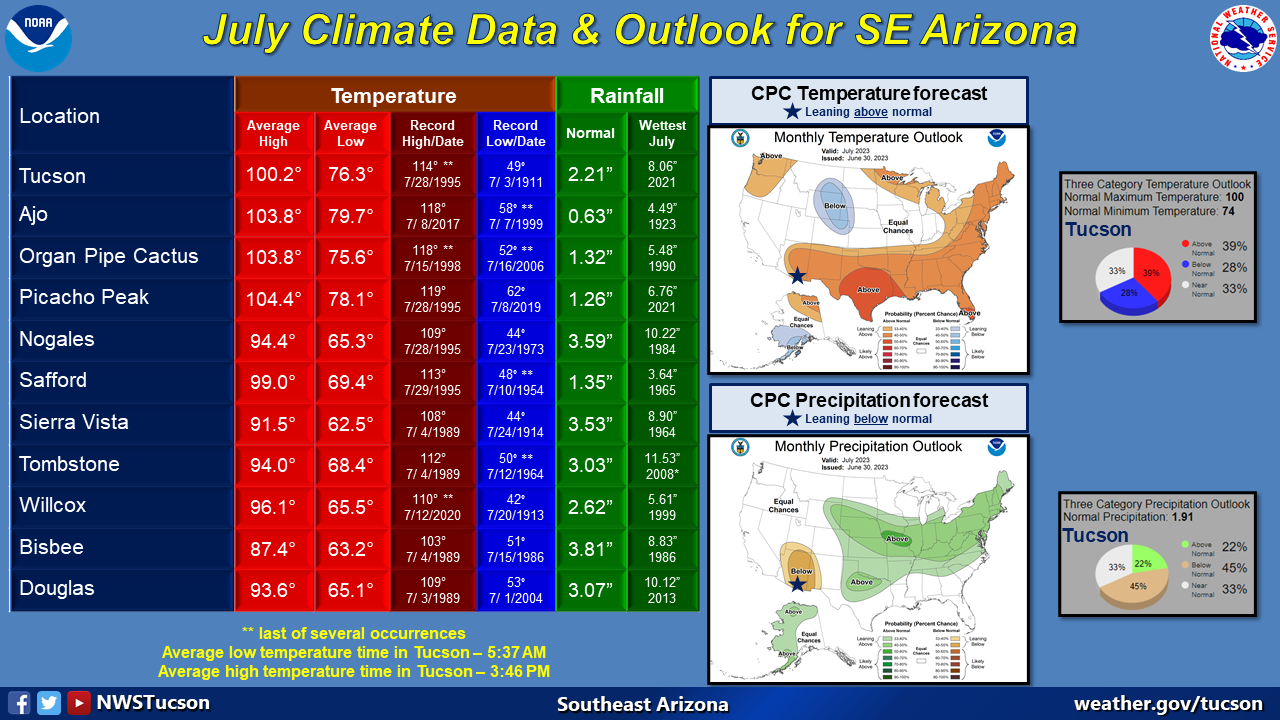
The August outlook from the Climate Prediction Center for Tucson favors above-normal monthly mean temperatures (53% above vs 14% below) and below-normal total precipitation amounts (38% below vs 29% above).
|
| |
| Normal monthly high temperature |
98.6° |
| Normal monthly low temperature |
75.2° |
| Normal monthly temperature |
86.9° |
| Record high temperature |
112° on August 1, 1993 |
| Record low temperature |
55° on August 20, 1917 |
| Hottest August (avg.) |
92.0° in 2020 |
| Coolest August (avg.) |
80.8° in 1923 |
| Normal rainfall |
1.98" |
| Wettest August day |
2.88" on August 1, 1935 |
| Wettest August |
7.93" in 1955 |
| Driest August |
0.08" in 1924 |
| Daily normals | Daily records |
|
|
| The number of daylight hours will decrease from 13 hours 42 minutes & 29 seconds on the 1st to 12 hours 51 minutes & 07 seconds on the 31st, a loss of 51 minutes & 22 seconds. |
| |
| Glueck |
|
Click on the images below for larger view.
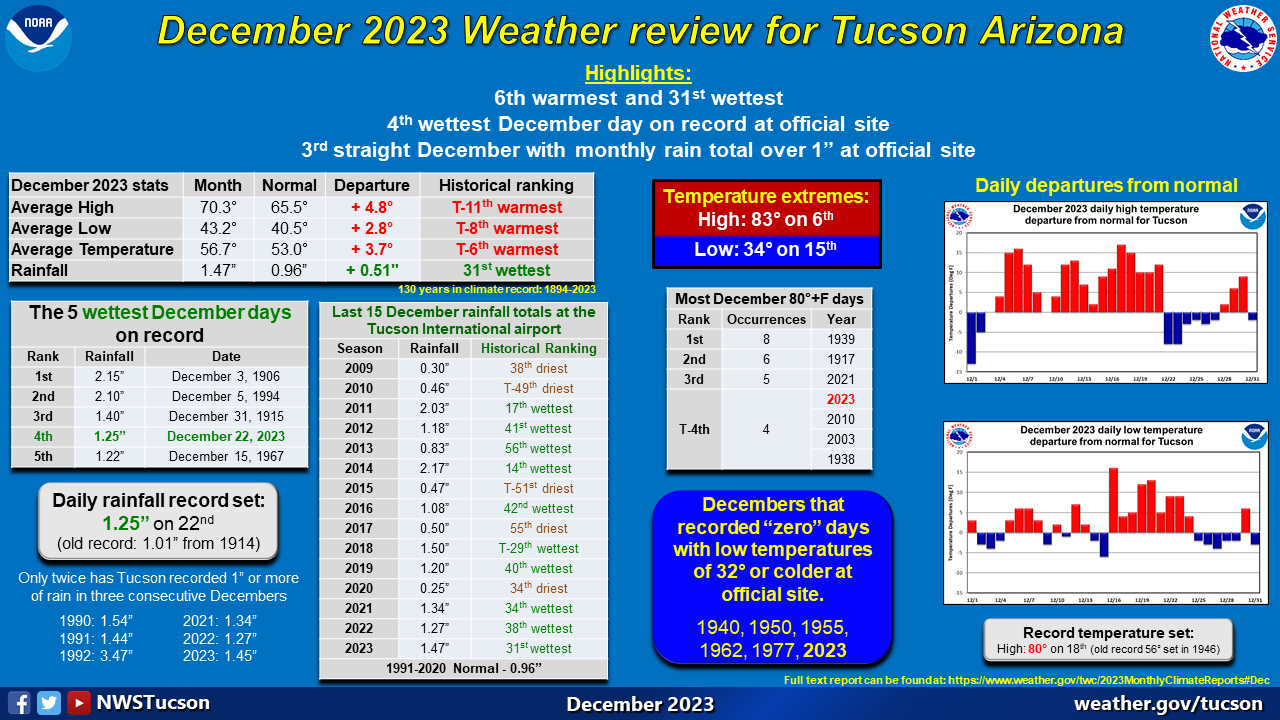
Social Media monthly recap
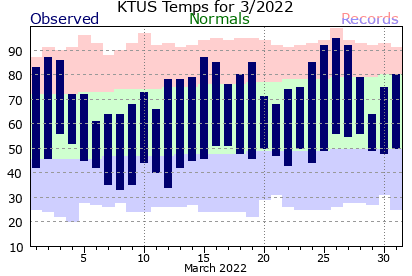
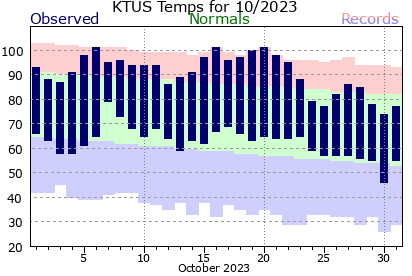
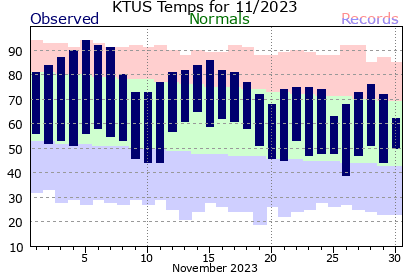
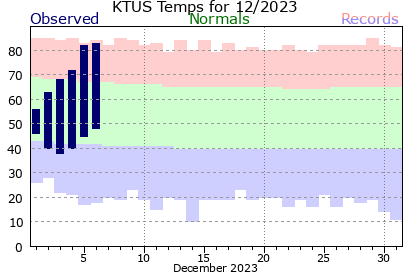
Temperature graph

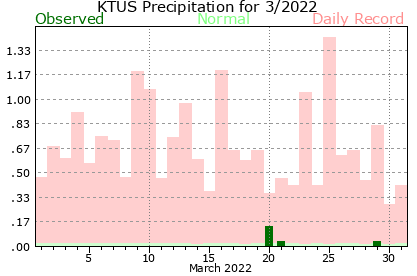
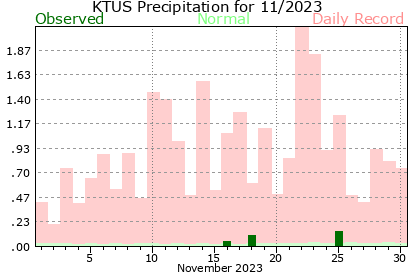
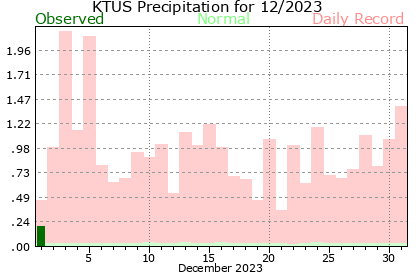
Precipitation graph
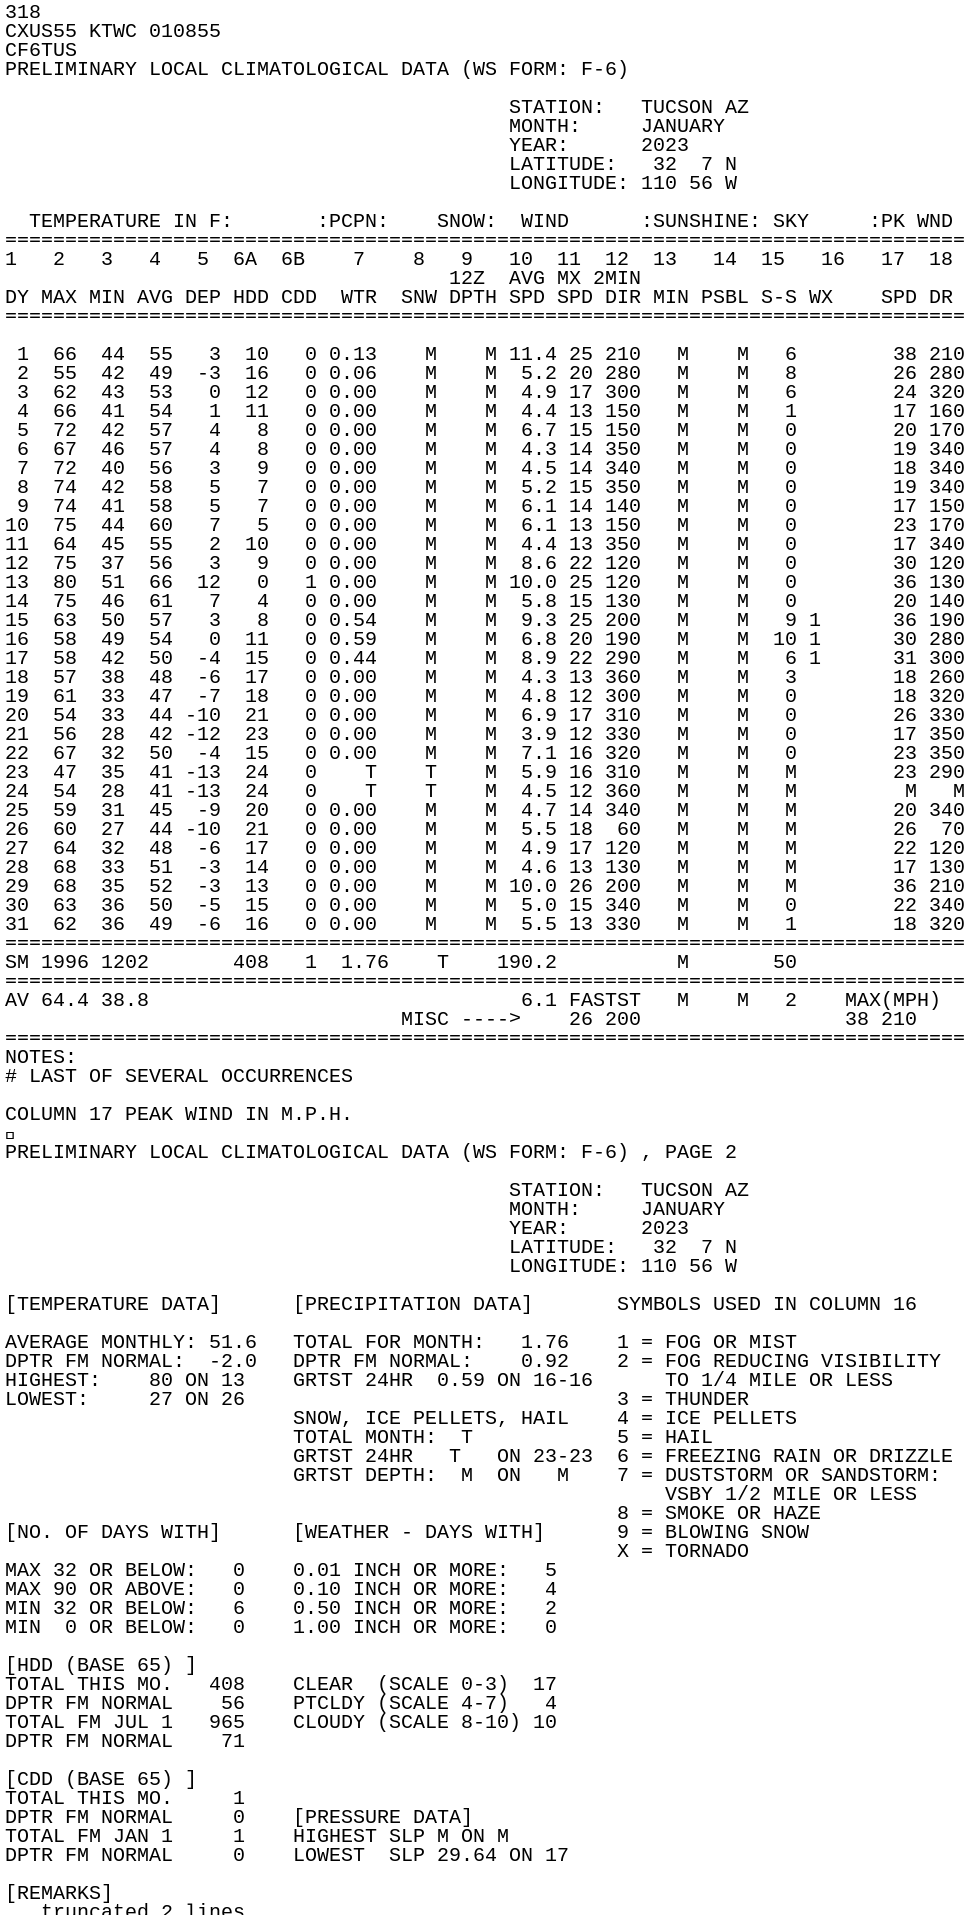
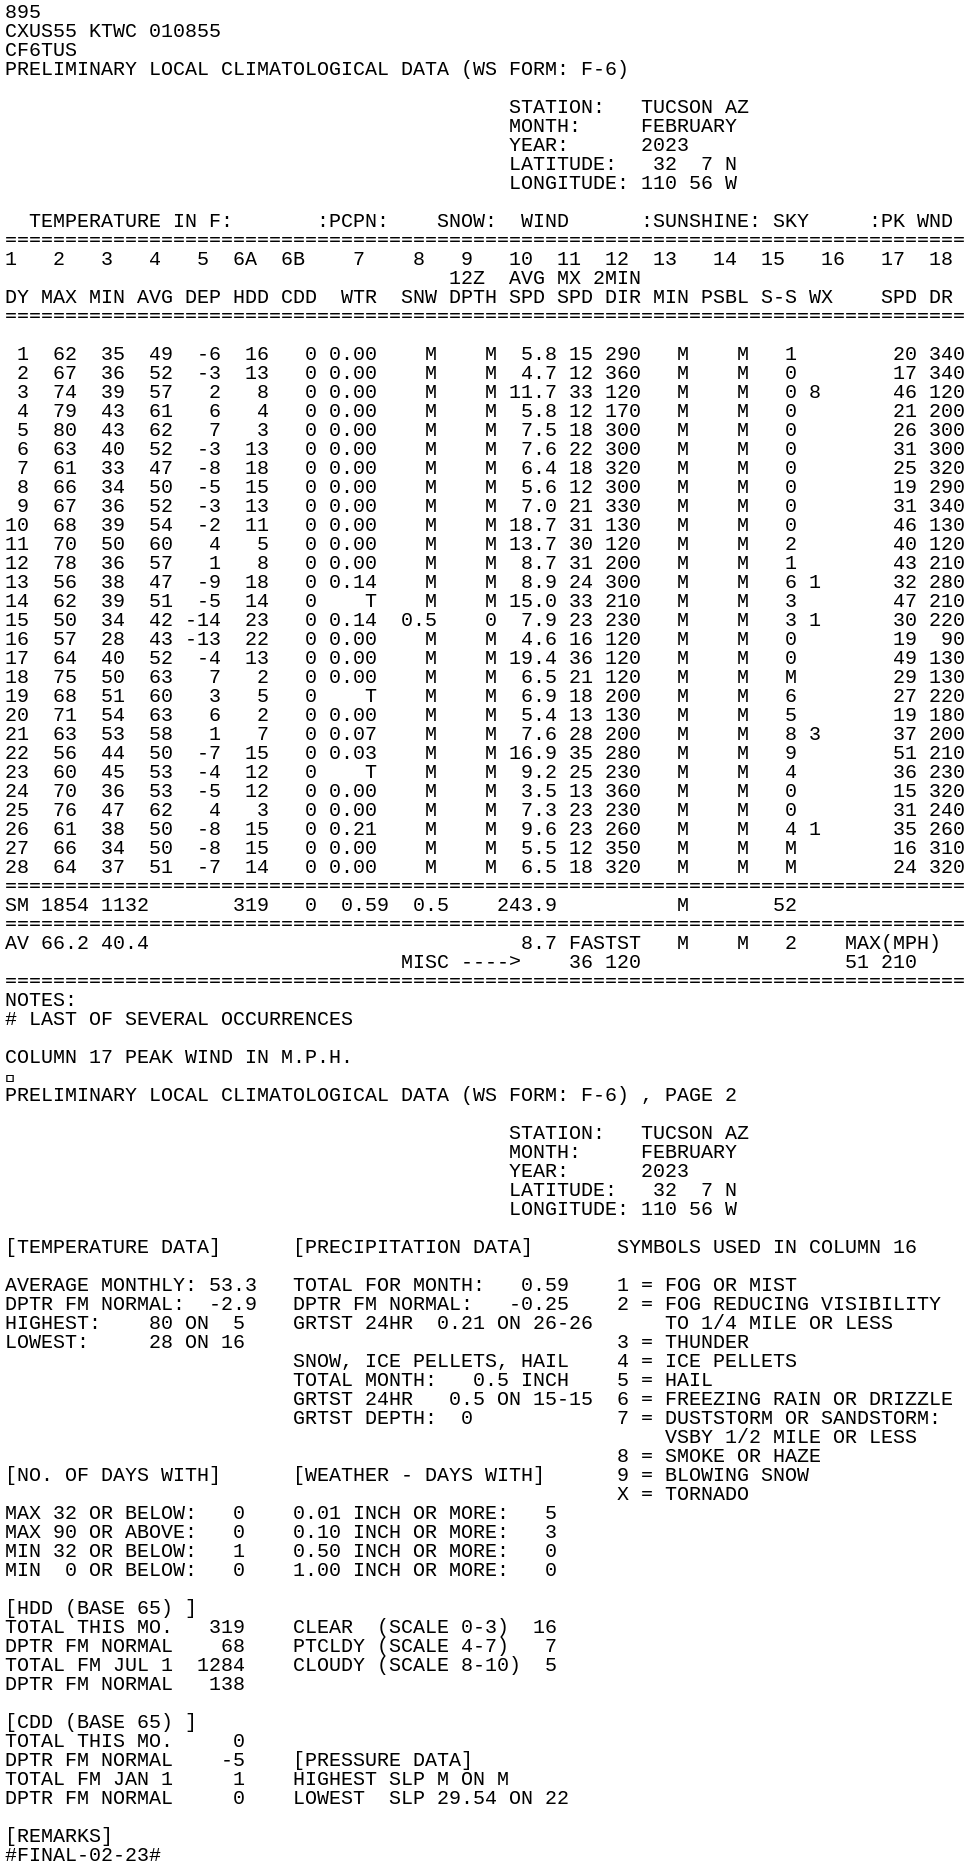
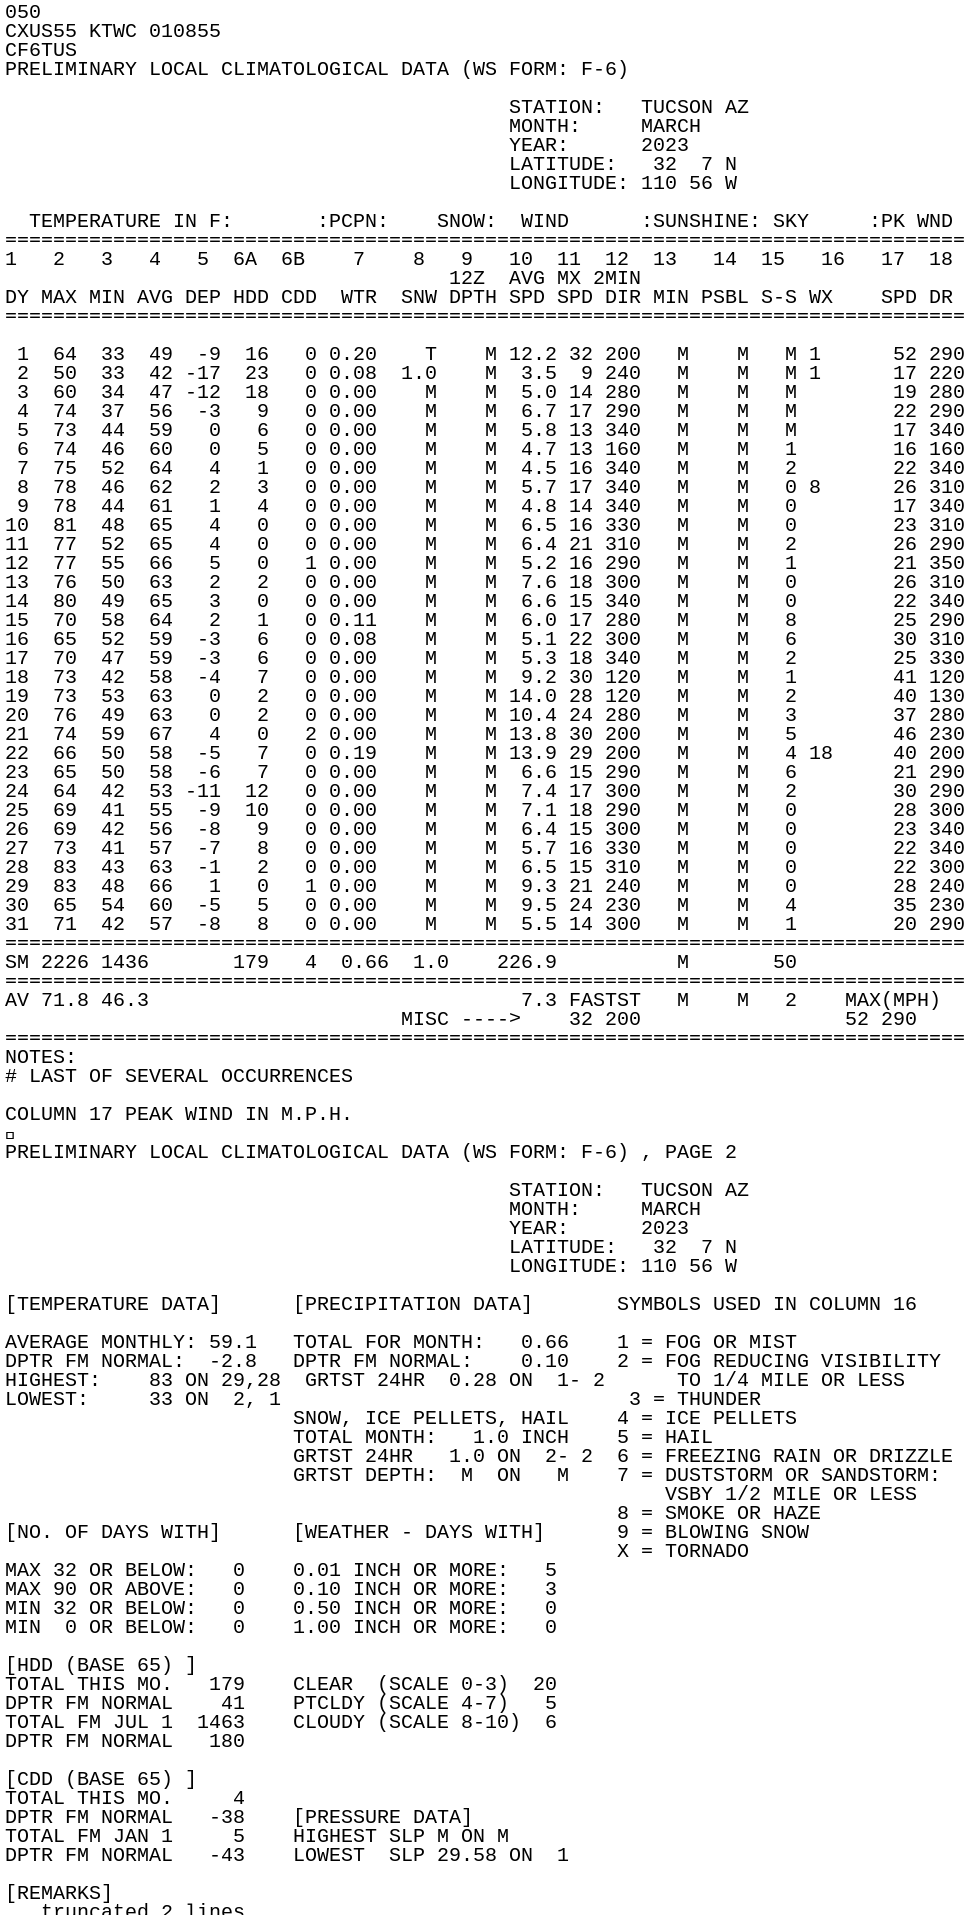
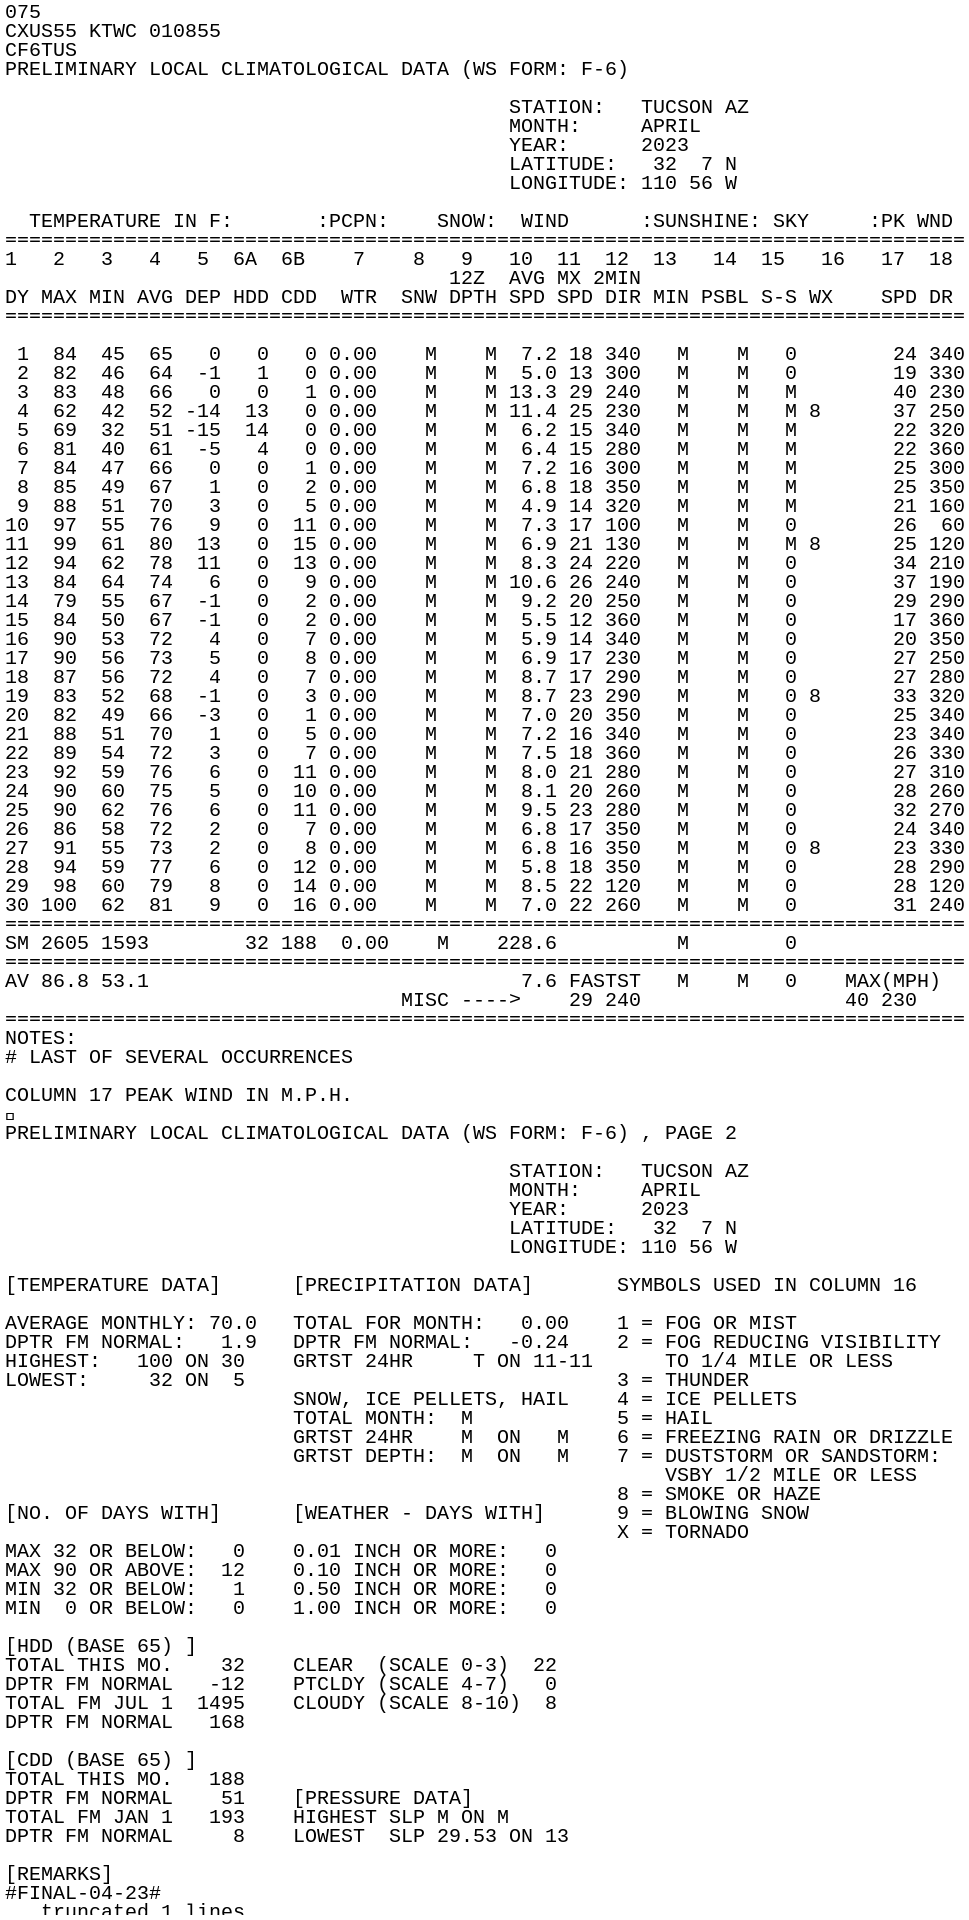
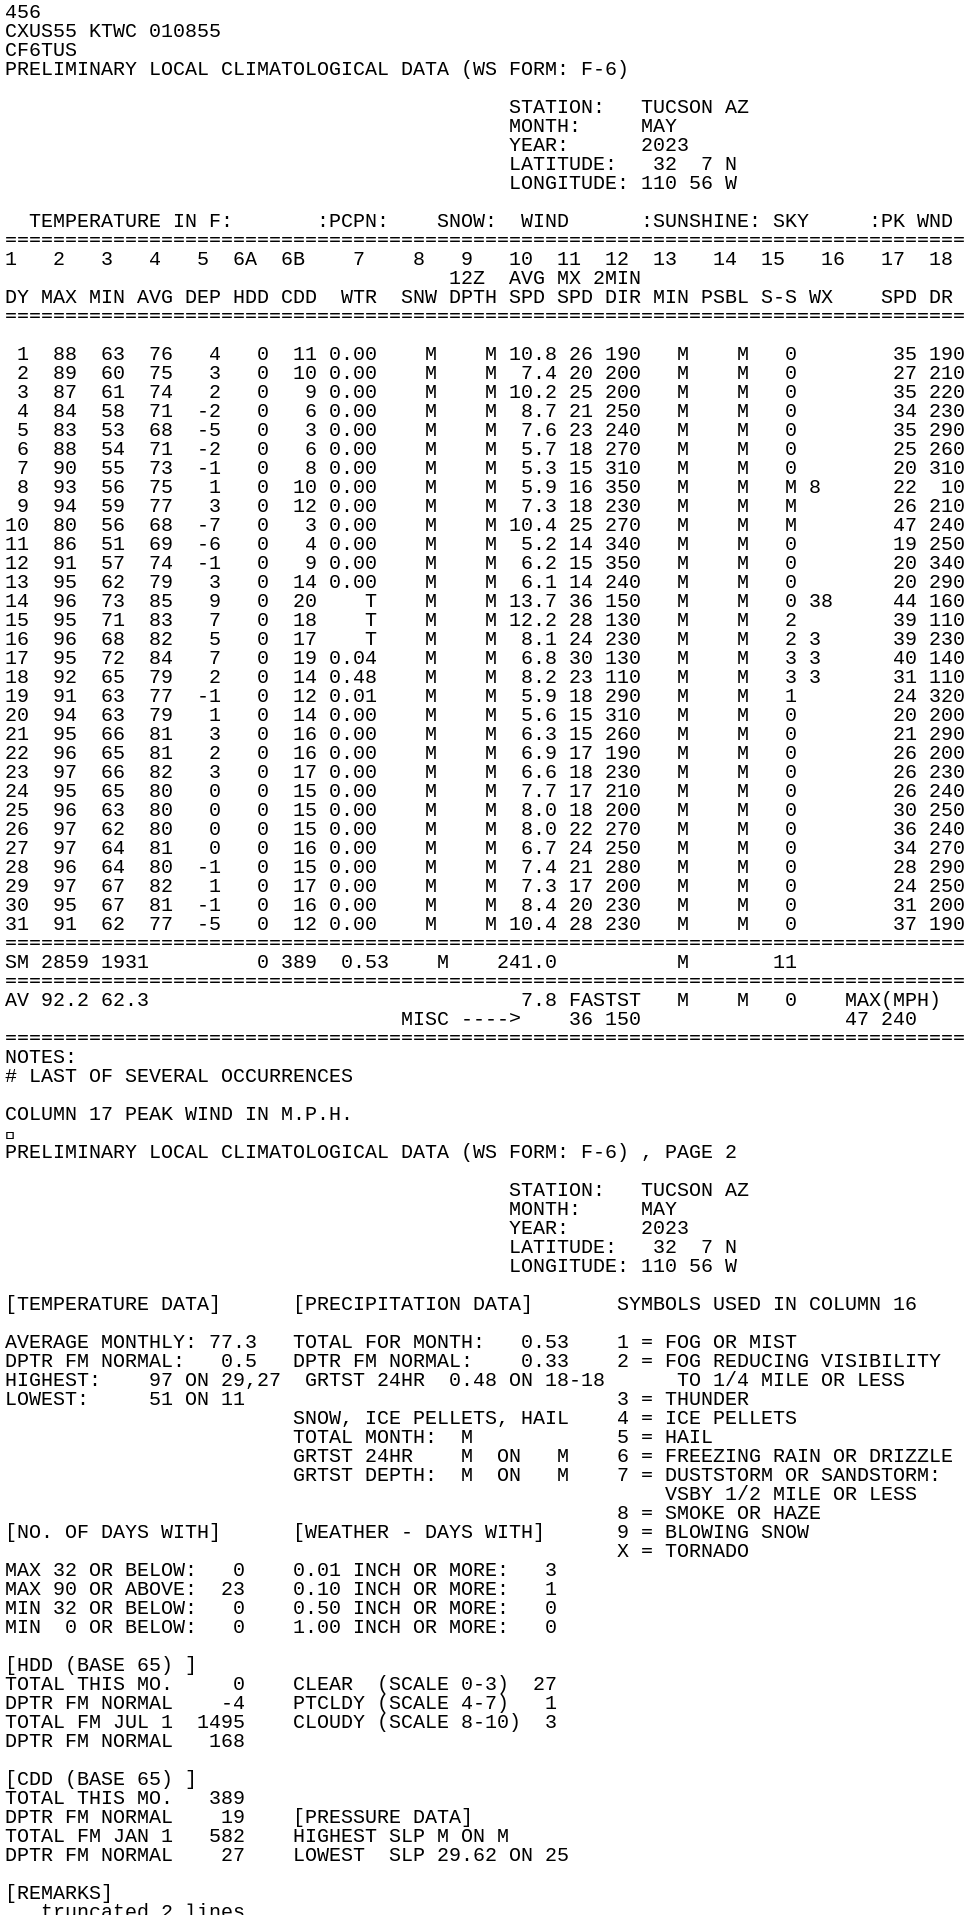
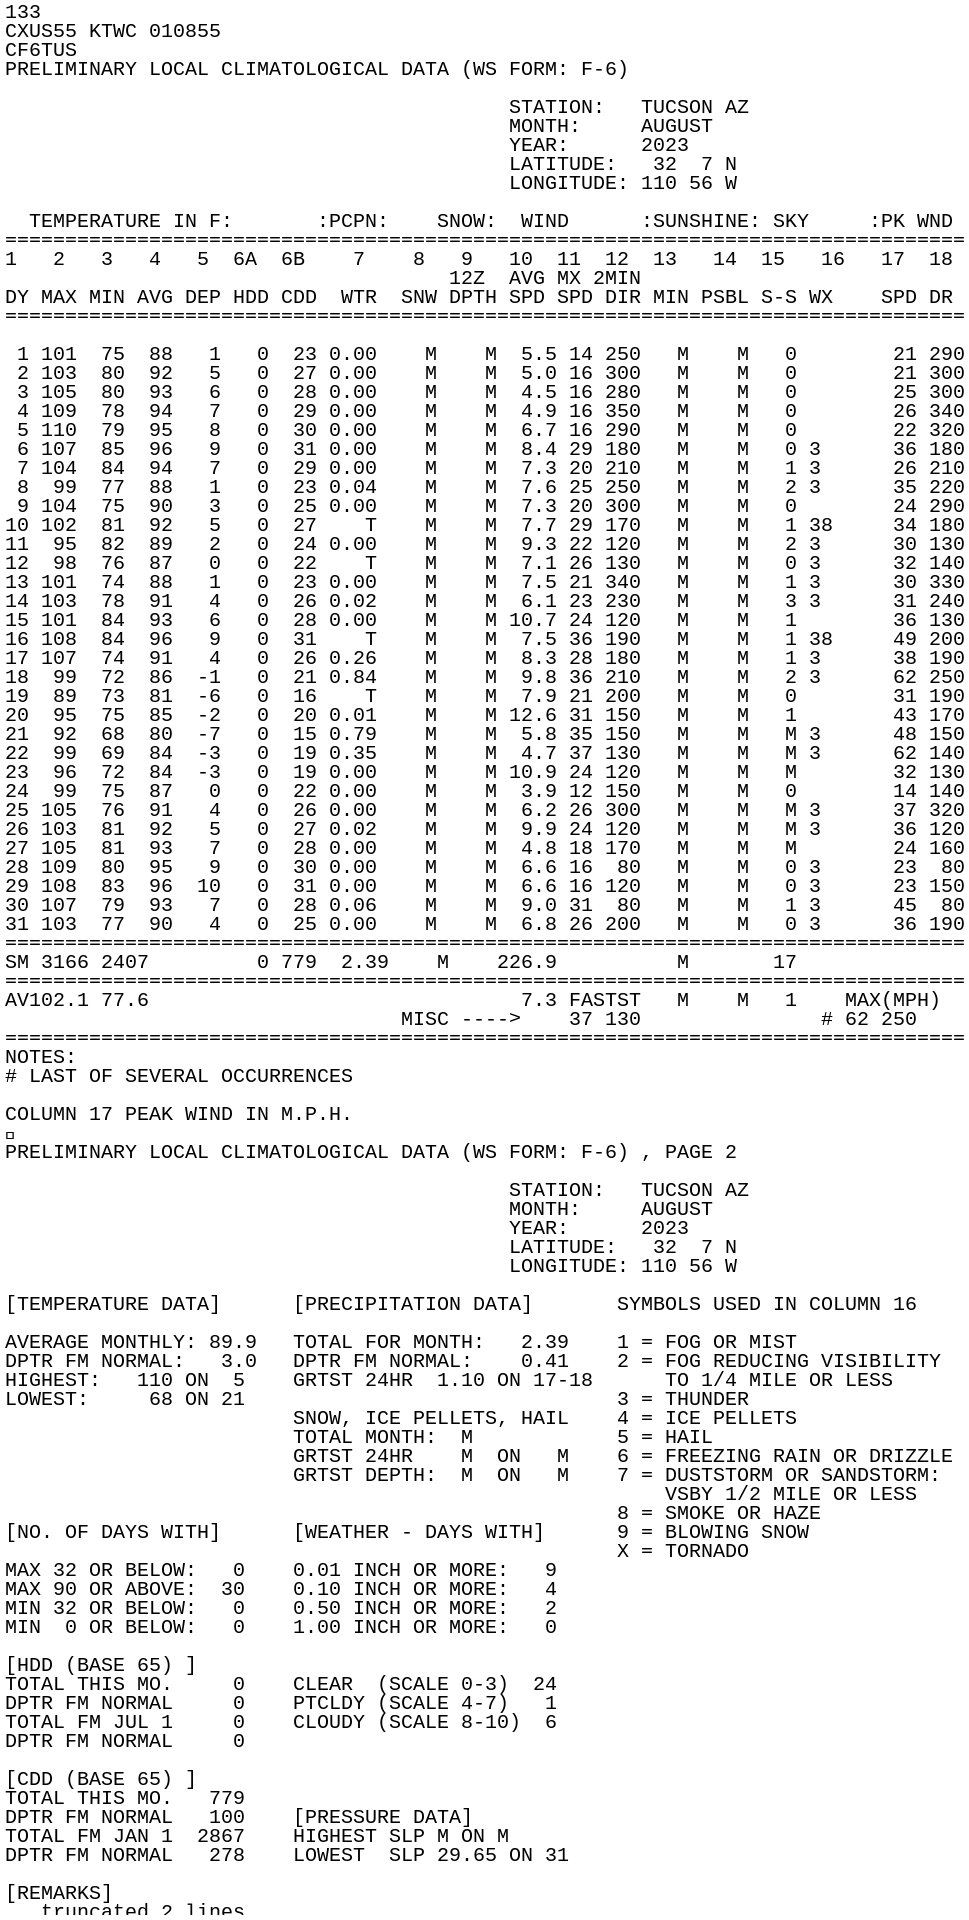
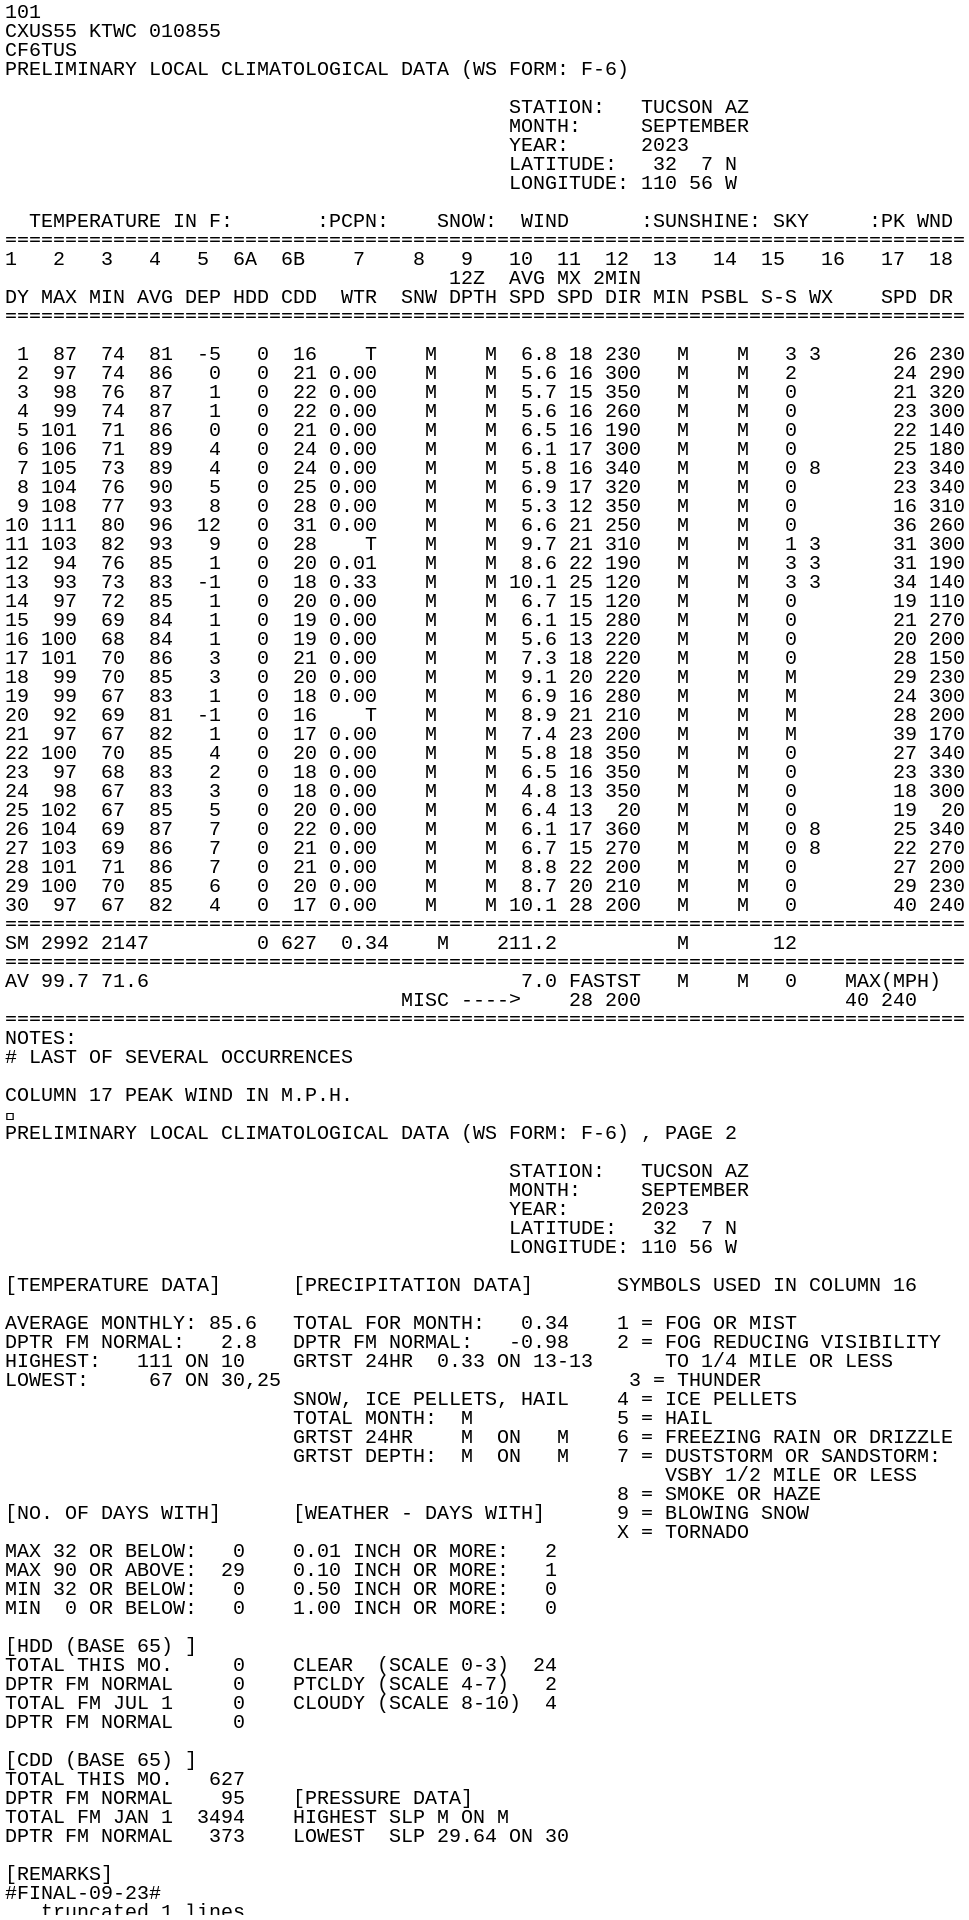
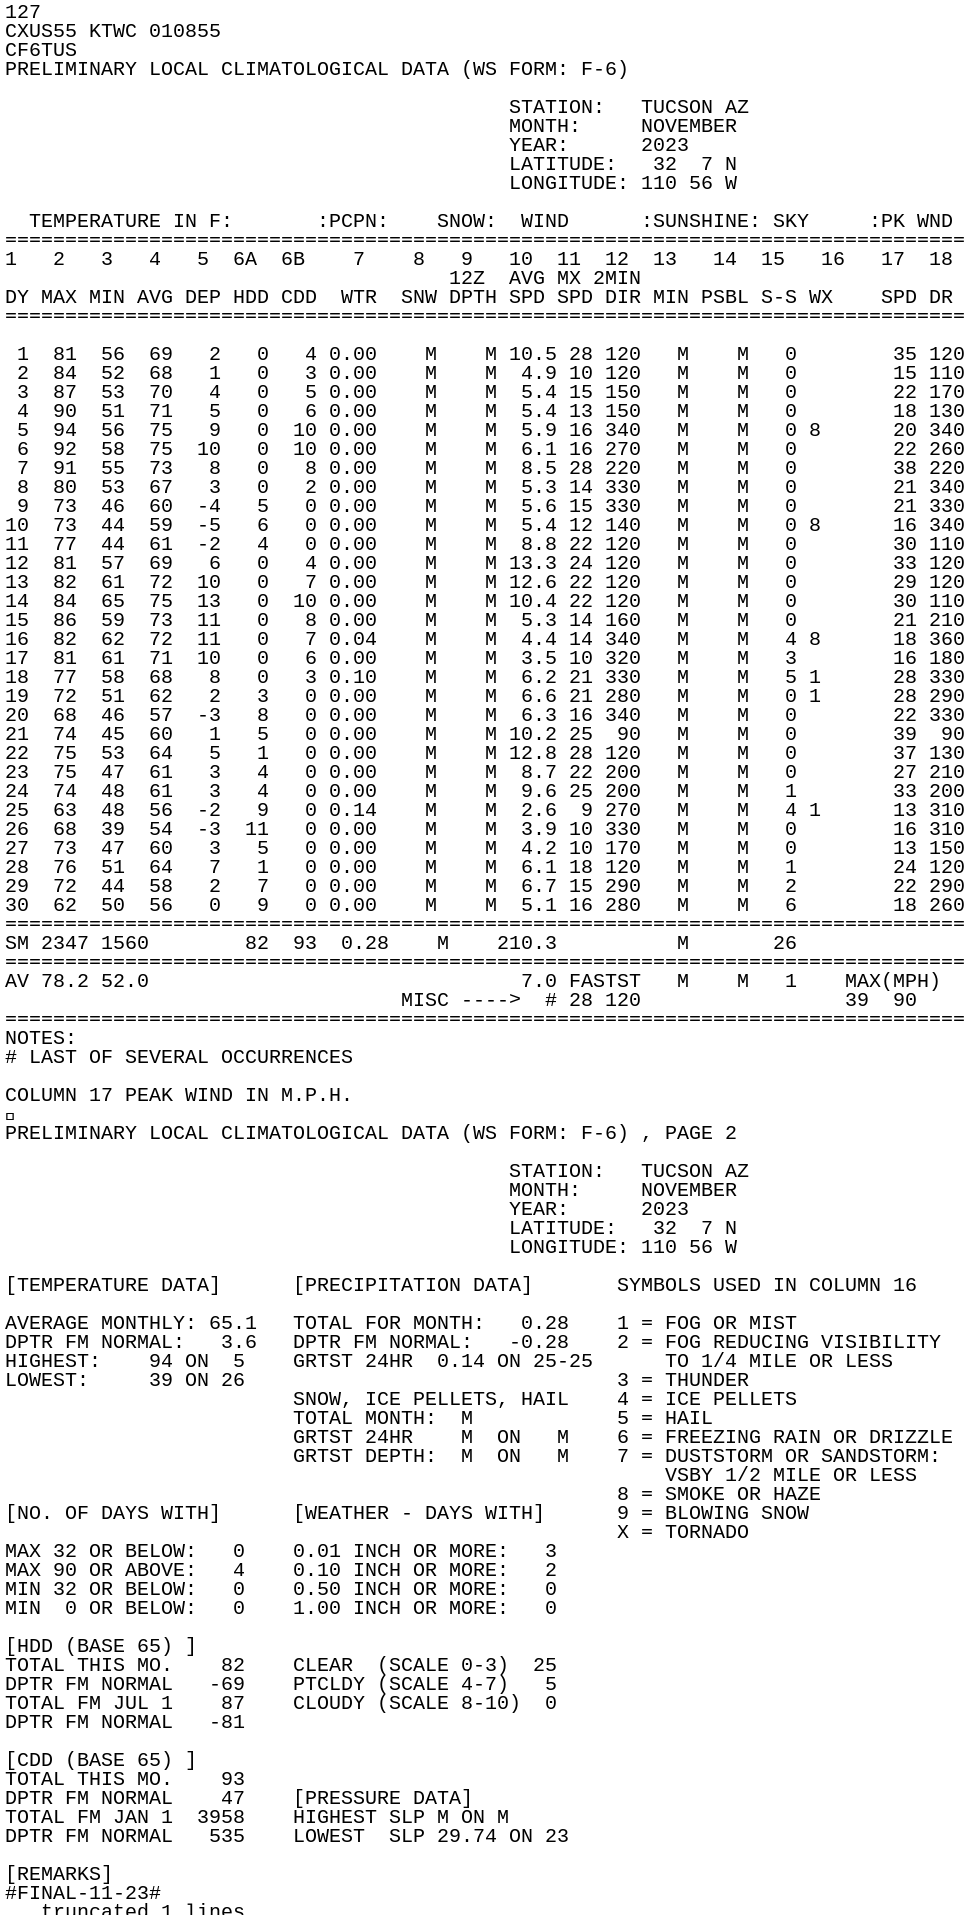
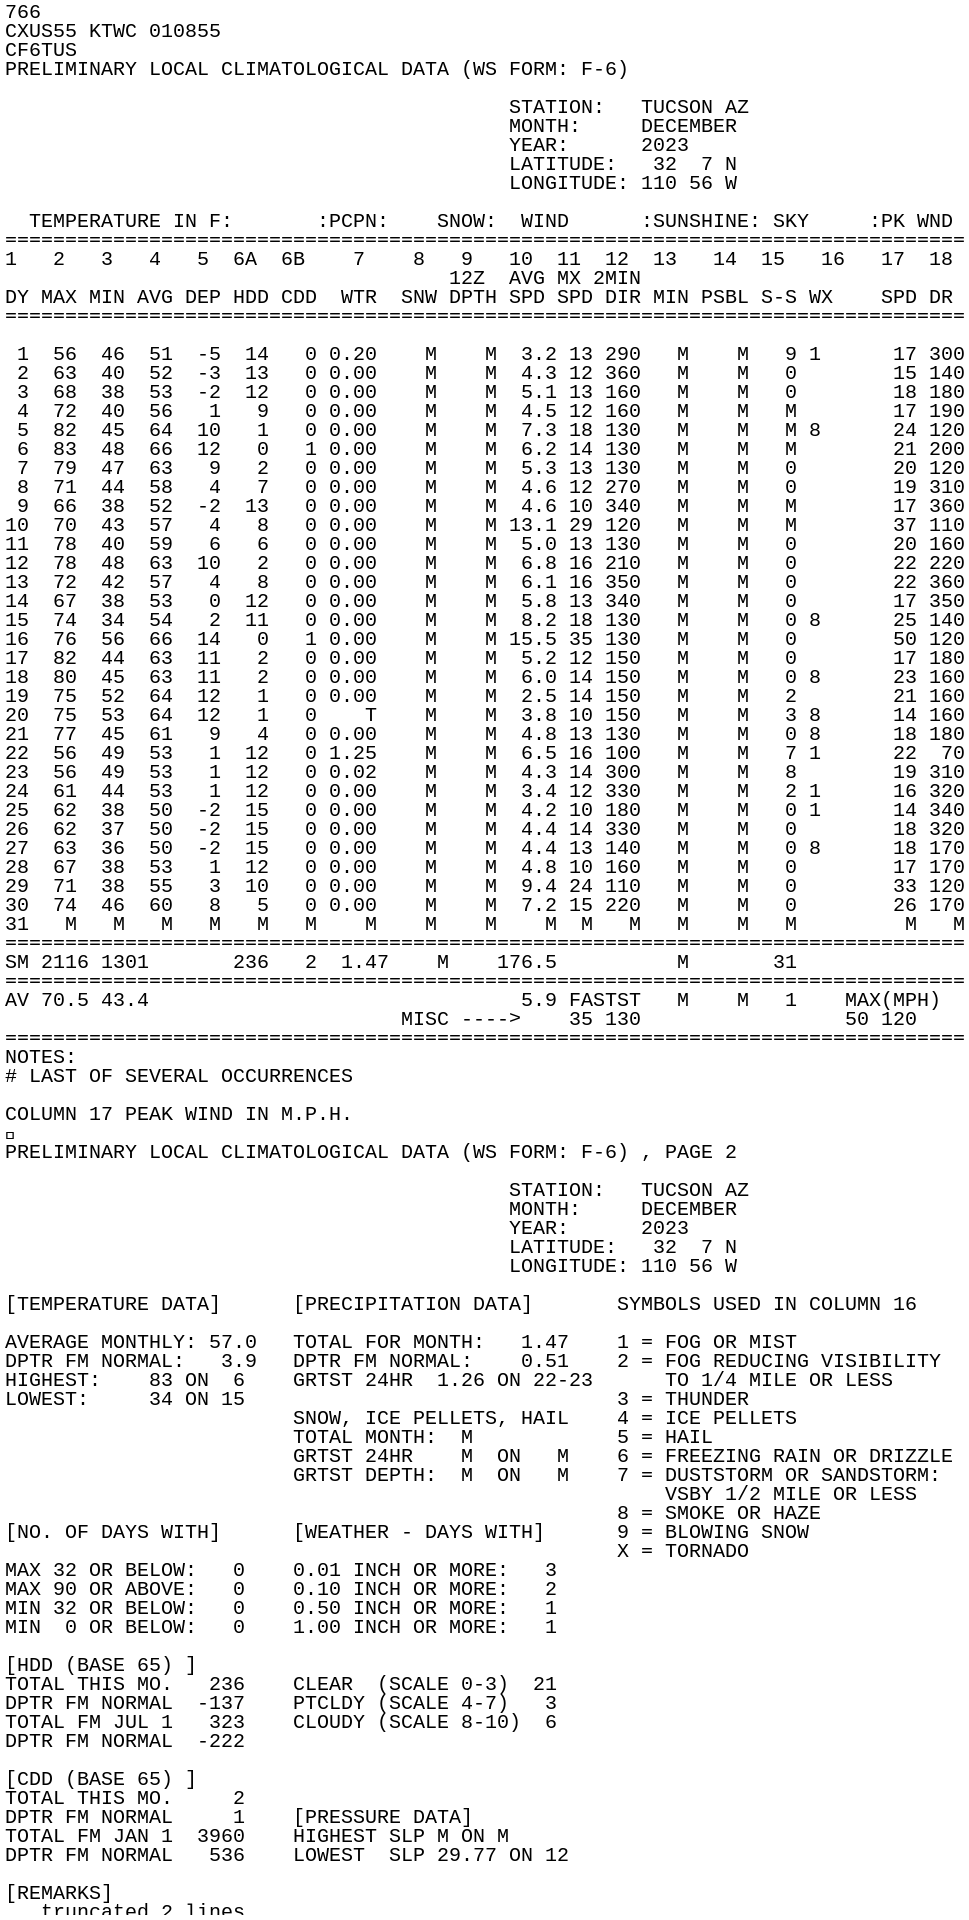
Monthly data in tabular form
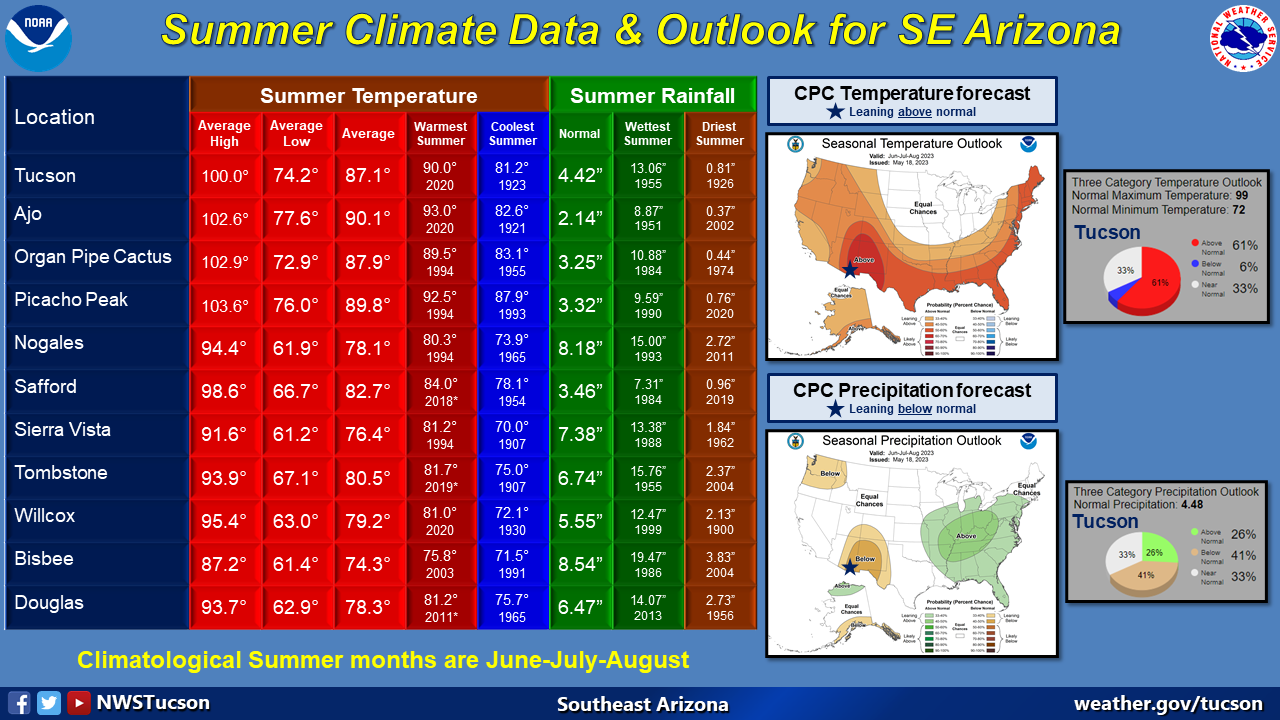
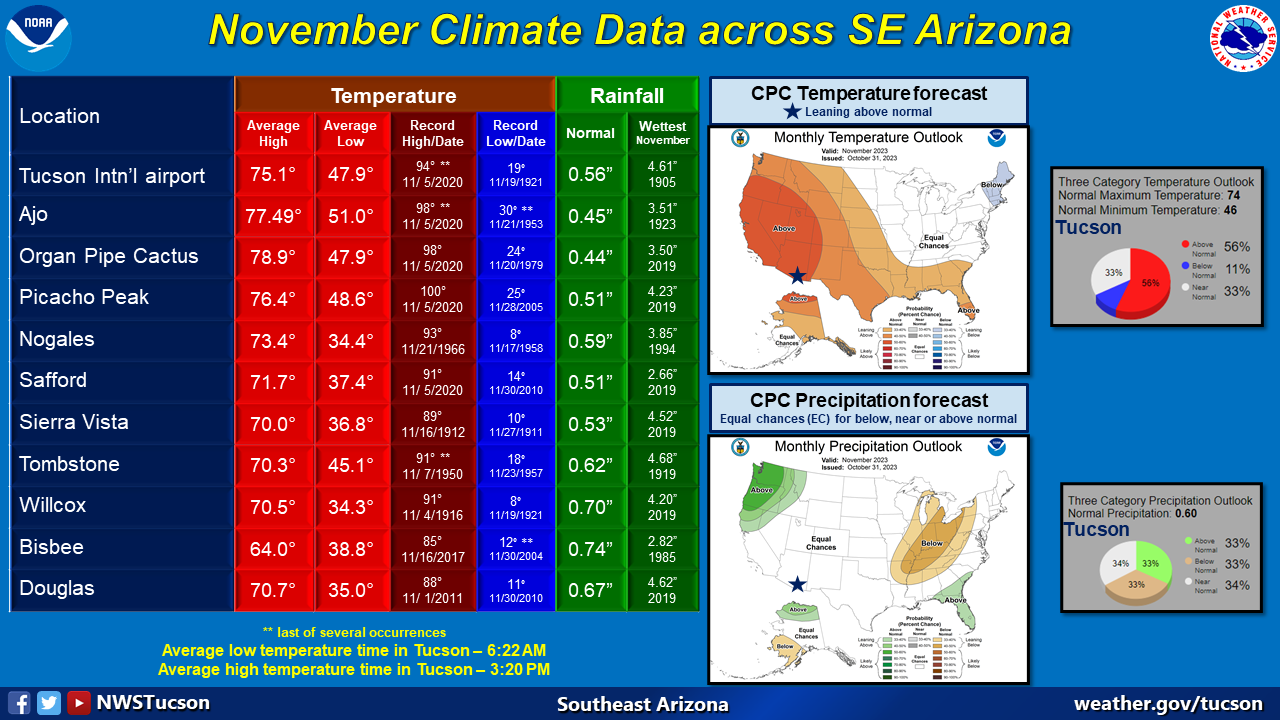
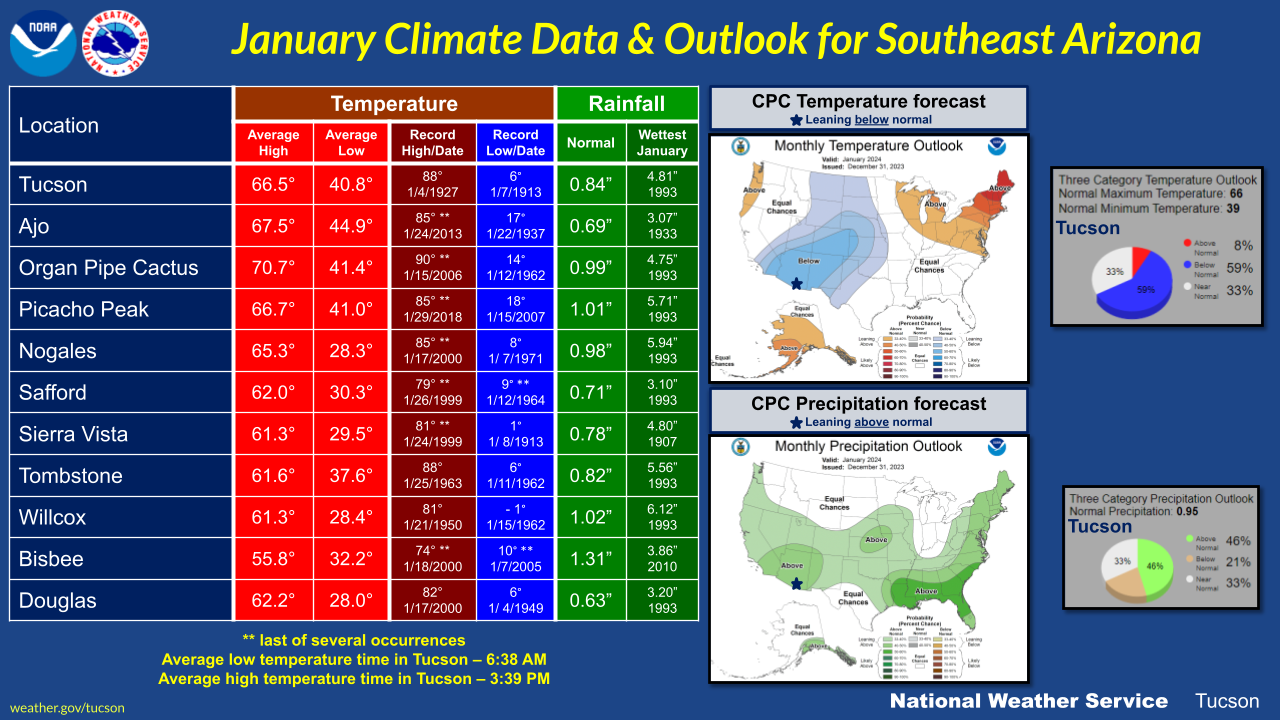
August climate data across southeast Arizona
|


 for Tucson Arizona")


