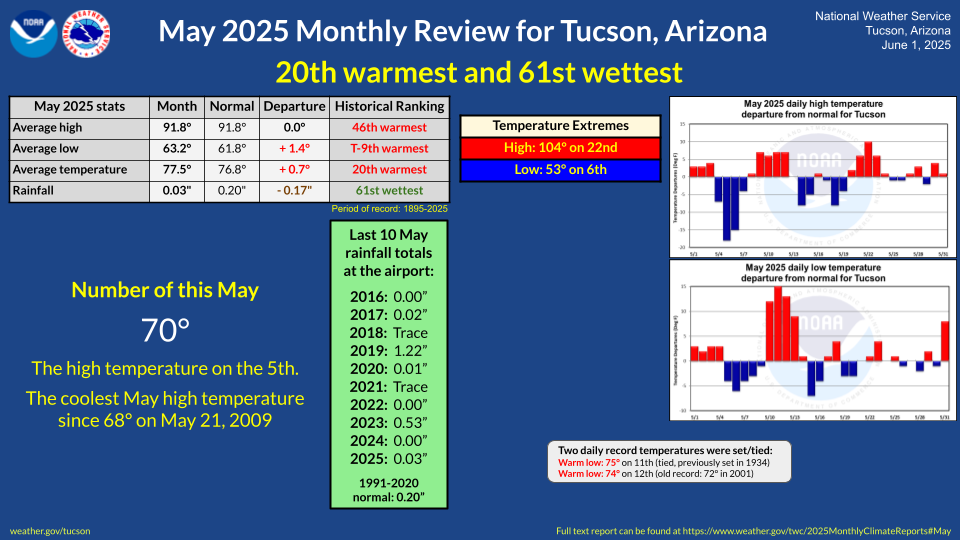
| August 2025 monthly review for Tucson |
| 2nd hottest and 3rd driest on record |
| 5th hottest calendar month on record |
| All-time August record high temperature & record warm low temperature were tied |
| |
| |
|
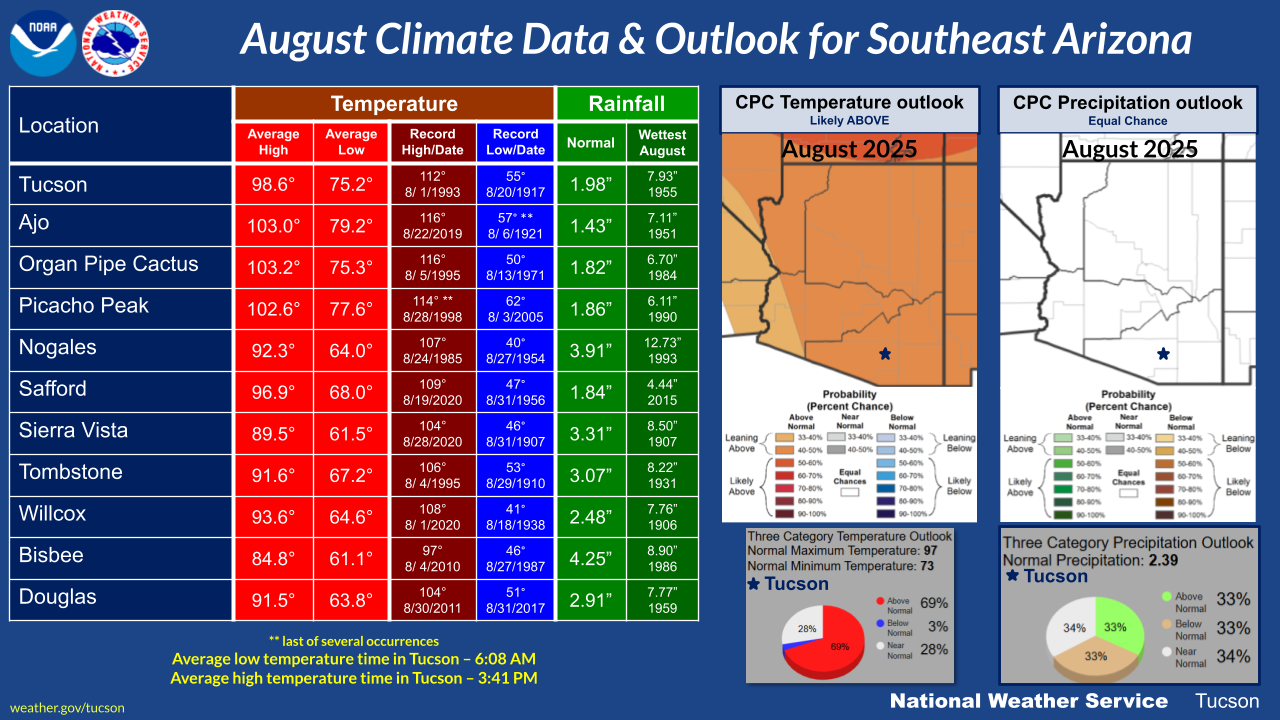
The Climate Prediction Center's official August outlook for Tucson, issued on July 31st, indicated a strong likelihood of a hotter-than-average month. The forecast had a 69% probability of above normal monthly mean temperatures, compared to just a 3% chance of a cooler-than-normal month. In contrast, the precipitation outlook showed equal chances (33%) for below-, near-, or above-normal total precipitation amounts.
|
| |
|
The month started off as July ended, hot, with a string of triple-digit high temperatures that ended at 20 consecutive days on the 13th making it the longest stretch so far in 2025. In this stretch, Tucson went through a period of extreme heat on the 6th and 7th where the all-time August record high temperature of 112° was tied on the 7th. The previous occurrence of 112° was on August 1, 1993. The next day saw Tucson tie its warmest August low temperature on record of 85° which previously occurred on August 1, 1914 & August 6, 2023. During this time period, there were only three days with showers & thunderstorms impacting the area: isolated on the 1st & 9th, scattered on the 13th.
|
| |
|
High temperatures for the next four days would be in the mid to upper 90s with isolated showers and thunderstorms on the 14th, 15th & 16th. The 16th was noteworthy as an isolated thunderstorm moving from the University of Arizona campus west to downtown produced strong winds and flash flooding from up to 2" of rain falling in less than a hour.
|
| |
|
Triple-digit high temperatures returned for the next week (18th to 24th) with highs ranging from 102° to 106°. Isolated to widely scattered showers and thunderstorms occurred on the 20th & 21st. The 20th was noteworthy as a severe thunderstorms moved from Oro Valley to Marana producing locally heavy rain and severe wind gusts with the Marana Regional Airport recording a wind gust of 59 mph.
|
| |
|
The remainder of the month saw high temperatures in the 90s to 102° with isolated showers and thunderstorms occurring on the 25th, 26th, 28th & 29th. The most noteworthy event was on the 25th with isolated heavy rain occurring in Oro Valley and Marana.
|
| |
|
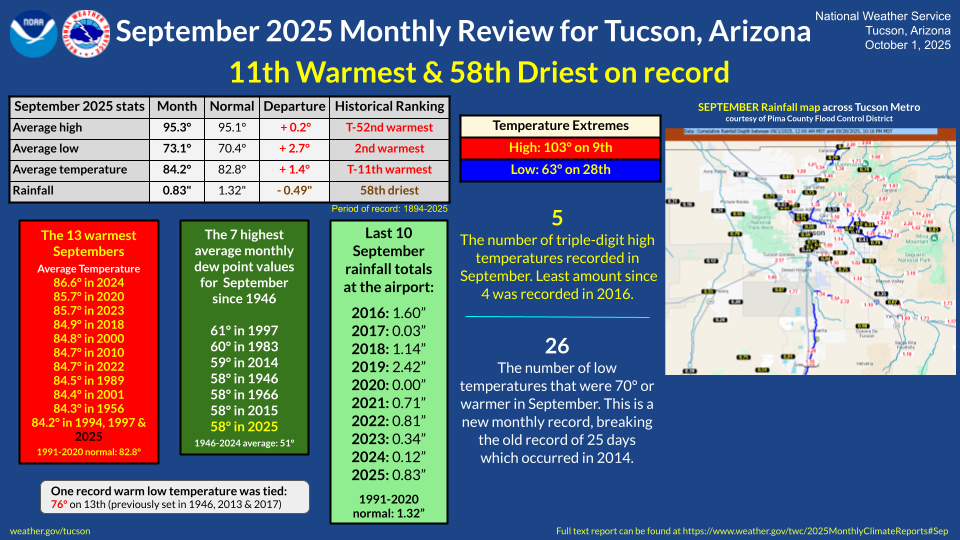
August 2025 was the 2nd hottest August on record, with a monthly average temperature of 90.6° (+3.7° above normal). This also ranks as the 5th hottest calendar month on record. Monthly temperature extremes ranged from a record-tying high of 112° on the 7th to a low of 72° on the 27th. A total of eight daily temperatures records were set or tied: two for record highs and six for record warm lows. (see graphic on right for additional temperature details)
|
| |
|
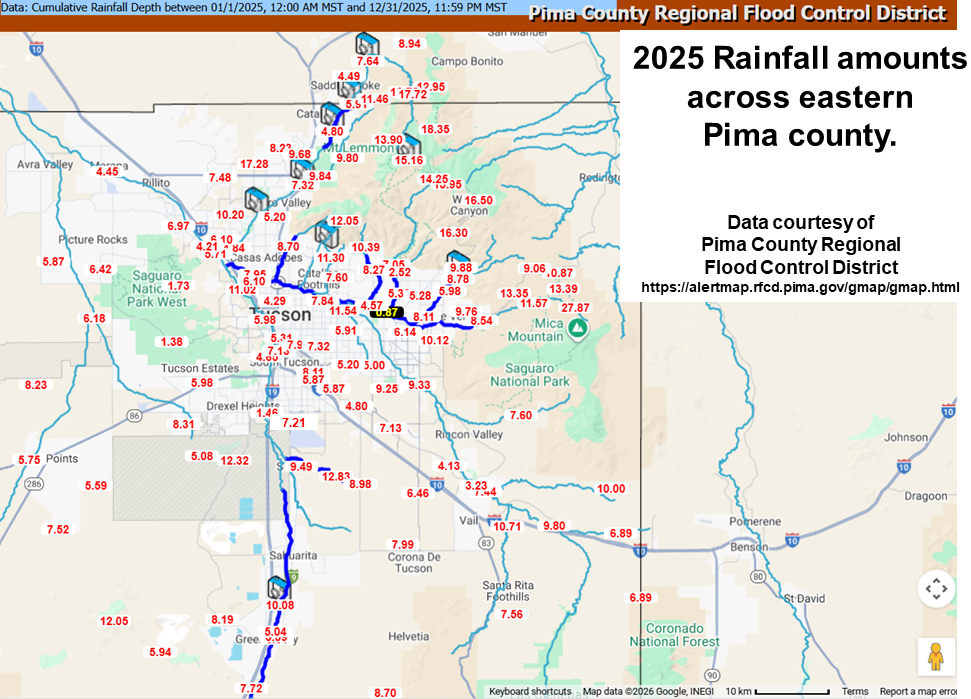
Across the metro area, rainfall totals during the summer thunderstorm season varied widely, as is typical. Utilizing data from rainlog.org, Pima County Regional Flood Control District gages, and CoCoRaHS, amounts ranged from a trace to 1.00", with some localized areas recording up to 2.00". The International Airport, which is the official recording spot in Tucson, recorded only 0.11", making this August the third driest on record, behind 0.08" in 1924 and 0.10" in 1926.
|
| August 2025 stats |
Month
|
Normal
|
Departure
|
Historical Ranking
|
| Average high temperature |
102.5°
|
98.6°
|
+ 3.9°
|
3rd hottest
|
| Average low temperature |
78.7°
|
75.2°
|
+ 3.5°
|
T-Warmest
|
| Average temperature |
90.6°
|
86.9°
|
+ 3.7°
|
2nd hottest
|
| Days with highs 100° or hotter |
23
|
15
|
+ 8
|
4th most
|
| Days with highs 105° or hotter |
14
|
5
|
+ 9
|
T-2nd most
|
| Days with highs 110° or hotter |
2
|
<1
|
+ 2
|
T-2nd most
|
| Days with lows 80° or warmer |
14
|
3
|
+ 11
|
2nd most
|
| Days with lows 85° or warmer |
1
|
0
|
+ 1
|
T-most
|
| Rainfall |
0.11"
|
1.98"
|
- 1.87"
|
3rd driest
|
|
Period of record: 131 years (1895-2025)
|
|
| |
|
| |
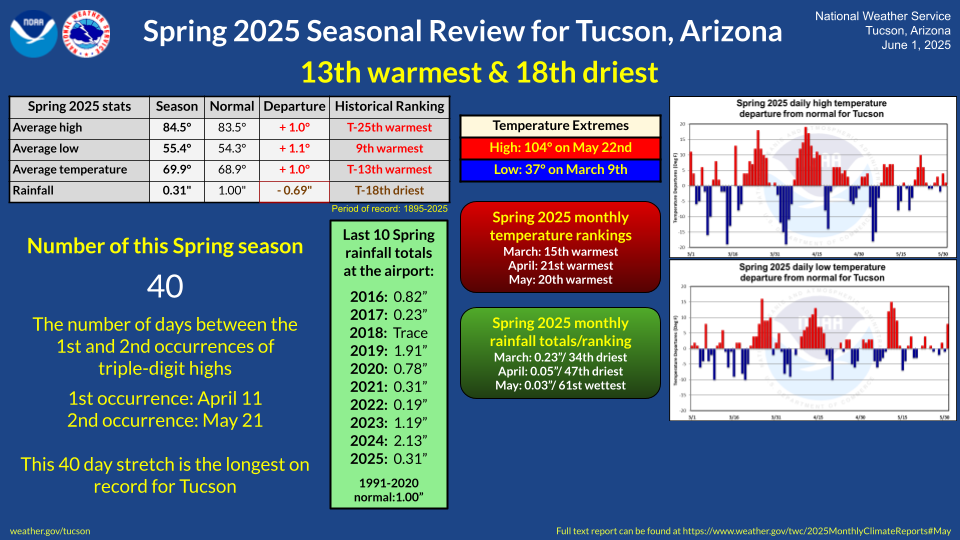
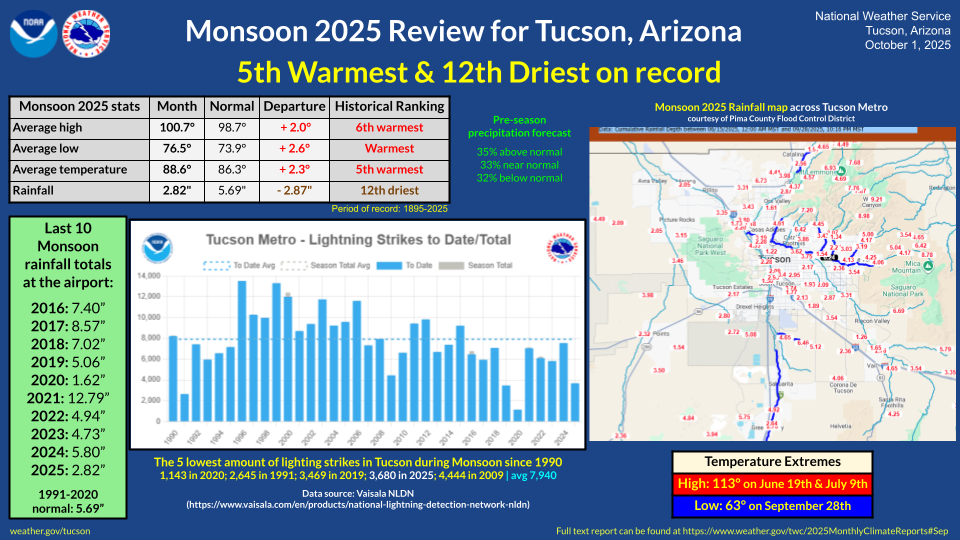
| Summer 2025 seasonal review for Tucson |
| 4th hottest and 15th driest on record |
| Summer seasonal average low temperature warmest on record |
| |
|
Each Summer in the 21st century has had a top 10 hottest ranking at the time of occurrence, except for three Summers (2001, 2008 & 2021). So, Tucsonans know coming into Summer that it will most likely be a hot one. What is unknown when the season starts is how hot it will be. The outlook for this summer, issued by the Climate Prediction Center on May 22nd, favored above-normal mean temperatures at 53% above vs 14% below. Thanks to the 12th warmest June; the 11th warmest July; and the 2nd hottest August on record, Summer 2025 goes into the record books as the 4th hottest Summer on record.
|
| |
|
Seasonal temperature extremes ranged from a high of 113° on June 19th & July 9th to a low of 65° on June 1st & 2nd. There were 67 days with highs 100° or hotter, 39 days with highs 105° or hotter, and 7 days with highs 110° or hotter. A total of 13 daily temperatures records were set or tied: three for record highs and ten for record warm lows.
|
| |
|
The Climate Prediction Center's summer precipitation outlook, issued on May 22nd, ever so slightly favored above-normal rainfall (35%) over below-normal (32%) and near-normal (33%). As is typical during the summer thunderstorm season, rainfall amounts varied significantly across the metro area, with data from sources like rainlog.org, Pima County Regional Flood Control District gages, and CoCoRaHS showing a range of 0.75" to 3.50" with some localized areas recording higher amounts. The International Airport, which is the official recording spot in Tucson, recorded 2.34" which is slightly more than two inches below normal and ranks as the 15th driest Summer on record.
|
| |
| Summer 2025 stats |
Season
|
Normal
|
Departure
|
Historical Ranking
|
| Average high temperature |
102.4°
|
100.0°
|
+ 2.4°
|
6th warmest
|
| Average low temperature |
76.7°
|
74.2°
|
+ 2.5°
|
Warmest
|
| Average temperature |
89.6°
|
87.1°
|
+ 2.5°
|
4th warmest
|
| Days with highs 100° or hotter |
67
|
55
|
+ 12
|
5th most
|
| Days with highs 105° or hotter |
39
|
24
|
+ 15
|
4th most
|
| Days with highs 110° or hotter |
7
|
2
|
+ 5
|
T-6th most
|
| Days with lows 80° or warmer |
31
|
11
|
+ 20
|
2nd most
|
| Days with lows 85° or hotter |
4
|
1
|
+ 3
|
T-2nd most
|
| Rainfall |
2.34"
|
4.42"
|
- 2.08"
|
15th driest
|
|
Period of record: 131 years (1895-2025)
|
|
| |
|
| |
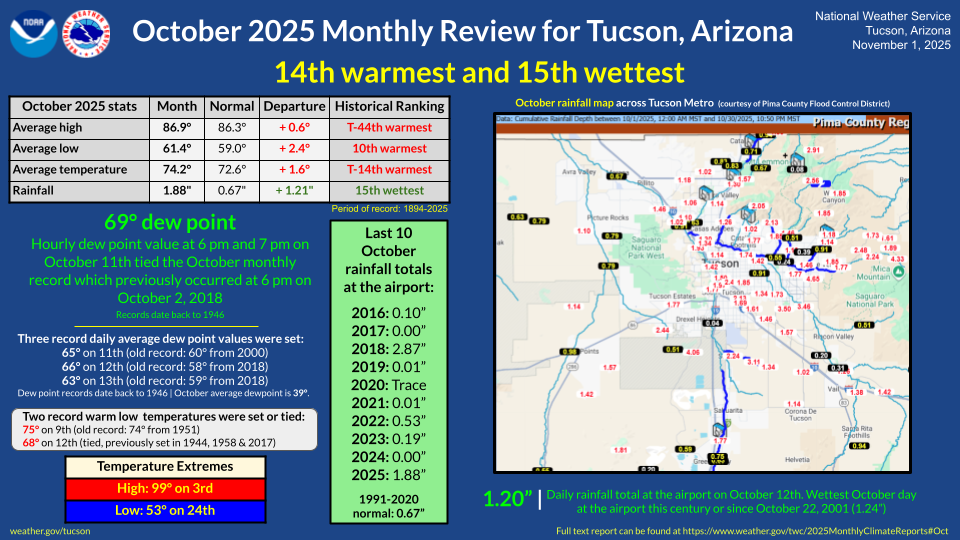
| Monsoon 2025 (so far) |
|
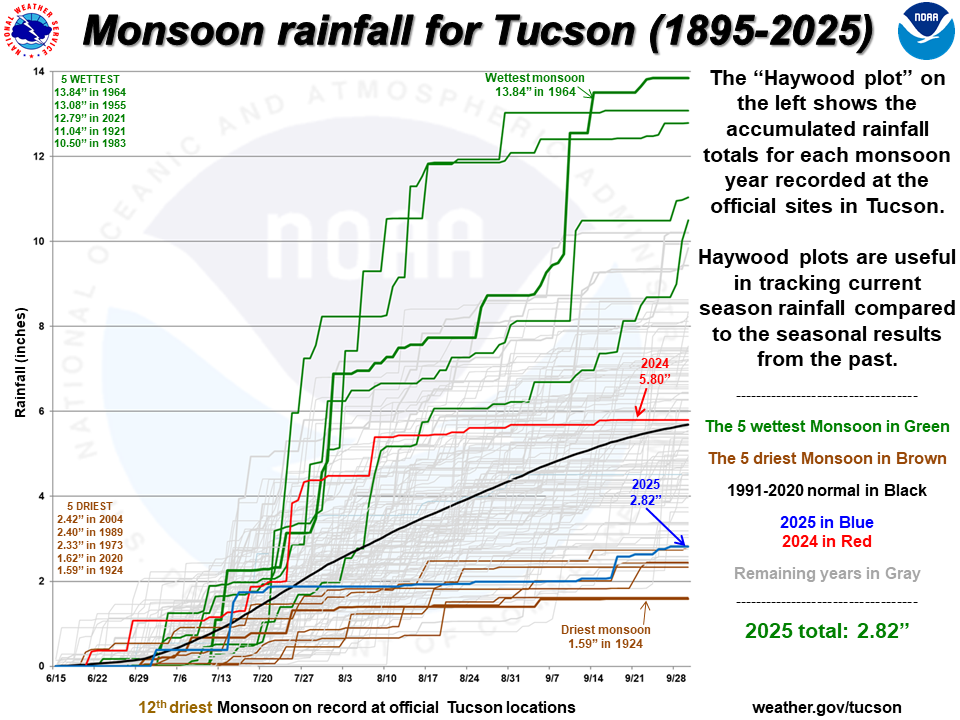
Due to persistent unfavorable atmospheric conditions, the 2025 Monsoon delivered well below-normal rainfall to the Tucson area. As is typical with the summer thunderstorms, rainfall totals varied widely across the metro area, with totals ranging from 0.75" to 3.50" with locally higher amounts. Rainfall at the Tucson International Airport, the official location in Tucson, is well below normal (-2.38") with only 1.99" being recorded. This ranks as the 13th driest Monsoon on record at the end of August.
|
| |
|
| |
| 2025 |
|
The average yearly temperature, through the end of August, of 74.0° is 1.6° above normal and ranks as the 3rd warmest on record, tied with 2014 & 2015. Tucson is on pace to record it's 27th consecutive year with an above-normal average yearly temperature.
Rainfall at the Tucson International Airport, the official location in Tucson, has been scare this year with only 2.90" being recorded. This is 4.20" below normal and ranks as the 2nd driest January through August period on record. Rainfall amounts across the metro area through the end of August, ranged from 1.50" to 6.00" with locally higher amounts.
The water year statistics are even more stark. Since October 1st, Tucson is enduring the DRIEST water year on record with only 3.33" being recorded at the Tucson International Airport. This is nearly six inches below normal and with only one month remaining in the water year calendar, the 3.33" is tracking well below the current driest water year on record of 4.72" set in 1901-1902. Rainfall amounts across the metro area, with one month left in the water year calendar, ranged from 1.50" to 6.50" with locally higher amounts.
|
| |
| 2025 stats thru August |
Year
|
Normal
|
Departure
|
Historical Ranking
|
| Average high temperature |
88.1°
|
86.0°
|
+ 2.1°
|
4th warmest
|
| Average low temperature |
59.9°
|
58.9°
|
+ 1.0°
|
5th warmest
|
| Average temperature |
74.0°
|
72.4°
|
+ 1.6°
|
T-3rd warmest
|
| Days with highs 100° or hotter |
73
|
59
|
+ 14
|
6th most
|
| Days with highs 105° or hotter |
39
|
25
|
+ 14
|
4th most
|
| Days with highs 110° or hotter |
7
|
2
|
+ 5
|
T-6th most
|
| Days with lows 80° or warmer |
31
|
11
|
+ 20
|
2nd most
|
| Days with lows 85° or hotter |
4
|
1
|
+ 3
|
T-2nd most
|
| Rainfall |
2.90"
|
7.10"
|
- 4.20"
|
2nd driest
|
| Water year rainfall (Oct-Aug) |
3.33"
|
9.29"
|
- 5.96"
|
DRIEST
|
|
Period of record: 131 years (1895-2025); Historical ranking is through the end of August
|
|
| |
| The 10 driest January to August periods on record |
| Rainfall |
Year |
| 2.88" |
1902 |
| 2.90" |
2025 |
| 3.15" |
1947 |
| 3.28" |
1976 |
| 3.46" |
1924 |
| 3.57" |
2011 |
| 3.77" |
2020 |
| 3.87" |
1994 |
| 3.93" |
2014 |
| 4.08" |
1900 & 1962 |
Note: Four of the driest January to August periods on record have occurred in the past 15 years. |
| The 10 driest October to August Water Year periods on record |
| Rainfall |
Water Year |
| 3.33" |
2024-2025 |
| 4.14" |
1901-1902 |
| 4.14" |
1975-1976 |
| 4.49" |
2010-2011 |
| 5.31" |
1899-1900 |
| 5.53" |
1946-1947 |
| 5.55" |
1938-1939 |
| 5.62" |
1924-1925 |
| 5.72" |
2008-2009 |
| 5.80" |
1993-1994 |
|
|
| |
|
| |
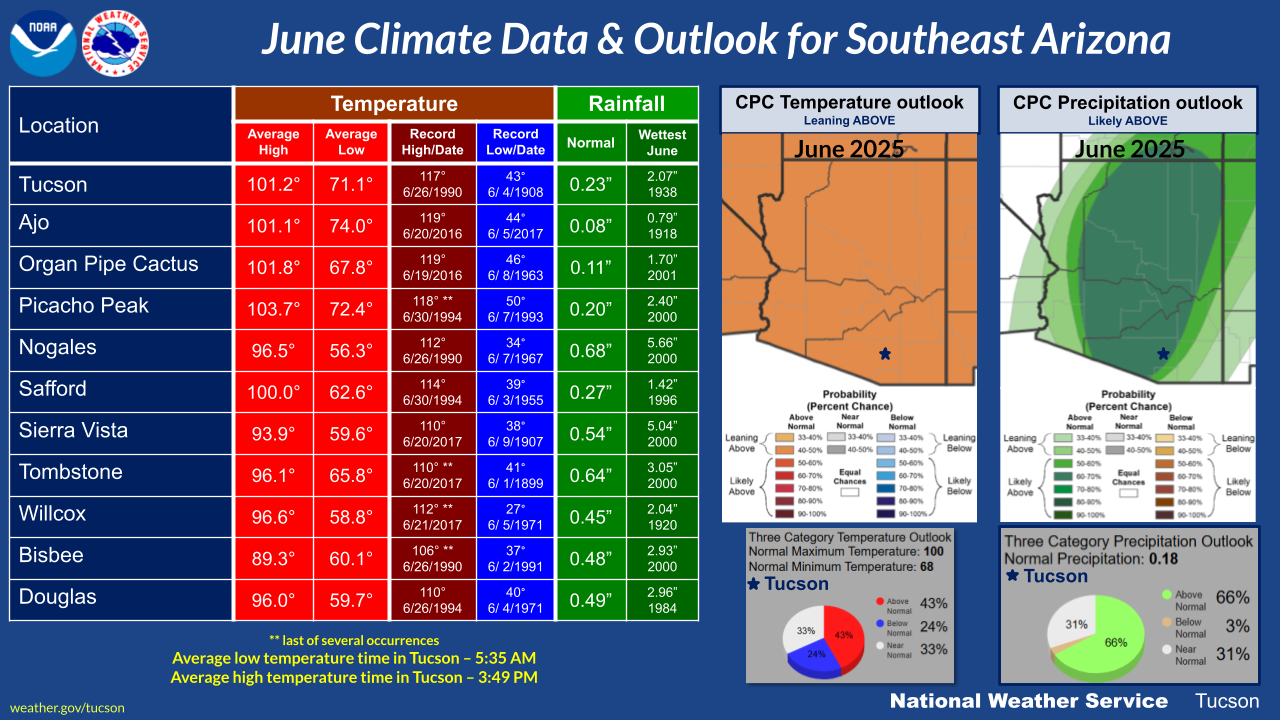
| Looking ahead into September |
|
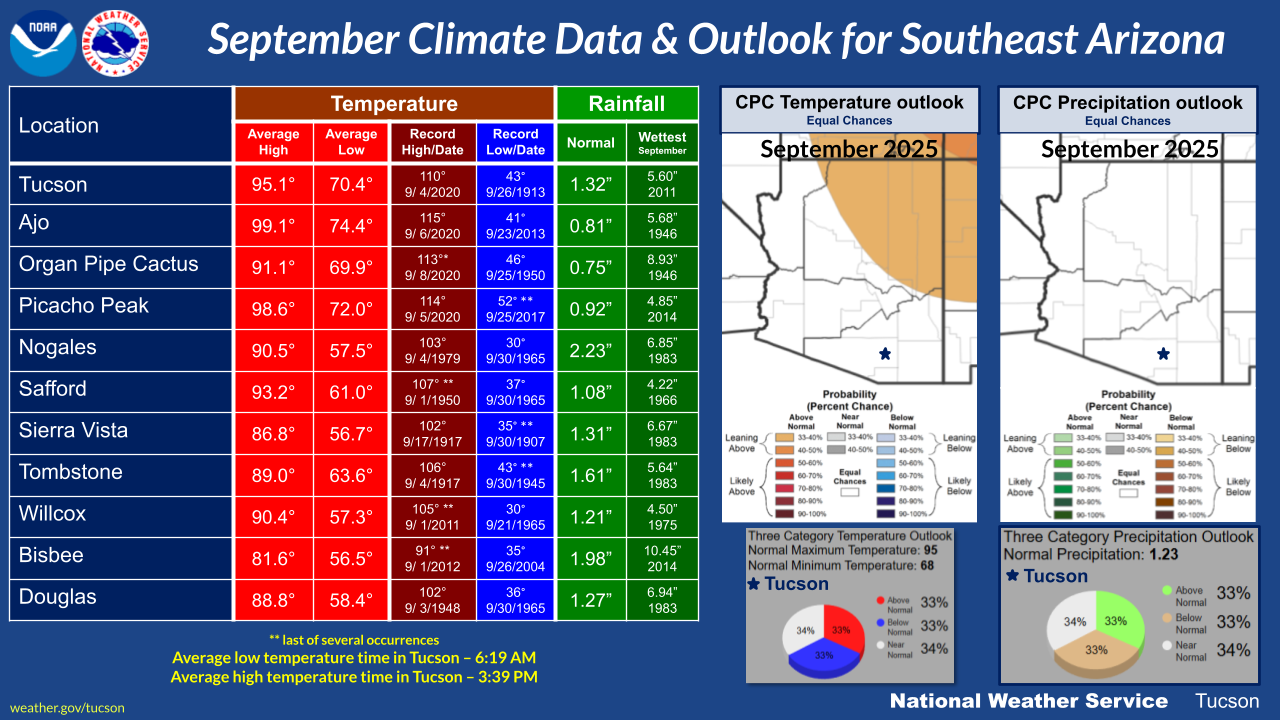
The September outlook from the Climate Prediction Center for Tucson is for equal chances for either below-, near- or above-normal monthly mean temperatures and total monthly precipitation amounts (33% above vs 33% below).
|
| |
| Normal monthly high temperature |
95.1° |
| Normal monthly low temperature |
70.4° |
| Normal monthly temperature |
82.8° |
| Record high temperature |
111° on September 10, 2023 |
| Record low temperature |
43° on September 26, 1913 |
| Warmest September (avg.) |
86.6° in 2024 |
| Coldest September (avg.) |
76.3° in 1964 |
| Normal rainfall |
1.32" |
| Wettest September day |
2.85" on September 10, 1964 |
| Wettest September |
5.60" in 2011 |
| Driest September |
0.00" in 1953 & 2020 |
| Daily normals | Daily records |
|
|
| The number of daylight hours will decrease from 12 hours 48 minutes and 14 seconds on the 1st to 11 hours 51 minutes and 54 seconds on the 30th, a loss of 56 minutes 20 seconds. |
| |
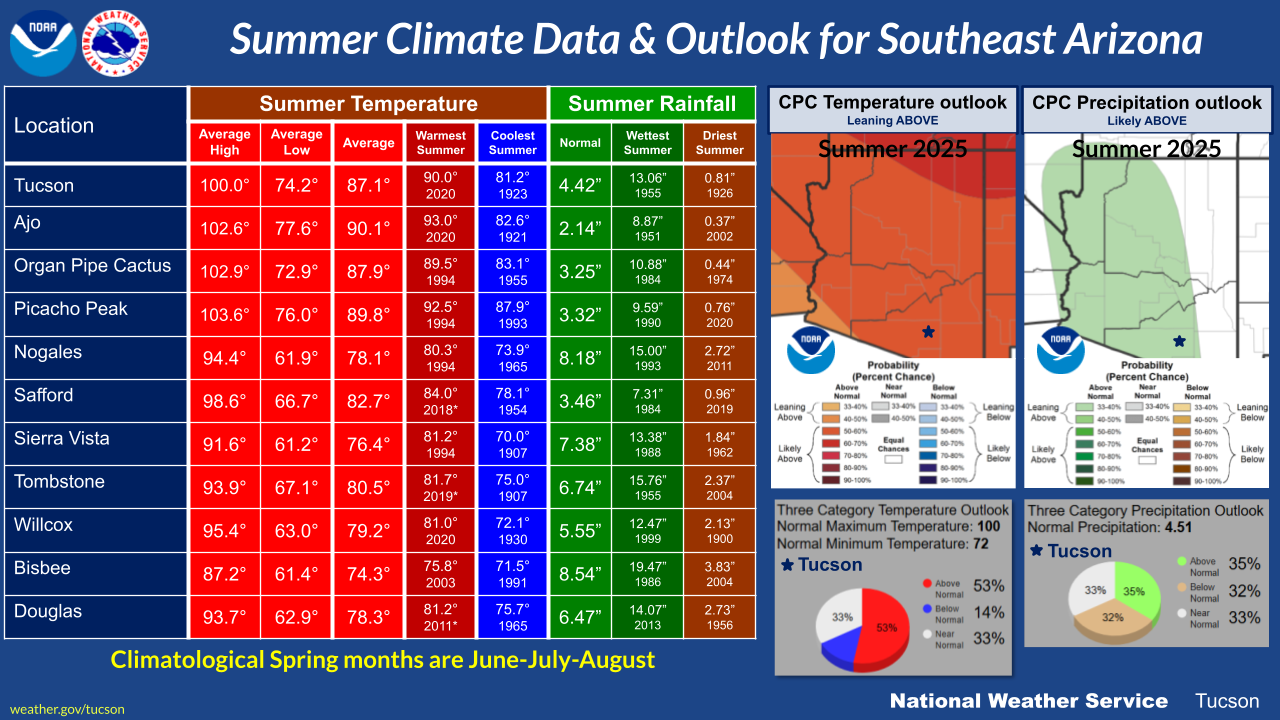
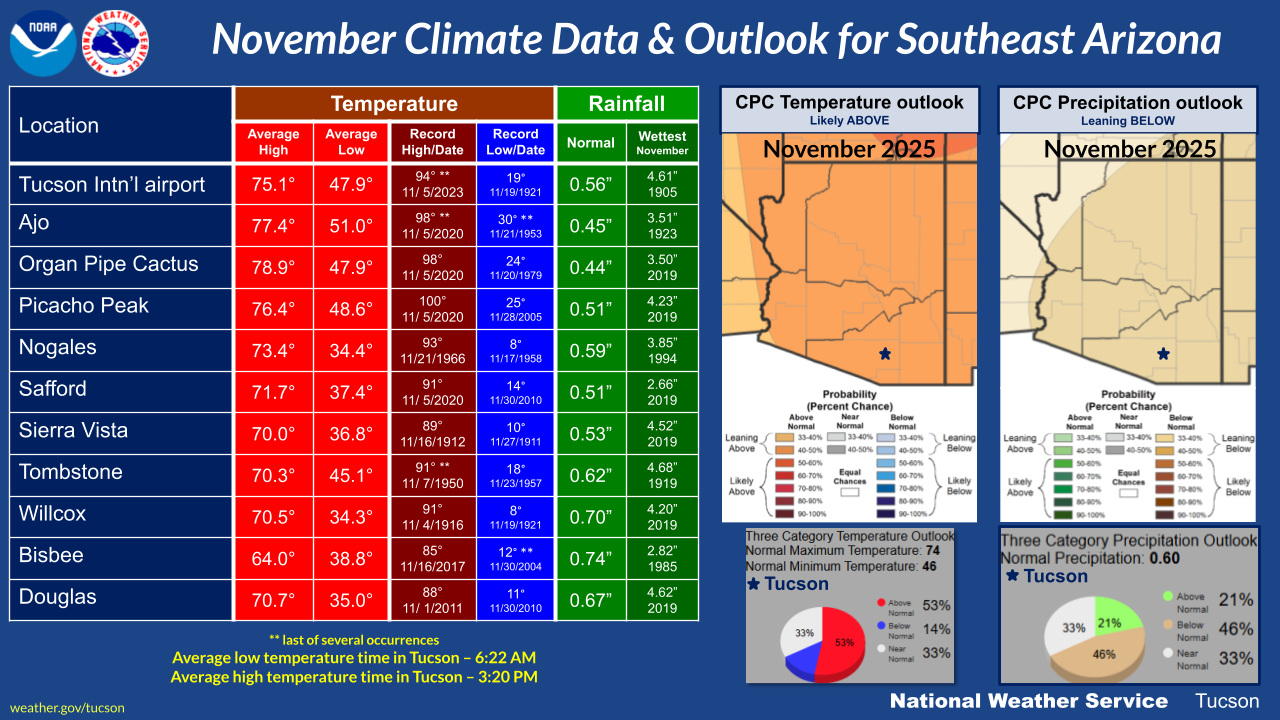
| Looking ahead into Fall |
| The Fall outlook from the Climate Prediction Center for Tucson strongly favors above-normal seasonal mean temperatures (53% above vs 14% below) and favors below-normal total precipitation amounts (38% below vs 29% above). |
| |
| Normal seasonal high temperature |
85.5° |
| Normal seasonal low temperature |
59.1° |
| Normal seasonal temperature |
72.3° |
| Warmest Fall (avg.) |
76.5° in 2017 |
| Coldest Fall (avg.) |
65.9° in 1919 |
| Normal Fall rainfall |
2.55" |
| Wettest Fall |
10.97" in 1983 |
| Driest Fall |
0.12" in 2017 |
| |
|
|
| The autumnal equinox, otherwise known as the beginning of fall, will occur on September 22nd at 11:19 AM when the sun begins to cross the equator into the southern hemisphere. |
| |
| Glueck |


