National Weather Service United States Department of Commerce

Latest Briefing


When a briefing has been issued, the book icon below will be opened.  Click on the open book to view a PDF containing the briefing.

Briefing icon

No briefing in effect.


When there is no briefing, a closed book icon will be displayed. Other sources of weather discussions or the Weather Story can be found at:
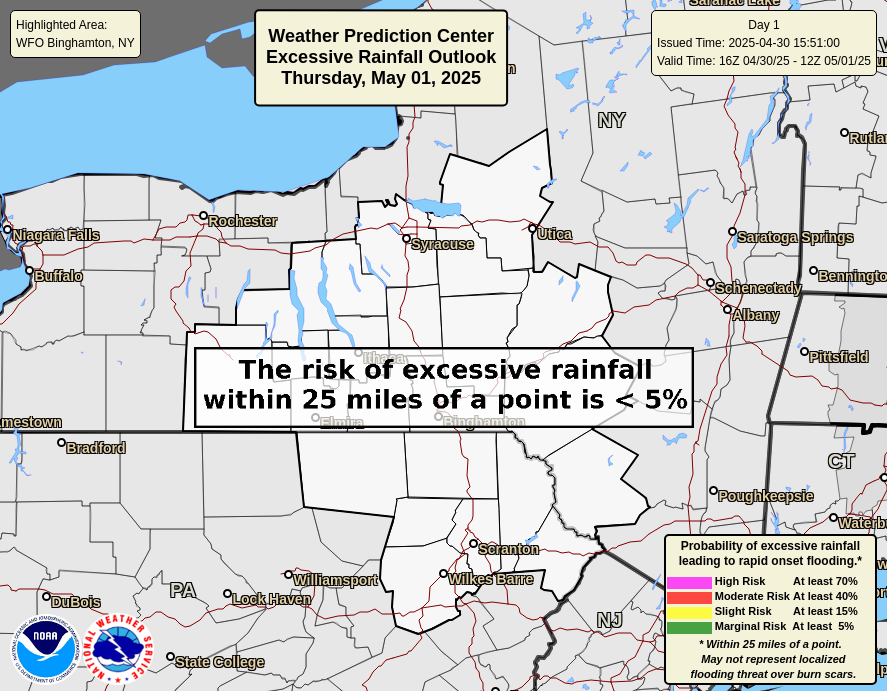


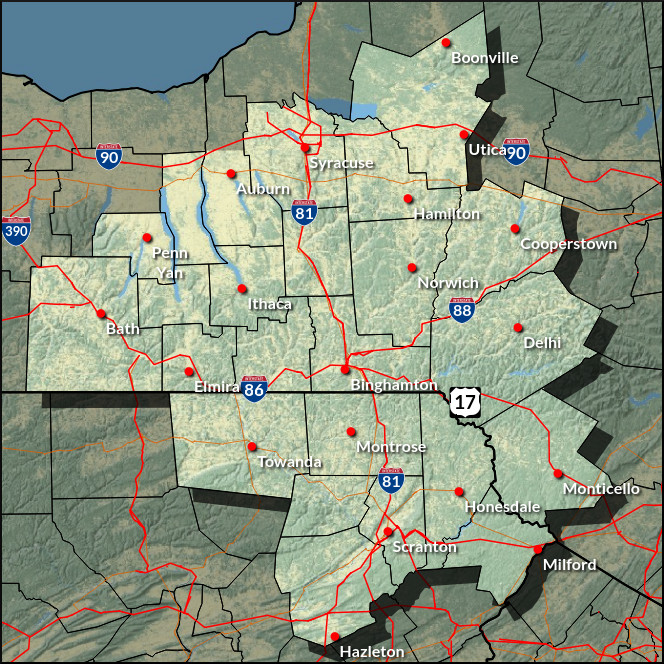
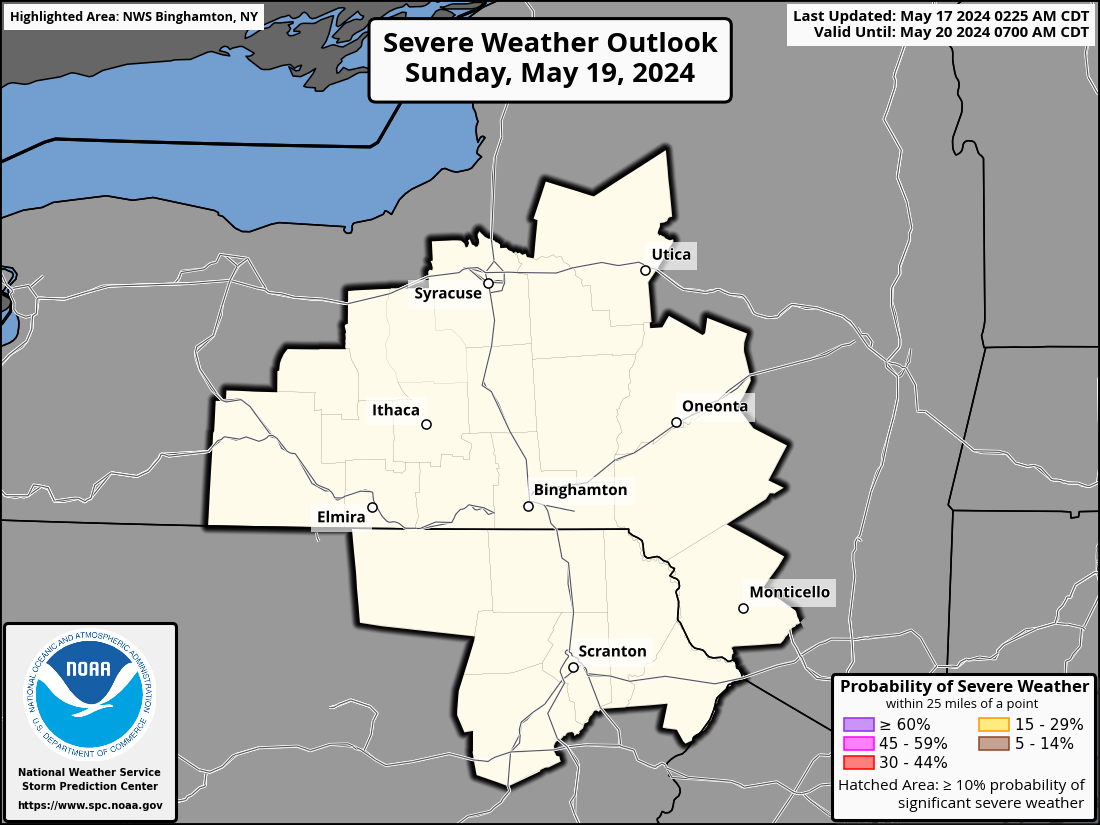
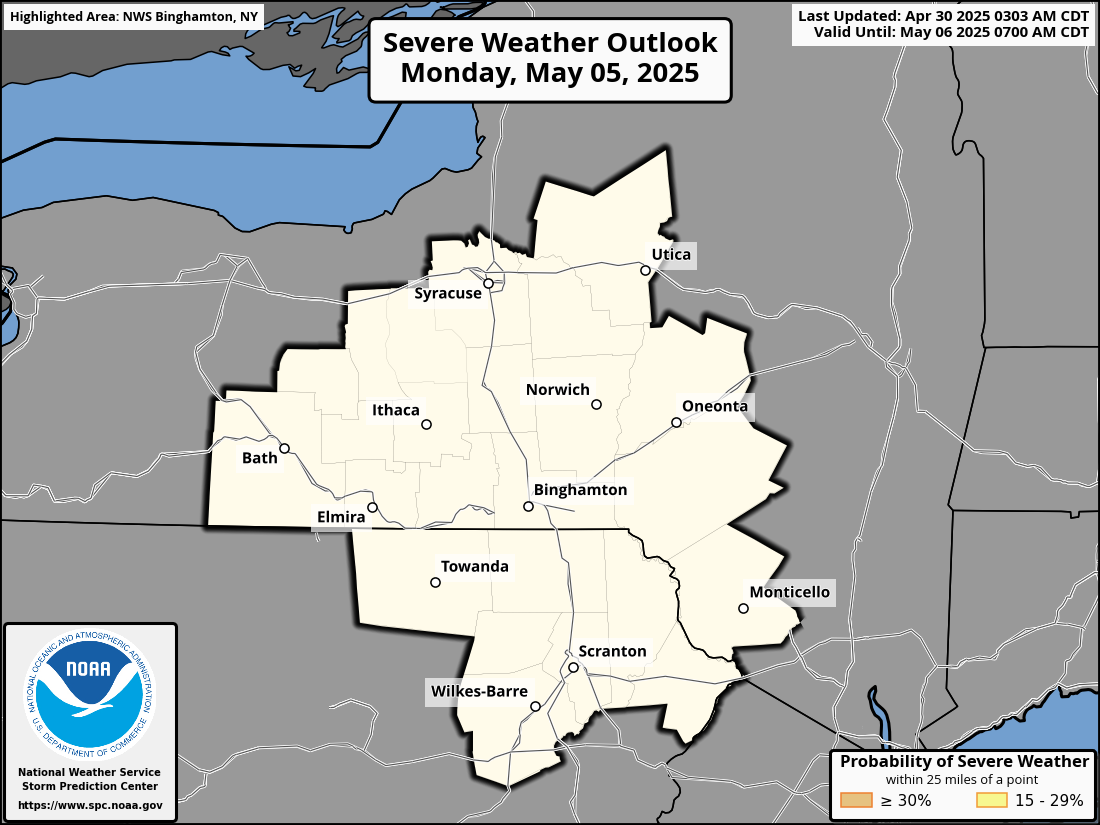
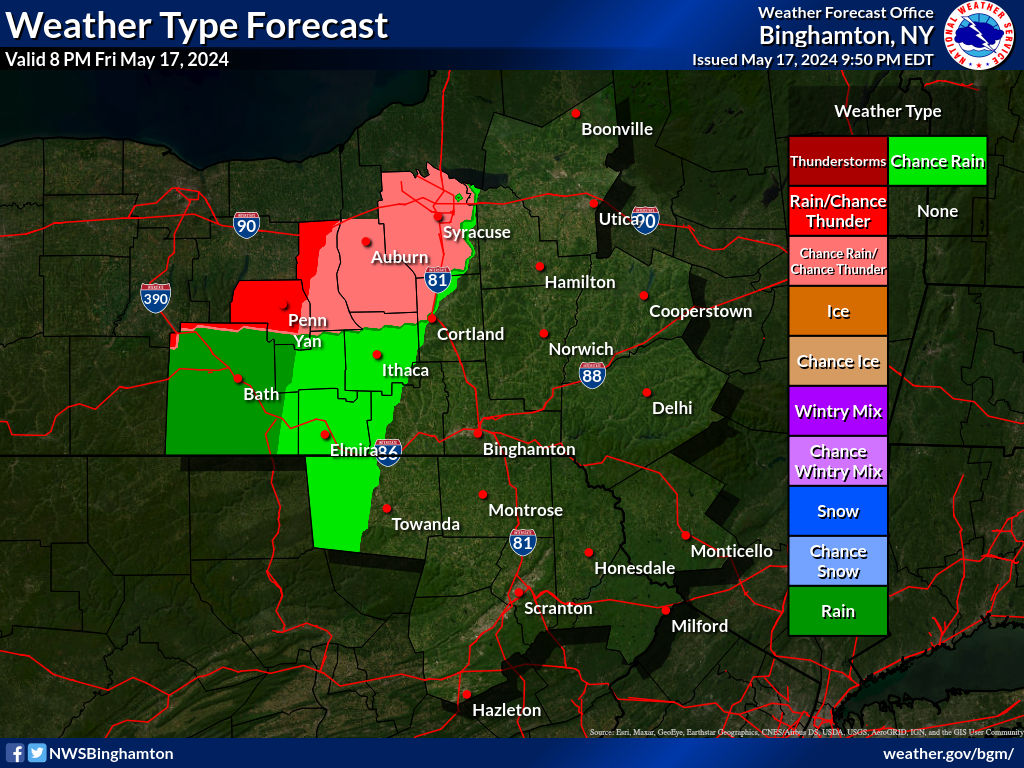
NWS Binghamton weather briefing are for the area show on the map below, this includes 17 counties in New York and 7 counties in Pennsylvania. This includes the cities of Elmira,Ithaca, Rome,Syracuse, Utica, and Scranton and Wilkes-Barre, to name a few.


NWS Binghamton County Warning Area (CWA)

NWS Binghamton County Warning Area  or CWA showing some cities in the area.

NWS Binghamton CWA with some cities shown.

Click for a larger view.

NWS Binghamton County Warning Area  or CWA showing counties.

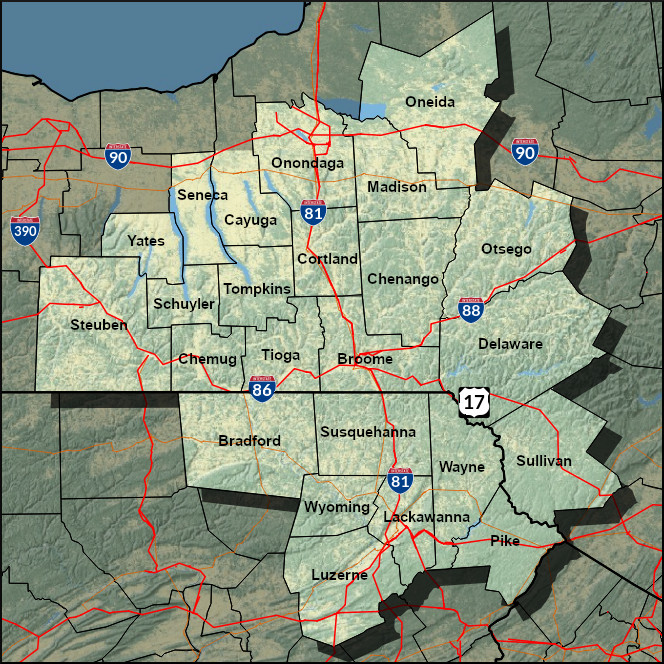
NWS Binghamton with county labels.

Click for a larger view.

Graphical Hazardous Weather Outlook
Albany, NY | Buffalo, NY | New York City, NY | Philadelphia, PA | State College, PA
Day 1 Severe Weather Outlook
Click image to view Outlooks for Days 1-8
Day 1 Excessive Rainfall Outlook
Click image to view Outlooks for Days 1-3
Snow & Ice Forecasts
Days 1-3 Winter Storm Severity Index
Tip: Click on the "x" on the Overlays menu to hide it. To get it back click on the 3 lines in the upper left corner of the map, then choose Overlays. Click on the map to see conditions or hazards that are in effect. May have zoom in.

Radar and Satellite

NWS Binghamton Radar Loop
NWS Binghamton, NY Radar Loop
Buffalo, NY Radar Image
Buffalo, NY
Montague, NY Radar Image
Montague, NY
Albany, NY Radar Image
Albany, NY
NWS Pittsburgh, PA Radar Image
Pittsburgh, PA
State College, PA Radar Image
State College, PA
NWS Mount Holly, NJ Radar Image
Mount Holly, NJ
Click Here for Regional Radar Mosaic


Regional GeoColor Satellite Image
GeoColor Satellite Image
Regional IR Satellite Image Infrared Satellite Image Regional Water Vapor Satellite Image
Water Vapor Image
GOES-East Visible  US Visible Satellite Image
GOES-East Lightning Mapper GOES-East Lightning Mapper
GOES-East Infrared  US Infrared Satellite Image
GOES-East Water Vapor  US Water Vapor Satellite Image More Imagery
Click Here for Satellite Imagery Zoomed in on Central, NY and Northeast, PA


Current Weather Maps

US Surface Analysis
United States Surface Analysis
US Surface Analysis with Radar
United States Surface Analysis with Radar
United States Surface Analysis with Satellite
US Surface Temps | N AmericaWorld


Additional Observations

Regional Weather Roundup Regional Temperature & Precipitation Summary NYS Mesonet
Keystone Mesonet
Road Conditiion for New York New York | Pennsylvania CoCoRaHS for New York | Pennsylvania River Observations for New York | Pennsylvania River Observations
National Precipitation Map National Snowfall Map WPC 1/3/6/24-hr Change Graphics

How Much Rain Has Fallen?

Last 24 Hours Last 48 Hours Month to Date


Flash Flood Guidance

Flash Flood Guidance (FFG) provides a general indication of the amount of rainfall evenly distributed over various durations (in hours), necessary to cause small streams to overflow their natural banks. During heavy rainfall, accurate interpretation of the guidance consists of the combination of rainfall that has already occurred plus any additional rainfall that can be confidently expected to fall over the same location in the immediate future.

It should be noted that FFG values represent estimates of average soil moisture and stream flow conditions. Flooding may occur with less rainfall than indicated in areas of high rainfall intensities, impervious surfaces, or steep slopes.

1 Hour 3 Hour 6 Hour


Rainfall Outlooks/Forecasts


Day 1 Excessive Rainfall Outlook Day 2 Excessive Rainfall Outlook Day 3 Excessive Rainfall Outlook Northeast River Flood Outlook
Flood Outlook


Day 1 Excessive Rainfall Outlook Day 2 Excessive Rainfall Outlook Day 3 Excessive Rainfall Outlook Middle Atlantic Flood Outlook
Middle Atlantic Basin Flood Outlook


Day 1 Precipitation Day 2 Precipitation Day 3 Precipitation
Day 4-5 Precipitation Day 6-7 Precipitation 7-Day Total Precipitation


Additional Resources

Thunderstorms
(no label)


No severe* thunderstorms expected.

1. Marginal
(MRGL)


Isolated severe storms possible.

2. Slight
(SLGT)


Scattered severe storms possible.

3. Enhanced
(ENH)


Numerous severe storms possible.

4. Moderate
(MDT)


Widespread severe storms likely.

5. High
(HIGH)


Widespread severe storms expected.

*NWS defines a severe thunderstorm as a measured wind gusts of at least 58 miles per hour (93 km/h), and/or hail to at least 1 inch (2.5 cm), and/or a tornado. All thunderstorms catgories imply lightning and the potential for flooding. Categories are also tied to the probability of a severe weather event within 25 miles of your location.


Day 1 Severe Weather Outlook Day 1 Tornado Outlook Day 1 Severe Wind Outlook Day 1 Severe Hail Outlook
SPC Day 1 Outlook Narrative
 
Day 2 Severe Weather Outlook Day 2 Tornado Outlook Day 2 Severe Wind Outlook Day 2 Severe Hail Outlook
SPC Day 2 Outlook Narrative
 
Day 3 Severe Weather Outlook Day 3 Probability of Severe Weather
SPC Day 3 Outlook Narrative


Day 4 Severe Weather Outlook Day 5 Severe Weather Outlook Day 6 Severe Weather Outlook Day 7 Severe Weather Outlook Day 8 Severe Weather Outlook
SPC Day 4-8 Outlook Narrative


Current Watches
Current SPC Convective Watches
Storm Trend Discussions
Today's Storm Reports
Yesterday's Storm Reports


Local Storm Reports Text Products NWS Buffalo, NY NWS State College, PA NWS Binghamton, NY NWS Albany, NY NWS Mount Holly, NJ


Additional Resources

Observed Temperatures

Choose Element:
 

Current Observed Graphic DescriptionsShow HelpClose Help

  • Temperature - A measure of the warmth of the ambient air measured by a suitable instrument such as a thermometer.


  • Dew Point (Dew-Point Temperature) - A measure of atmospheric moisture. The temperature to which air must be cooled, at constant pressure and moisture content, in order for saturation to occur. The higher the dew point, the greater amount of water vapor in the air mass.


  • Wind - The horizontal motion of the air past a given point. Winds begin with differences in air pressures. Pressure that's higher at one place than another sets up a force pushing from the high toward the low pressure. The greater the difference in pressures, the stronger the force. The distance between the area of high pressure and the area of low pressure also determines how fast the moving air is accelerated. Meteorologists refer to the force that starts the wind flowing as the "pressure gradient force." High and low pressure are relative. There's no set number that divides high and low pressure. Wind is used to describe the prevailing direction from which the wind is blowing with the speed given usually in miles per hour or knots.


    Sustained Wind Speed Descriptive Term
    40 mph or greater Strong, dangerous, or damaging
    30-40 mph Very Windy
    20-30 mph Windy
    15-25 mph Breezy, Brisk, or Blustery
    5-15 mph or 10-20 mph None
    0-5 mph Light or light and variable wind


  • Relative Humidity - A dimensionless ratio, expressed in percent, of the amount of atmospheric moisture present relative to the amount that would be present if the air were saturated. Since the latter amount is dependent on temperature, relative humidity is a function of both moisture content and temperature. As such, relative humidity by itself does not directly indicate the actual amount of atmospheric moisture present.


  • Apparent Temperature - Heat Index - The apparent temperature is used to show heat index. Heat index is an accurate measure of how hot it really feels when the Relative Humidity (RH) is added to the actual air temperature. To find the Heat Index (HI), look at the Heat Index (HI) Chart. As an example, if the air temperature is 90°F (found at the left side of the table) and the Relative Humidity (RH) is 70% (found at the top of the table), the Heat Index (HI)--or how hot it actually feels--is 106°F. This is at the intersection of the row 90°F and the 70% column. This index was devised for shady, light wind conditions. Exposure to full sunshine can increase Heat Index (HI) values by up to 15°F. Also strong winds, particularly with very hot, dry air, can be extremely dangerous. Any value Heat Index (HI) greater than 105°F is in the Danger Category.

    Heat Index Chart


    Category Classification Heat Index/Apparent Temperature (°F) General Affect on People in High Risk Groups
    IV Extremely Hot 130°F or Higher Heat/Sunstroke HIGHLY LIKELY with continued exposure
    III Very Hot 105°F - 130°F Sunstroke, heat cramps, or heat exhaustion LIKELY, and heatstroke POSSIBLE with prolonged exposure and/or physical activity
    II Hot 90°F - 105°F Sunstroke, heat cramps, or heat exhaustion POSSIBLE with prolonged exposure and/or physical activity
    I Very Warm 80°F - 90°F Fatigue POSSIBLE with prolonged exposure and/or physical activity


  • Apparent Temperature - Wind Chill - The Apparent temperature is used to show wind chill. The wind chill temperature is based on the rate of heat loss from exposed skin caused by wind and cold and is to give you an approximation of how cold the air feels on your body. As the wind increases, it removes heat from the body, driving down skin temperature and eventually the internal body temperature. Therefore, the wind makes it FEEL much colder. If the temperature is 0°F and the wind is blowing at 15 mph, the wind chill temperature is -19°F. At this level, exposed skin can freeze in just a few minutes. The only effect wind chill has on inanimate objects, such as car radiators and water pipes, is to shorten the amount of time for the object to cool. The inanimate object will not cool below the actual air temperature. For example, if the temperature outside is -5°F and the wind chill temperature is -31°F, then your car's radiator temperature will be no lower than the air temperature of -5°F.

    WindChill Chart


Additional Resources

Drought Category Description Possible Impacts
D0 Abnormally Dry
  • Going into drought: Short-term dryness slowing planting, growth of crops and pastures.
  • Coming out of drought: some lingering water deficits, pastures or crops not fully recovered.
D1 Moderate Drought Some damage to crops and pastures. Water shortages developing or imminent. Water restrictions may be imposed.
D2 Severe Drought Crop or pasture losses likely. Water shortages common. Water restrictions imposed, and voluntary conservation encouraged.
D3 Extreme Drought Major crop/pasture losses. Widespread water shortages or restrictions. Water reserves are significantly depleted.
D4 Exceptional Drought Exceptional and widespread crop/pasture losses. Shortages of water in reservoirs, streams, and wells. Emergency measures implemented.


Seasonal Drought Outlook Palmer Drought Severity Index


Additional Information

For the latest forecast information, visit:


Space Weather Overview Aurora Forecast
SWPC Space Weather Overview SWPC Aurora Forecast
Click here for more geomagnetic information/forecasts from the Space Weather Prediction Center.
Days 3-7 Hazards Outlook (WPC)


Days 8-14 Hazards Outlook (CPC) Days 8-14 Risk of Hazardous Temperatures (CPC) Days 8-14 Risk of Heavy Precipitation (CPC)


6-10 Day Temperature Outlook (CPC) 6-10 Day Precipitation Outlook (CPC)
8-14 Day Temperature Outlook (CPC) 8-14 Day Precipitation Outlook (CPC)
**Experimental** Week 3-4 Temperature Outlook (CPC) **Experimental** Week 3-4 Precipitation Outlook (CPC)
One Month Temperature Outlook (CPC) One Month Precipitation Outlook (CPC)
Three Month Temperature Outlook (CPC) Three Month Precipitation Outlook (CPC)

Additional Resources


Weather Type Forecast