
February 23rd, 2016 Tornado/Severe Weather Event
A well-forecasted severe thunderstorm event unfolded during the afternoon hours of February 23, 2016. Multiple reports of wind damage and tornadoes were received as storms impacted the area over the afternoon and evening hours. This event came just 8 days after another significant severe event generated the first documented EF-3 tornado in Escambia County, FL since the National Weather Service began using the Fujita scale to rate tornadoes in 1973. The Pensacola tornado that evening would be the second EF-3 in a little over a week.

Figure 1: Preliminary Storm Reports 2/23/2016
Thunderstorm Ingredients
The Storm Prediction Center in Norman, Oklahoma first included the north central Gulf Coast in a ‘Slight Risk’ area for severe thunderstorms 3 days prior to the event. As the details of the event came into focus by the 22nd, the area was upgraded to a Moderate Risk with mention of the possibility for significant (EF-2 or stronger) tornadoes. The atmosphere was conducive for damaging storms as the afternoon and evening hours progressed on the 23rd. A deep trough of low pressure evolved into a closed low over eastern Texas and Arkansas with a strong wind maximum of 100 knots located to the south of the low center across the northern Gulf Coast. Strong diffluence ahead of this feature contributed to favorable conditions for lifting of unstable surface parcels in thunderstorm updrafts.

Figure 2: 500mb heights, temperatures and Winds
At about 5000 feet above ground level (850mb) there was a 50-60 knot southerly Low Level Jet (LLJ) of air coming off the moist Gulf of Mexico. These strong winds brought copious moisture and contributed to very strong wind shear across the region. Typically, greater than 40 knots of wind shear is when we start to look for the possibility of supercell thunderstorms. This event was characterized by 50-60 knots of wind shear, more than sufficient for updraft rotation. In addition, there was strong turning and increasing wind speeds in the lowest 1km of the atmosphere, resulting in 400-500 m2/s2 of Storm Relative Helicity (SRH). Values in this range signal the possibility for strong to violent tornadoes.

Figure 3: 850mb Height, Temp and Dew Points
Figure 4: Effective Bulk Shear
Figure 5: 0-1km Storm Relative Helicity
Cold season severe events on the Gulf Coast are typically constrained by lack of instability. Widespread cloudy conditions preceding the event led to very little in the way of surface heating with surface and mixed layer Convective Available Potential Energy (SBCAPE and MLCAPE, respectively) generally less than 1000 J/kg. However, given the extremely intense wind fields and favorable mid and upper level support for rising motion, these relatively low levels of instability were more than sufficient for severe thunderstorms and tornadoes.
Figure 6: Mixed-Layer CAPE and CIN
One way to see how all the ingredients for severe weather come together is with a plot of variables measured by weather balloons. The National Weather Service in Slidell, LA (LIX) launched a special sounding at noon on the 23rd that shows both sufficient instability and very strong wind shear. This environment advected across the Mobile NWS’s area of responsibility during the afternoon and evening and is generally representative of conditions in which the severe thunderstorms formed.
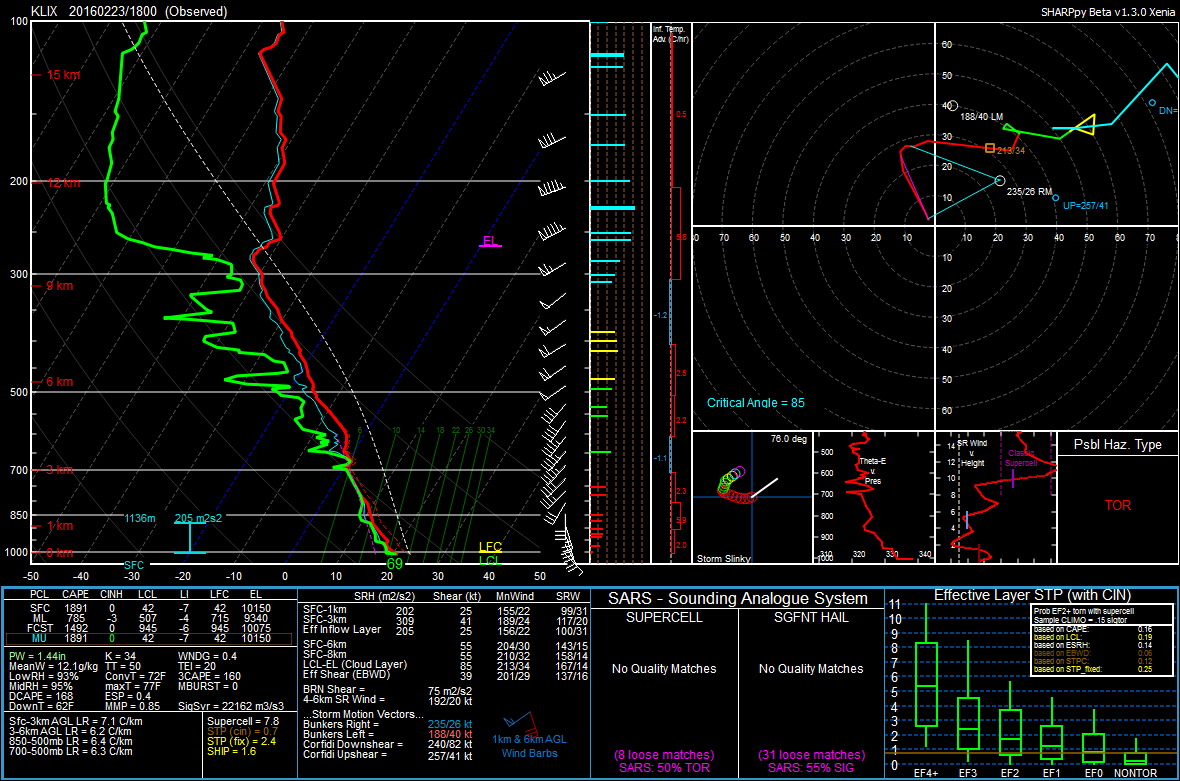
Figure 7: 18UTC Special Sounding from KLIX
The Storm Prediction Center issued a relatively rare Particularly Dangerous Situation (PDS) Tornado Watch for the region at 2:15pm
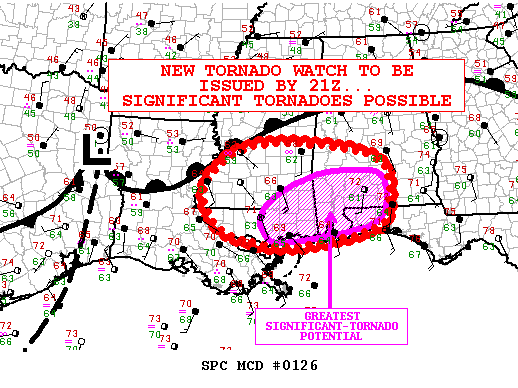
Figure 8: Mesoscale Discussion on the possibility of significant tornadoes.
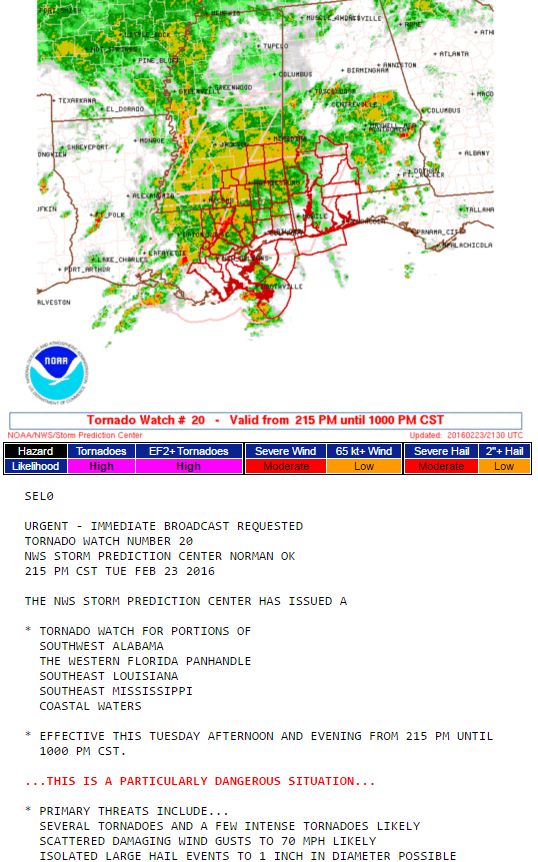
Figure 9: PDS Tornado Watch
Mississippi Tornadoes
Three separate EF-1 tornadoes occurred across parts of Greene and far southeastern Wayne counties in Mississippi, along with sporadic areas of straight-line wind damage.

Figure 10: Tornado Tracks across Greene and Wayne Counties, MS

Figure 11: Reflectivity and Base Velocity from KMOB
Details on individual storm surveys can be found on the initial event page at www.weather.gov/mob/20160223_tornado.
Pensacola Tornado
The supercell thunderstorm that spawned the Pensacola EF-3 tornado took shape over the Gulf of Mexico hours before impact. Forecasters at the Mobile National Weather Service watched as a strong area of rotation developed and headed towards the coast between Gulf Shores and Orange Beach, AL. The circulation weakened as the storm came on shore and continued to head to the north and east across southern portions of Escambia County, FL. The area of rotation re-intensified as the supercell approached the western suburbs of Pensacola. Damage was reported at the circulation neared the I-10 corridor and continued off to the north and east across Escambia Bay and into western Santa Rosa County before lifting.
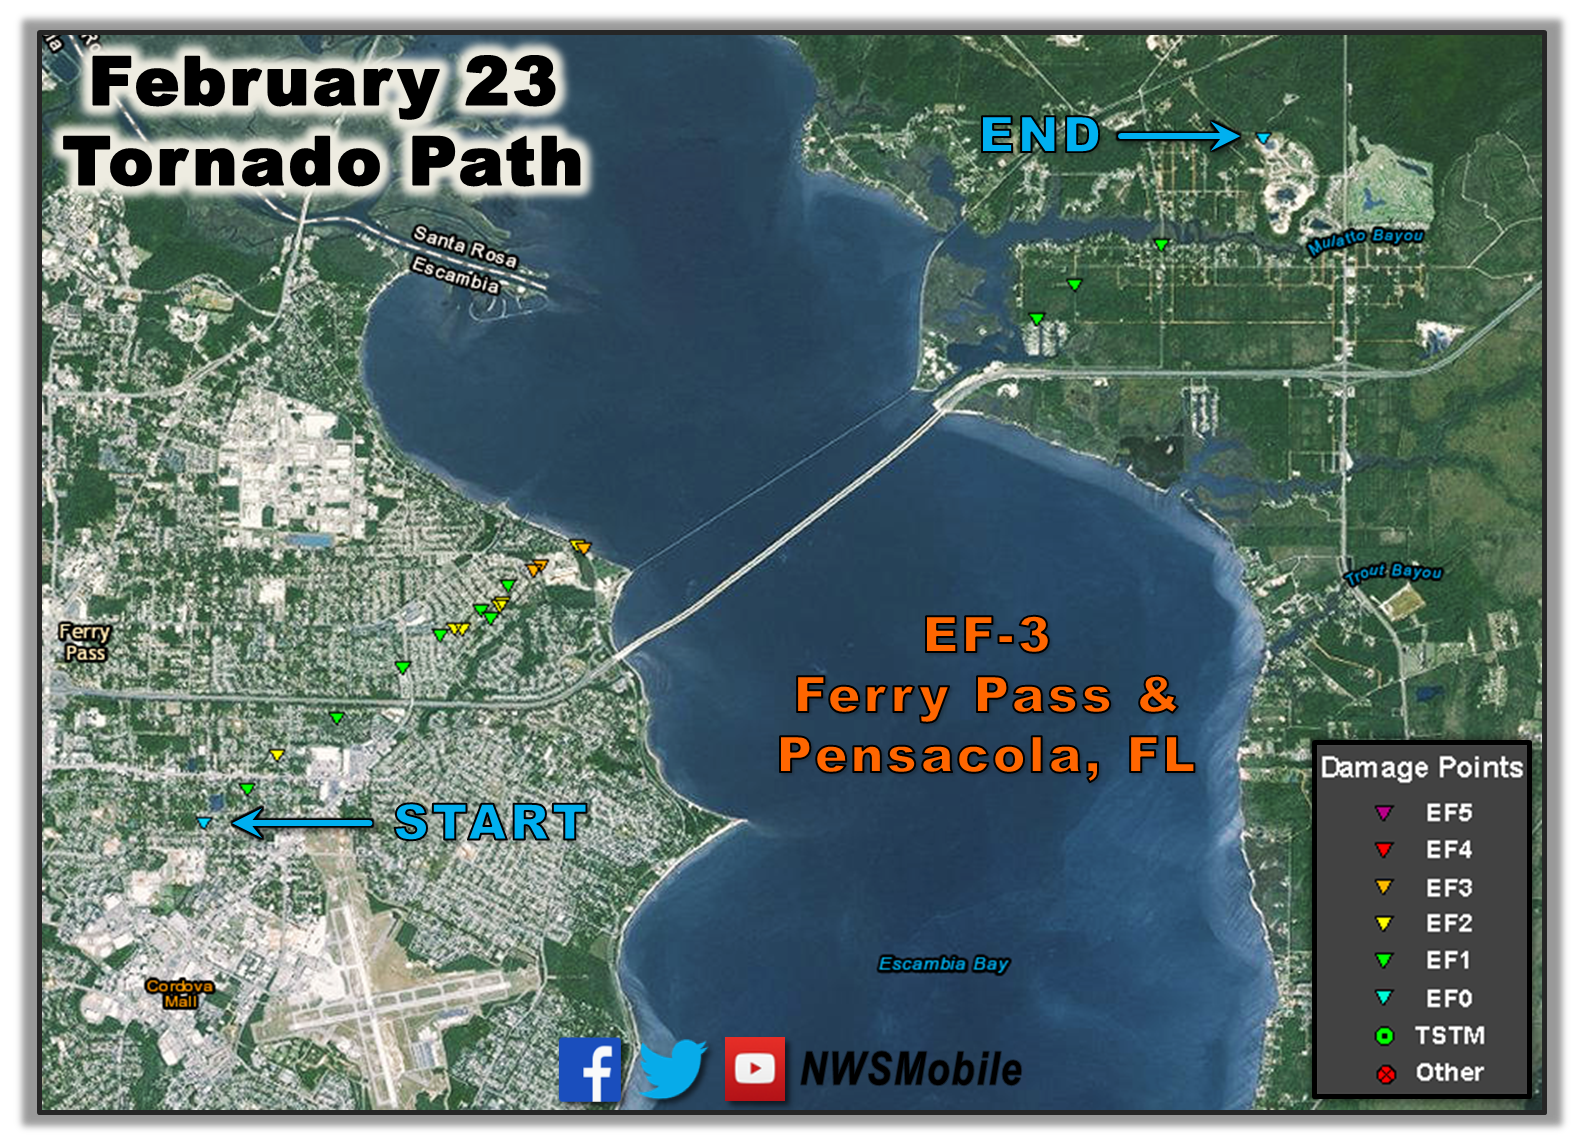
Figure 12: Pensacola EF-3 Tornado Path
Figure 13: Reflectivity and Base Velocity from KMOB for the Pensacola tornado
Details on storm survey from the Pensacola EF3 Tornado can be found on the initial event page at www.weather.gov/mob/20160223_tornado.
Acknowledgements: Page created by Ryan Rogers (forecaster) and updated by Morgan Barry (forecaster).
LAST UPDATED: February 2017

