Widespread life-threatening flash and urban flooding continues in south-central Texas, with considerable flooding impacts possible across central Texas. Wildfire smoke is impacting air quality across much of the Great Lakes region into southern New England and the Mid-Atlantic. Monsoonal thunderstorms may produce isolated to scattered flash flooding across the Southwest into the Great Basin. Read More >
August 2020 finished near to as much as four degrees above average on a whole across the area. An extended period of near to above average temperatures took place from the middle of the month until around the 27th. Of note, Pierre reached 90 degrees 17 times this August (above average) compared to just one time last August (record fewest). Pierre’s warmest temperature this August was 106 F on the 25th, which was the warmest day since July 9th, 2017 (also 106 F).
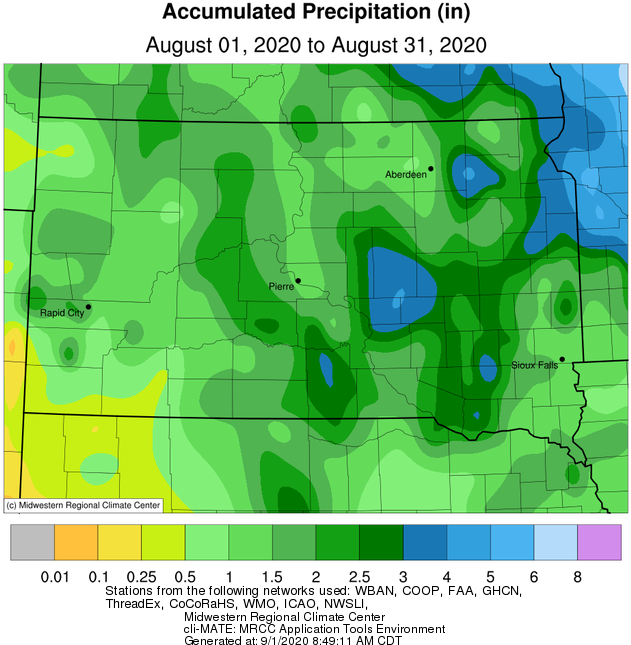
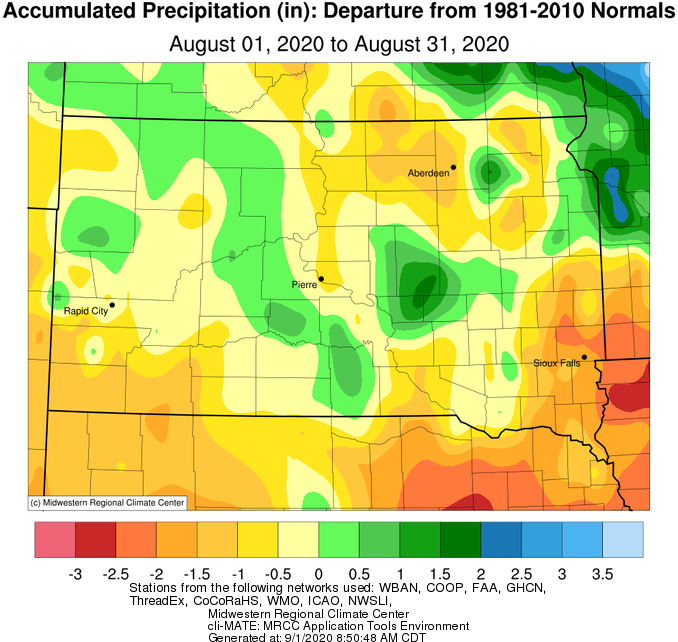
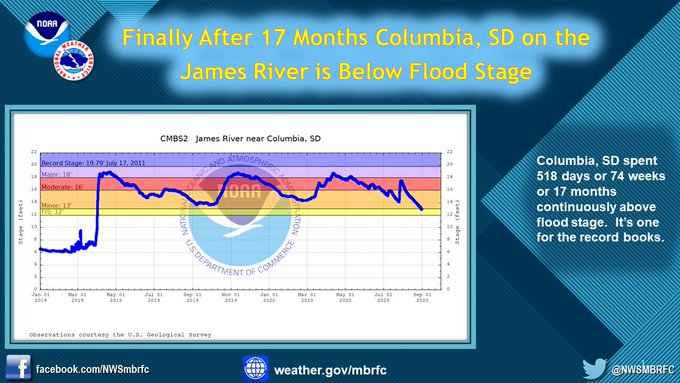
Precipitation-wise, the area ranged quite a bit from pockets of up to 2” above average to pockets of up to 1.5” below average. Abnormally dry to drought conditions persisted or slightly worsened through the month for many, due to the generally spotty nature of precipitation. Thanks in part to the drier than average weather, the James River at Columbia finally fell below flood stage on August 30th, after 518 consecutive days of being in flood stage (began March 31st, 2019).
Two significant severe weather events took place late in the month. The first involved an overnight line of thunderstorms from the 27th-28th, responsible for 100+ mph wind gusts as well as tornadoes across central into east central South Dakota (https://www.weather.gov/abr/SummaryOfTheAugust26-282020SevereWeather). The second involved a significant tornado in Hand County on August 30th (https://www.weather.gov/abr/August30_2020_Tornado).
|
August 2020 |
||||
|
Temperature Data |
Aberdeen |
Sisseton |
Wheaton |
Watertown |
|
Warmest Temperature / Date |
96 / 22nd |
93 / 22nd |
89/13, 22, 23 |
92 / 23rd |
|
Coldest Temperature / Date |
50 / 4th |
47 / 3, 4th |
53 / 3, 4th |
48 / 3rd |
|
Average High / Departure from Normal |
86.3 / +4.5 |
82.4 / +1.6 |
81.5 / +0.8 |
82.2 / +2.3 |
|
Average Low / Departure from Normal |
59.6 / +3.4 |
57.5 / +0.1 |
61.5 / +3.3 |
59.3 / +2.1 |
|
Monthly Average / Departure from Normal |
73 / +4.0 |
70.0 / +0.9 |
71.5 / +2.1 |
70.7 / +2.1 |
|
Precipitation Data |
|
|
|
|
|
Monthly Precipitation / Departure from Normal |
1.19 / -1.24 |
2.28 / -0.16 |
3.83 / +1.01 |
1.82 / -0.96 |
|
Most Precipitation in 24 hours / Date |
0.49 / 12th |
0.49 / 24th |
1.43 / 1st |
0.59 / 30th |
|
Monthly Snowfall / Departure from Normal |
N/A |
N/A |
N/A |
N/A |
|
Most Snow in 24 hours / Date |
N/A |
N/A |
N/A |
N/A |
|
Temperature Data |
Pierre |
Kennebec |
Mobridge |
Timber Lake |
|
Warmest Temperature / Date |
106 / 25th |
104 / 25th |
98/22,23,25 |
98 / 19, 25th |
|
Coldest Temperature / Date |
45 / 31st |
45 / 31st |
49 / 29th |
43 / 31st |
|
Average High / Departure from Normal |
90.0 / +2.7 |
91.7 / +3.3 |
88.4 / +3.6 |
88.0 / +2.6 |
|
Average Low / Departure from Normal |
59.6 / -0.5 |
59.8 / -0.2 |
60.6 / +2.7 |
59.1 / +1.2 |
|
Monthly Average / Departure from Normal |
74.8 / +1.1 |
75.6 / +1.4 |
74.5 / +3.1 |
73.8 / +2.2 |
|
Precipitation Data |
|
|
|
|
|
Monthly Precipitation / Departure from Normal |
1.12 / -0.68 |
1.16 / -0.77 |
1.04 / -0.99 |
2.27 / +0.56 |
|
Most Precipitation in 24 hours / Date |
0.65 / 7th |
0.36 / 28th |
0.39 / 12th |
1.11 / 26th |
|
Monthly Snowfall / Departure from Normal |
N/A |
N/A |
N/A |
N/A |
|
Most Snow in 24 hours / Date |
N/A |
N/A |
N/A |
N/A |
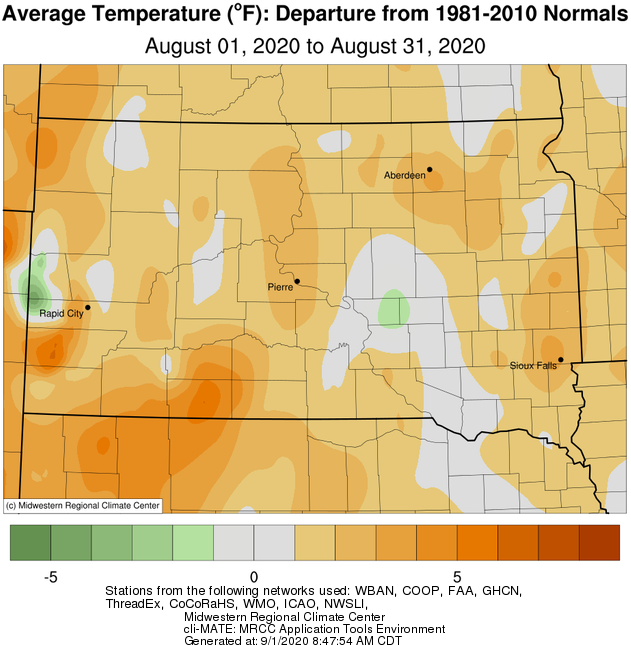
Temperature departures from normal for August 2020, from the Midwestern Regional Climate Center
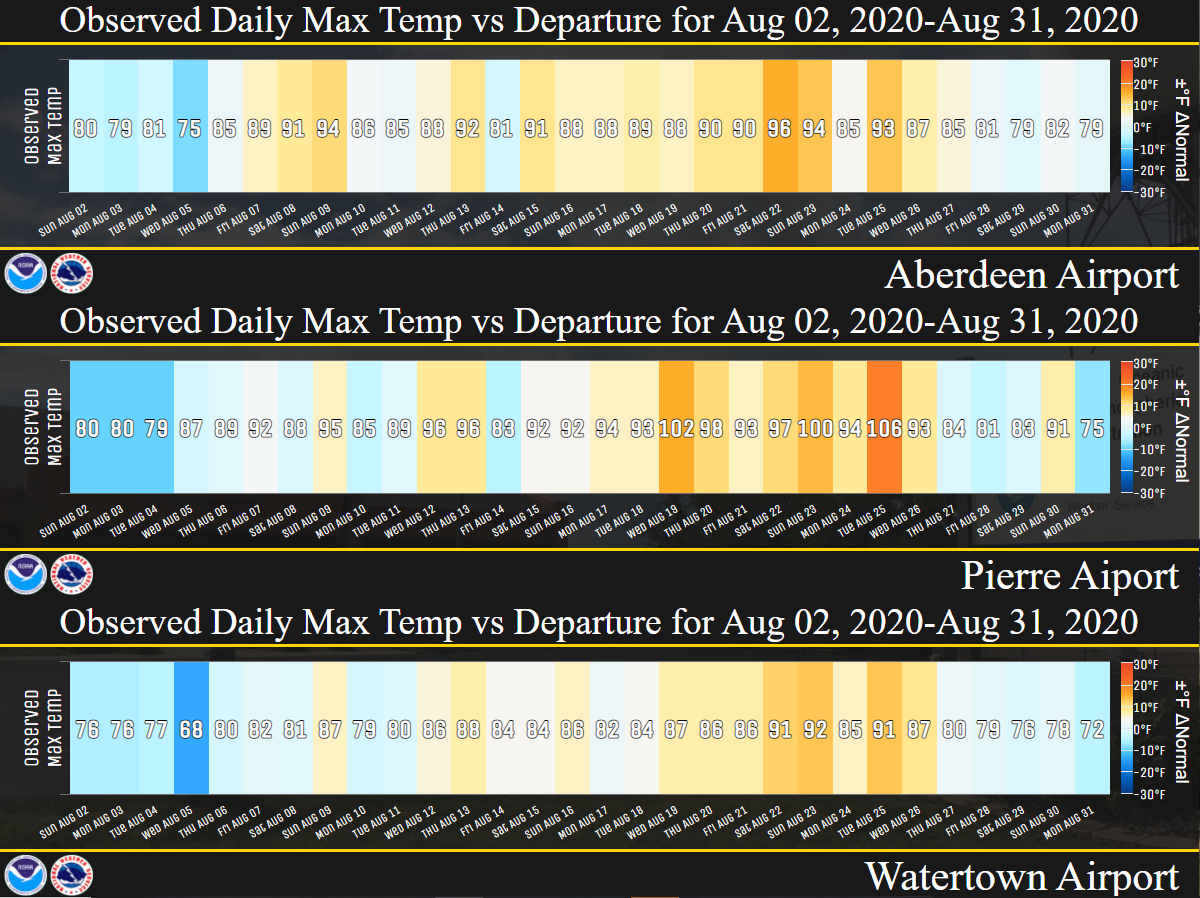
Daily max temperatures (values) and departures from normal (shading) in August for Aberdeen, Pierre and Watertown (in that order from top to bottom).
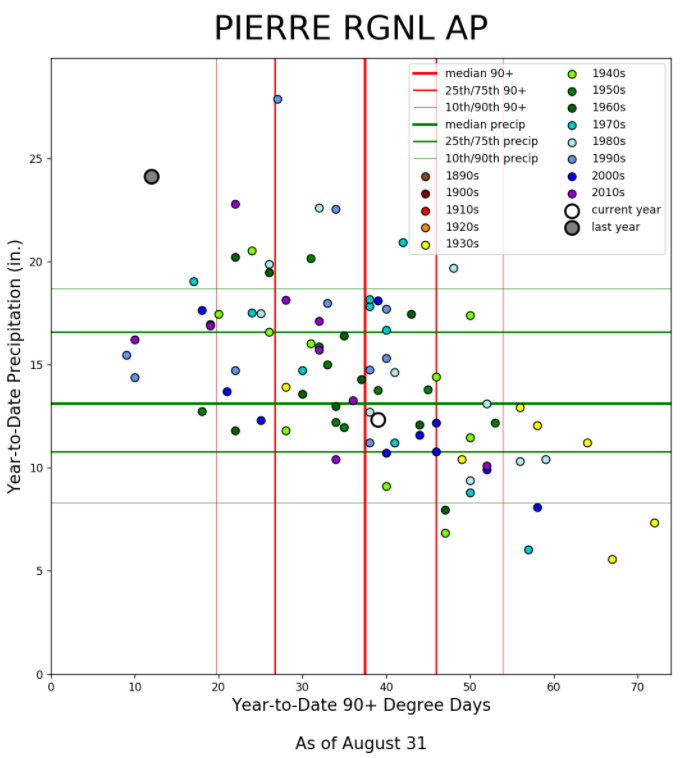
A new climate visualization tool from NWS Rapid City, SD which displays every year in the climate database as an individual dots. These dots are placed on the chart based on the number of 90+ degree days (x axis) and total precipitation (y axis), both year-to-date. Notice in the example below for Pierre how this year (larger white dot) falls near the cross hairs of the thickest red and green lines, which represent the average, whereas 2019 (the large grey dot) was an extreme in terms of very few 90+ degree days and nearly 25" of precipitation. This page has several different climate locations for viewing, and updates daily.
Precipitation totals (left) and departures from normal (right) for August 2020, from the Midwestern Regional Climate Center
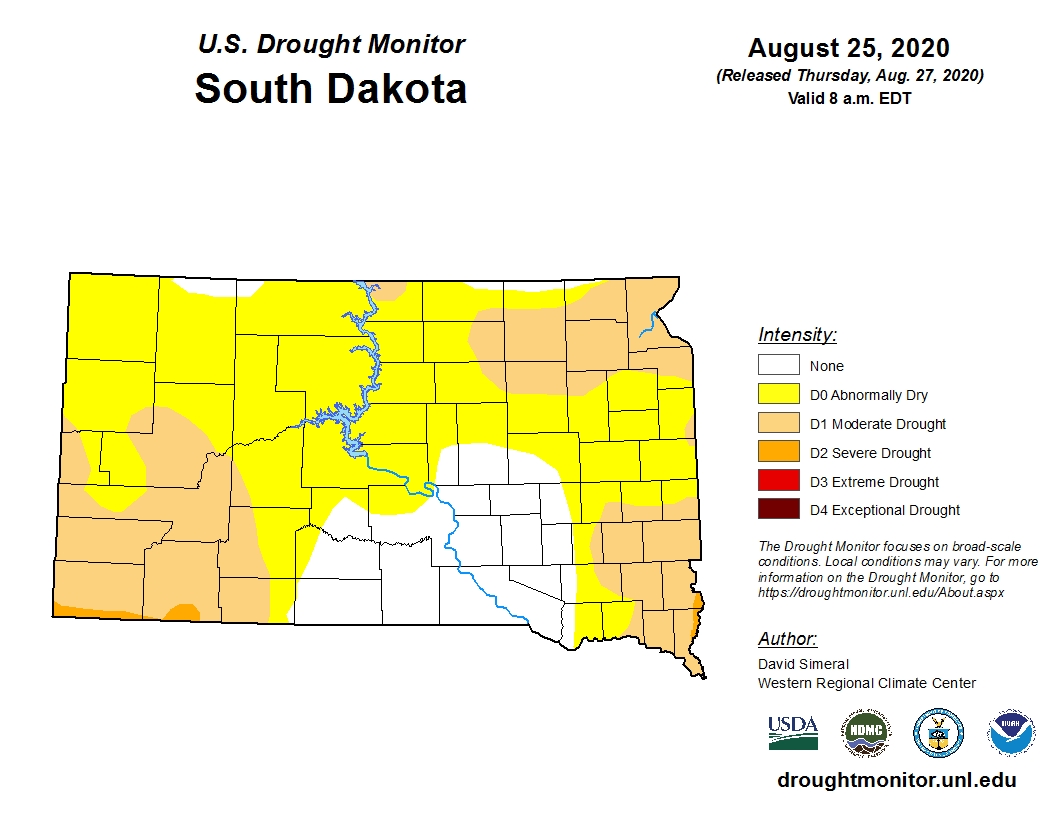
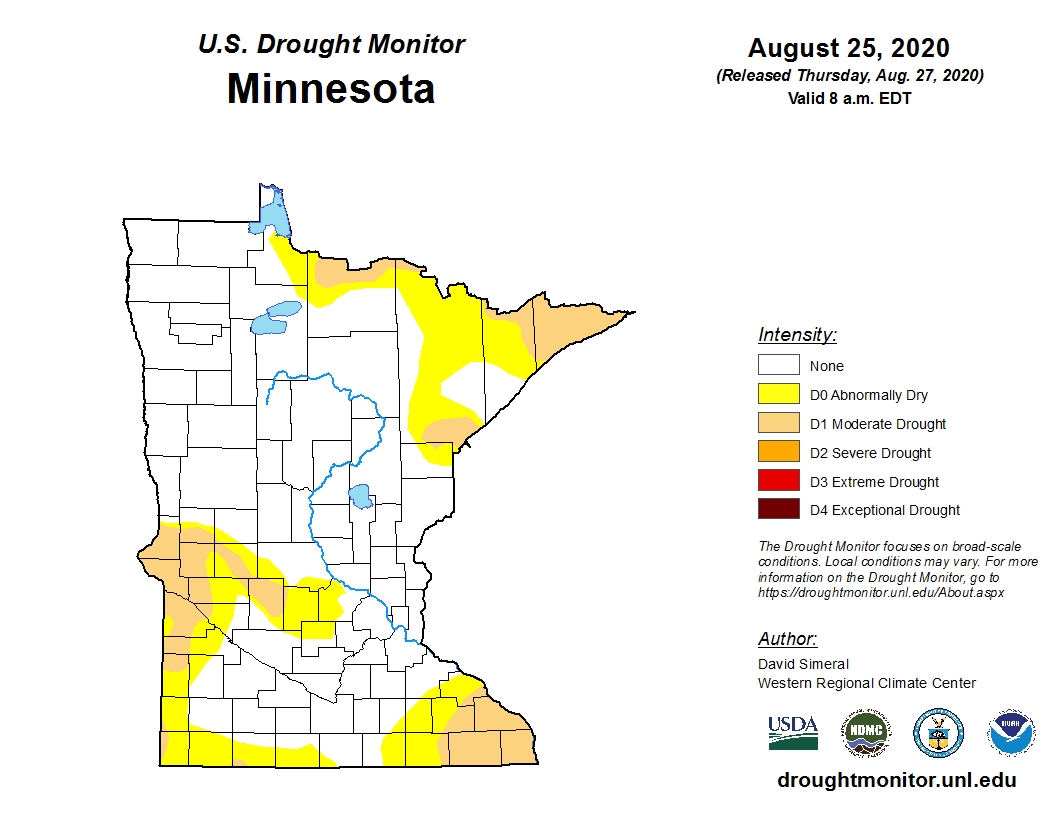
US Drought Monitor, released August 27th, showing a large portion of Abnormally Dry or Moderate Drought across the area.
After a period of abnormally dry/drought conditions, the James River at Columbia finally fell below flood stage on August 30th (began March 31st, 2019).
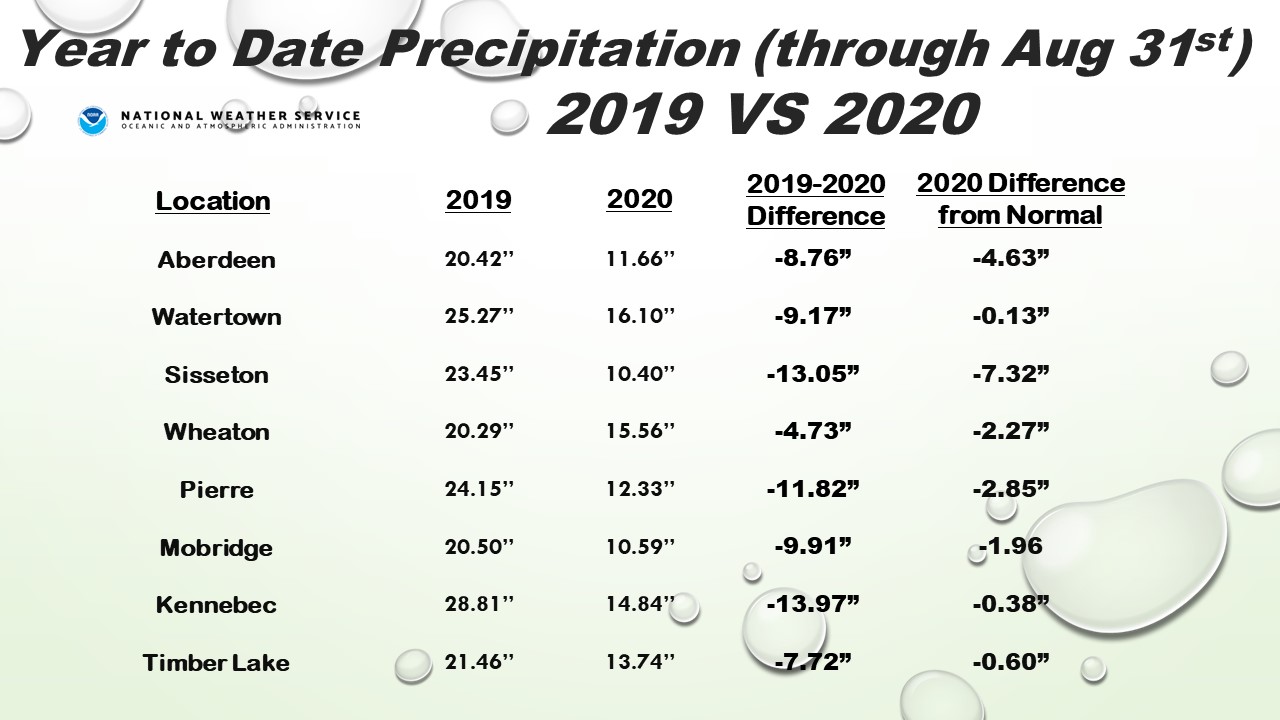
A comparison of precipitation totals through Aug 31st between 2019 and 2020, etc.