Upper Mississippi River Weather Summary for August 2025:
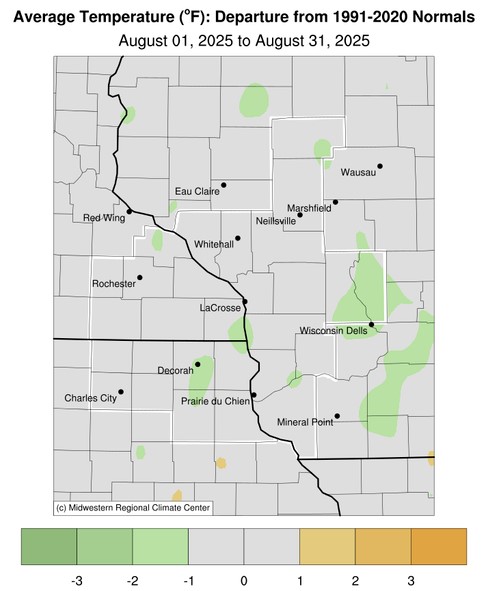
Temperatures - Near to Colder than Normal
- During August 2025, average temperatures across the Upper Mississippi River Valley ranged from 64.3°F at Medford Taylor County Airport, WI (AWOS) to 71.4°F at Decorah, IA (COOP).
- Temperature anomalies ranged from near-normal to 2°F colder than normal.
- The hottest temperature was 98°F at Guttenberg Lock & Dam 10, IA (ASOS) on August 17 and the Black River Falls, WI (RAWS) on July 28. Meanwhile, the coldest temperature was 38°F at Sparta/Fort McCoy, WI (AWOS) on August 26.
|
 |
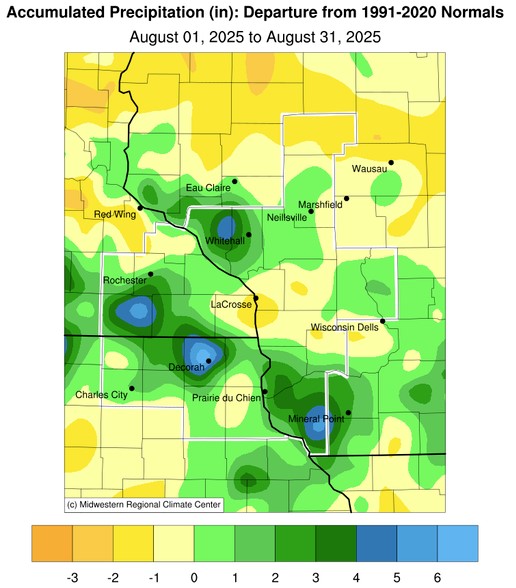
Precipitation - Highly Variable
- Rainfall across the Upper Mississippi ranged from 1.85" near Hillsboro, WI (CoCoRaHS) to 13.61" near Decorah, IA (COOP).
- Decorah, IA (AWOS) received their second largest August rainfall. Only 2007 was wetter with 15.11".
- Rainfall anomalies ranged 2" drier than normal to 7" wetter than normal.
- The highest 24-hour rainfall occurred near Decorah, IA when 8.64" of rain fell from August 17-18. This was their wettest calendar and August day. The previous record for both was 8.06" on August 24, 2016.
|
 |
Below are the August 2025 climate summaries for La Crosse, WI, and Rochester, MN.
La Crosse, WI
August 2025 was Colder and Drier than Normal at La Crosse, WI
...July 2025 Highlights...
Temperatures - Colder than Normal
- The average temperature at La Crosse Regional Airport was 71°F.
- This was 1.8°F colder than the 1991-2020 normal of 72.8°F. Despite being colder than normal, 14 days were within 2°F of normal.
- The average high temperature was 80.7°F. This was 2.5°F colder than the 1991-2020 normal of 83.2°F.
- The average low temperature was 61.4°F. This was 0.9°F cooler than the 1991-2020 normal of 62.3°F.
- The warmest high temperature was 92°F on August 8.
- The coldest high temperature was 72°F on August 24-25, and August 29.
- The warmest low temperature was 72°F on August 8.
- The coldest low temperature was 48°F on August 26.
- There were 3 days in which the temperature was 90°F or warmer. The 1873-2025 average is 3.7 days.
|
Rainfall - Below Normal
- A total of 2.83" of rain fell at La Crosse Regional Airport.
- This was 1.07" drier than the 1991-2020 normal of 3.90".
- 88.3% of this rain fell in just 3 days (August 9 - 0.63"; August 15 - 0.58"; and August 18 - 1.29").
- The wettest day occurred on August 18 when 1.29" of rain fell.
- Rain fell on 10 days (8 with measurable rain and 2 days with a trace).
Mississippi River - 8th Highest 7 AM Average Stage for August
- During August 2025, the average 7 AM stage for the Mississippi River at La Crosse was 7.20 feet.
- This was 1.84 feet higher than the 1937-2025 long-term average of 5.36 feet.
- This was the 8th highest average for August.
- The highest 7 AM August average was 8.39 feet in 1993.
- The highest daily 7 AM stage for this past month was 8.08 feet on August 22. Meanwhile, the lowest 7 am daily stage for this past month was 6.41 feet on August 17.
- The daily 7 AM stage was above the long-term average on all 31 days.
...August 2025 Records...
Daily Records...
...Looking ahead to September...
- The normal high temperature in La Crosse starts off at 81°F on September 1st and falls to 69°F by the end of the month. The normal low temperature starts off at 59°F on the 1st and falls to 48°F by the end of the month. The warmest September temperature on record was 101°F on September 6, 1922, and the coldest was 24°F on September 30, 1899.
- The normal mean temperature for September is 64.8°F. La Crosse’s hottest September occurred in 2015 with an average temperature of 69.3°F, and its coldest September occurred in 1918 with an average temperature of 54.8°F.
- The normal September rainfall is 3.63". The wettest September occurred in 1881 with 10.87" of rain, while the driest September occurred in 1940, with only 0.29" of precipitation. The wettest September day occurred on September 6, 1884, when 5.55" of rain fell. Normally, there are 4 days with thunderstorms.
- While typically no snow falls during September, measurable snow did fall in 1942 (0.2" on September 26).
- Valley fog is quite prevalent in the area. On average, this fog reduces the visibility to a quarter-mile or less at the airport on 3 days.
Rochester, MN
August 2025 was Warmer and Wetter than Normal at Rochester MN
...August 2025 Highlights...
Temperatures - Warmer than Normal
- The average temperature at Rochester International Airport was 68.3°F. This was 0.1°F warmer than the 1991-2020 normal of 68.2°F.
- The average high temperature was 77.5°F. This was 0.5°F colder than the 1991-2020 normal of 78°F.
- The average low temperature was 59.0°F. This was 0.7°F warmer than the 1991-2020 normal of 58.3°F.
- The warmest high temperature was 86°F on August 8.
- The coldest high temperature was 67°F on August 24.
- The warmest low temperature was 68°F on August 8.
- The coldest low temperature was 48°F on August 25.
- There were no days in which the temperature was 90°F or warmer. The 1886-2025 average is 2.7 days.
|
Precipitation - 7th Wettest
- A total of 6.81" of rain fell at Rochester International Airport.
- This was 2.69" wetter than the 1991-2020 normal of 4.12".
- This was the 7th wettest August and the wettest since 2007.
- 6 out of the 20 wettest Augusts have 2006.
- The table below has the 10 wettest Augusts.
Wettest Augusts
in Rochester MN
1886-2025
Rank Rainfall Year
---- -------- ----
1 14.07 inches 2007
2 9.52 inches 1979
3 7.86 inches 1980
4 7.18 inches 1942
5 6.95 inches 1959
6 6.88 inches 1993
7 6.81 inches 2025
8 6.74 inches 2021
9 6.59 inches 1947
10 6.53 inches 2022
...August 2025 Records...
Daily Records...
- August 9 - Rainfall - 3.06" - Previous Record - 1.36" in 1948
- August 17 - Rainfall - 1.17" - Previous Record - 0.87" in 1940
...Looking Ahead to September…
- The normal high temperature in Rochester starts off at 76°F on September 1st and falls to 66°F by the end of the month. The normal low temperature starts off at 56°F on the 1st and falls to 45°F by the end of the month. The warmest September temperature on record is 100°F on September 6, 1913, and the coldest was 22°F on September 28, 1942.
- The normal mean temperature for September is 61.1°F. Rochester’s hottest September occurred in 1908 with an average temperature of 69.5°F, and its coldest September occurred in 1993 with an average temperature of 53.6°F.
- The normal September rainfall is 3.60". The wettest September was in 1986 with 10.50" of rain, while the driest September occurred in 1953, with only 0.33" of precipitation. The wettest September day occurred on September 12, 1978, when 5.98" of rain fell. Normally, there are 5 days with thunderstorms.
- While typically no snow falls during September, measurable snow did fall in 1942 (0.3" on September 26) and 1961 (0.8" on September 30).


 Weather Story
 Weather Map
 Local Radar