2024-25 Drought EndsUpdated on Thursday, July 17, 2025 |
 |
||||||||||
| Summary: | |||||||||||
|
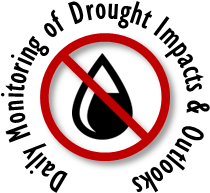
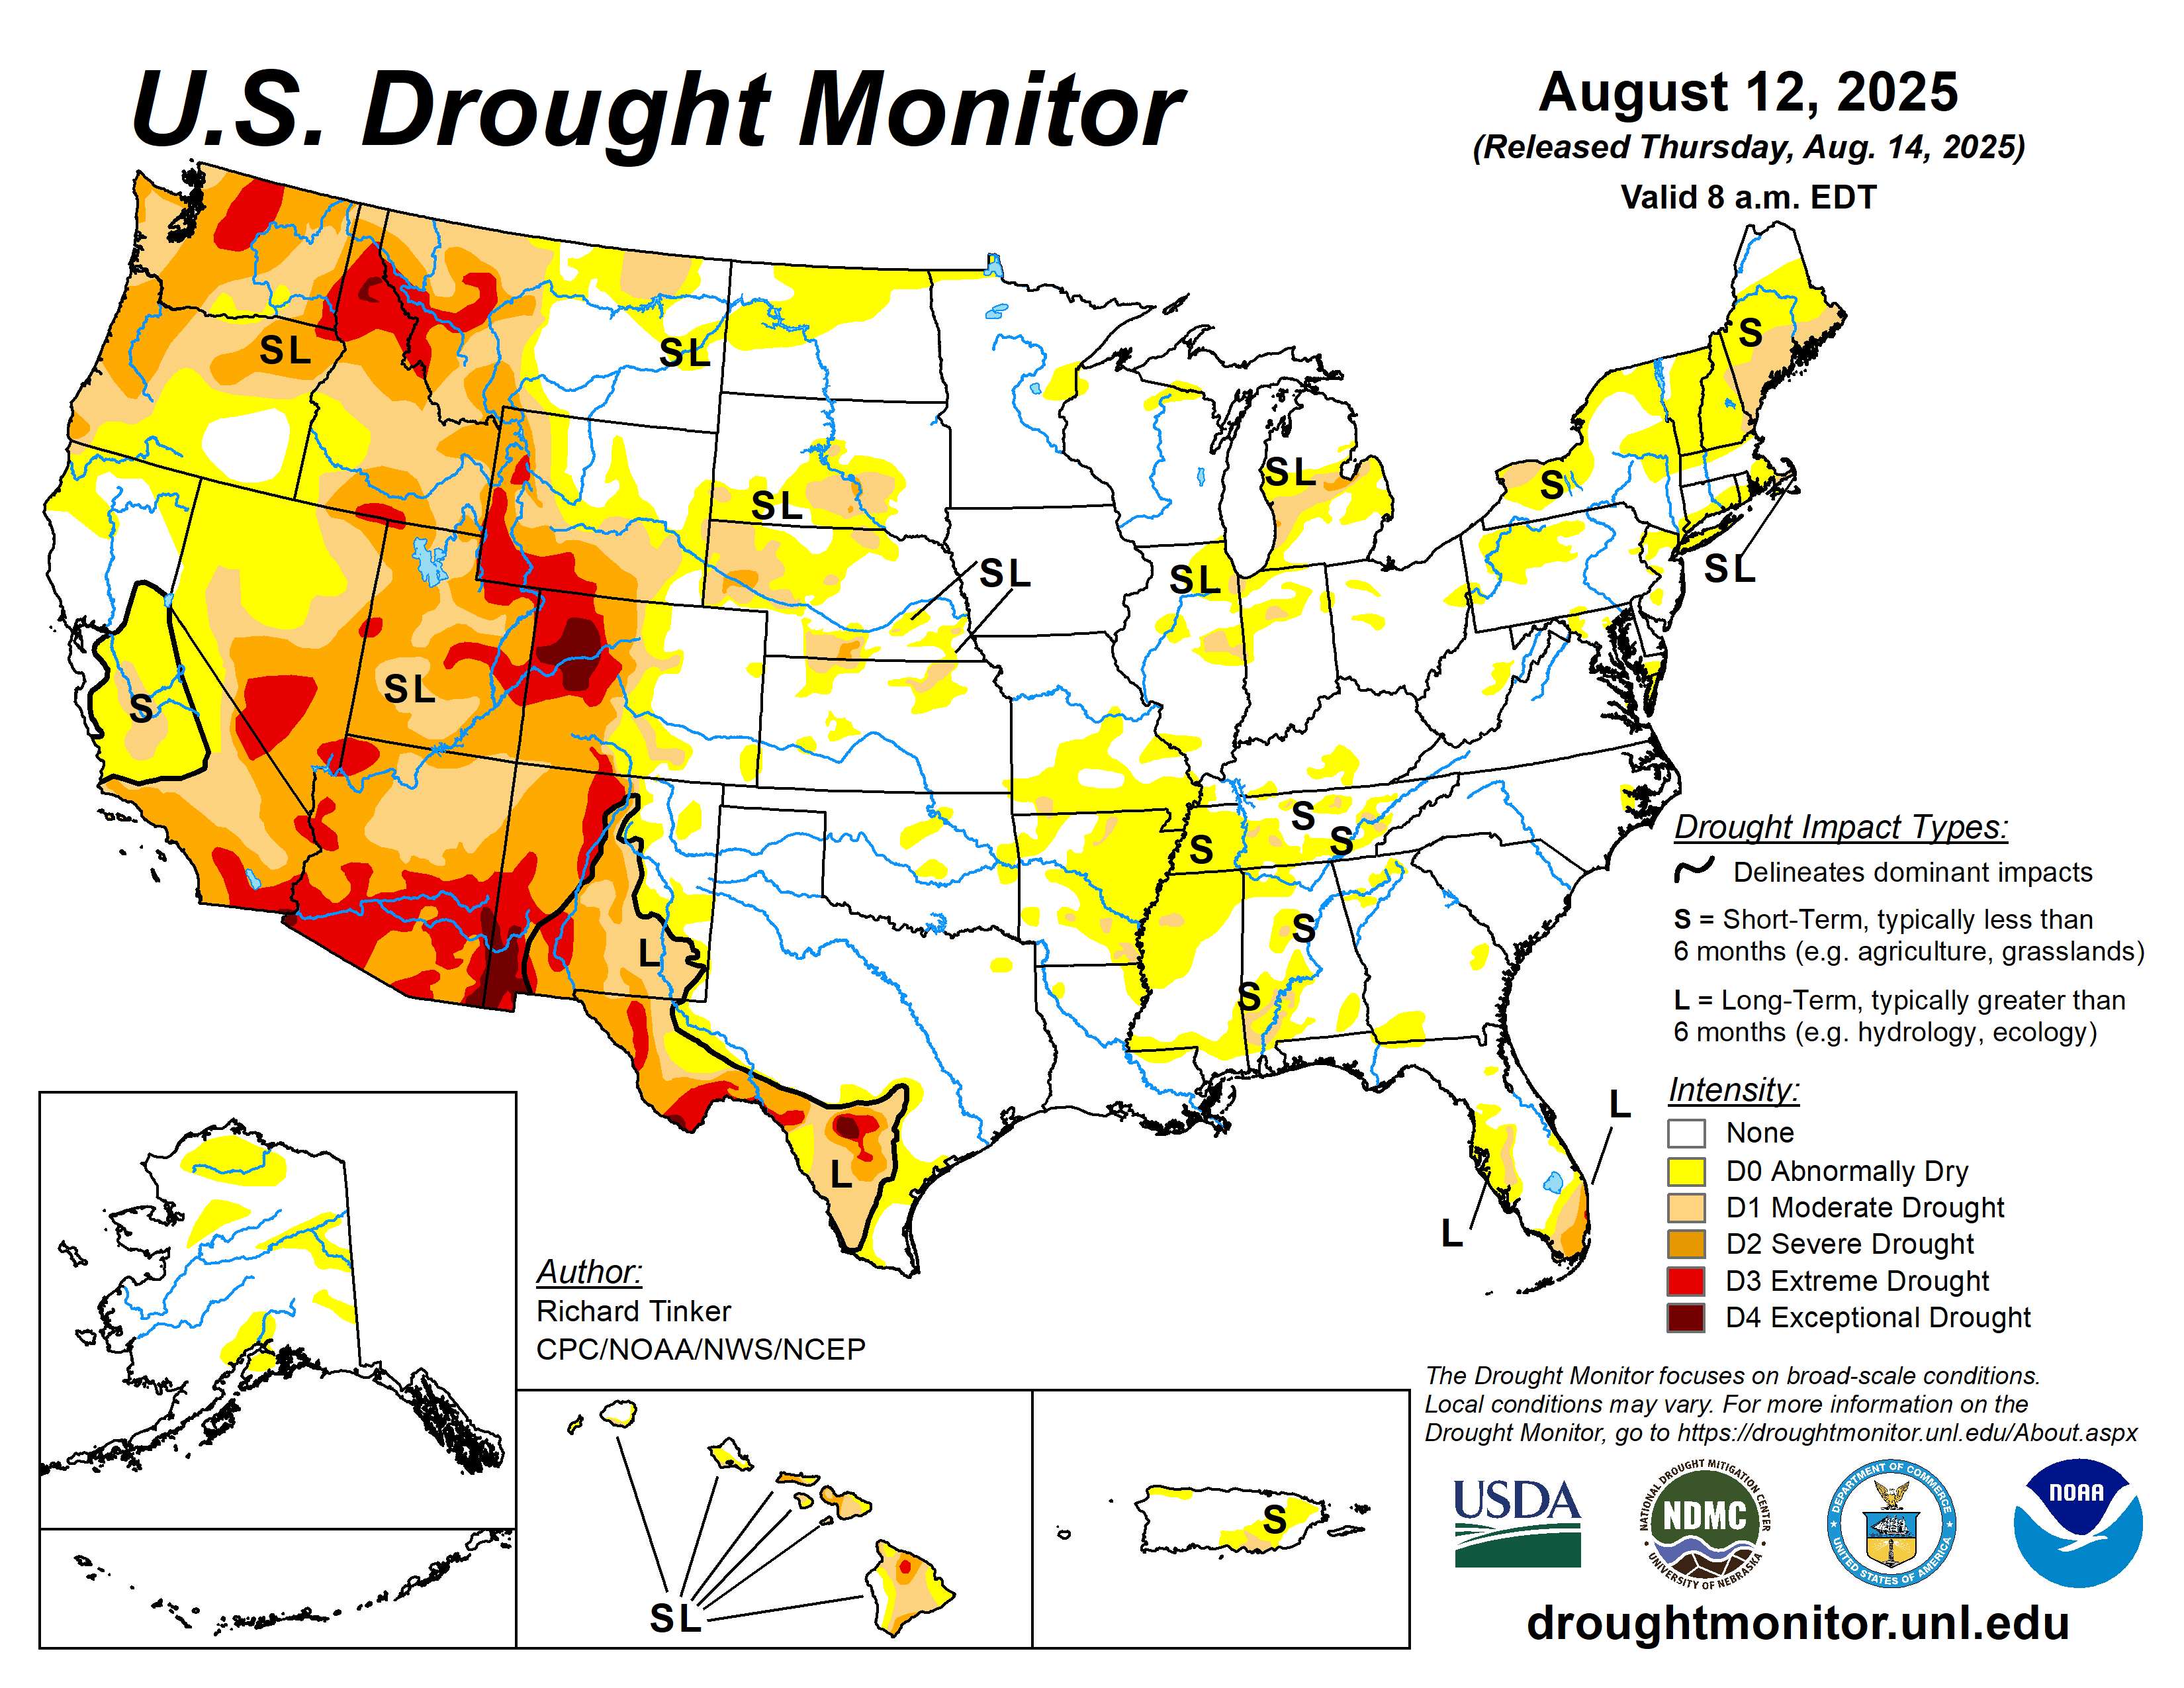
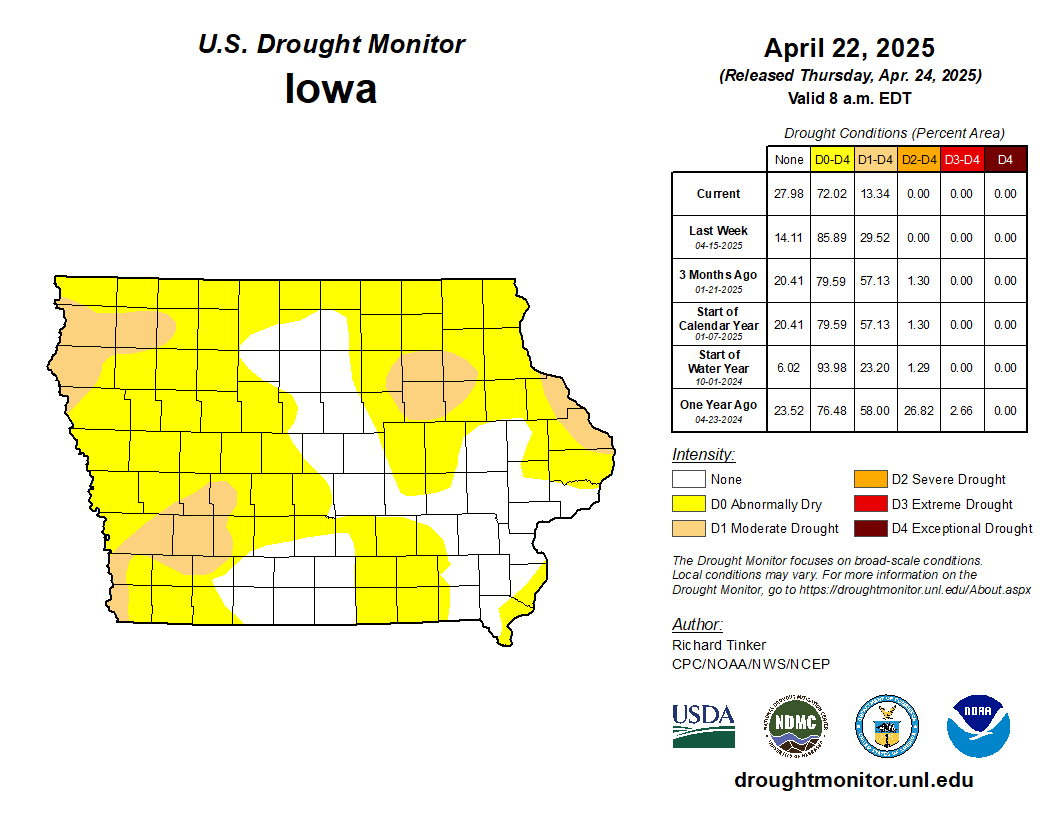
Recent rain has alleviated the abnormally dry (D0) conditions across Allamakee, Clayton, Fayette, and Winneshiek counties in northeast Iowa; and Crawford, Grant, and Richland counties in southwest Wisconsin. There currently is no abnormally dry (D0) conditions or drought in the La Crosse Hydrologic Service Area (HSA). The last time that occurred was in mid-July 2024 (July 23). The drought maxed out with 40% of the area in severe drought (D2) in late October 2024 (October 29). Note: The impacts of any precipitation that fell after 7 AM Tuesday, July 15 will be evaluated next week. U.S. Drought Monitor Summary: In the July 15 release of the U.S. Drought Monitor, it ranged from no drought to severe (D2) drought in northern Illinois and northern Minnesota, from no drought to moderate (D1) drought in western and southern Iowa, and from no drought to abnormally (D0) dry in northwest Wisconsin and southwest Minnesota. Note: The data cutoff for Drought Monitor maps is Tuesday at 7 a.m. Central Daylight Time.
There currently is no abnormally dry (D0) conditions or drought in the La Crosse Hydrologic Service Area (HSA).
No known actions are taking place in northeast Iowa, southeast Minnesota, and western Wisconsin. Climatological Summary:
|
The U.S. Drought Monitor is a weekly collaborative effort between several federal agencies including NOAA/NWS, U.S. Department of Agriculture, and the National Drought Mitigation Center. Details and explanations of the Drought Monitor can be found at: The categories of drought are defined as follows: Moderate Drought (D1) - Some damage to crops and pastures; fire risk high; streams, reservoirs, or wells low, some water shortages developing or imminent, voluntary water use restrictions requested. Severe Drought (D2) - Crop or pasture losses likely; fire risk very high; water shortages common; water restrictions imposed. Extreme Drought (D3) - Major crop/pasture losses; extreme fire danger; widespread water shortages or restrictions. Exceptional Drought (D4) - Exceptional and widespread crop/pasture losses; exceptional fire risk; shortages of water in reservoirs, streams, and wells, creating water emergencies. Disaster & Drought Assistance:
Other Drought Web Sites:
Drought Plans:
|
||||||||||
|
As of the morning of July 15, rivers and stream flows were near to much above normal in northeast Iowa, southeast Minnesota, and from southwest into central Wisconsin. NOTE: This is time-sensitive and conditions could change. Updated river and streamflow conditions can be found via links to the right. |
Hourly and forecast river stages out to 90 days can be found at: Additional Current stream and river stages may be viewed at: An interactive table of sites that are at or near record flows can be found at: |
|
|
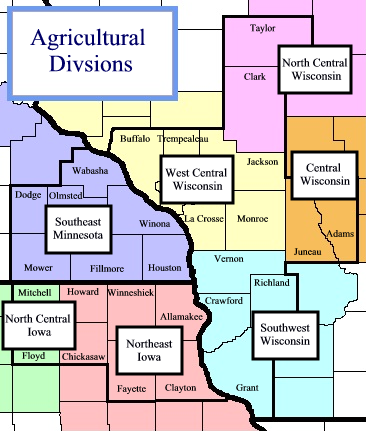
Here are the latest Agricultural Statistics Service reports for Iowa and Wisconsin issued on June 16, 2025. Iowa Rain on and off throughout the week limited farmers to 3.8 days suitable for fieldwork during the week ending July 13. Wet conditions made field activities difficult.
Corn silking reached 36 percent, 1 day behind last year, but 1 day ahead of normal. Five percent of Iowa’s corn reached the dough stage. Corn condition rated 1 percent very poor, 2 percent poor, 12 percent fair, 58 percent good and 27 percent excellent. Soybeans blooming reached 54 percent, 3 days ahead of last year but equal to the five-year average. Eighteen percent of soybeans were setting pods, 4 days ahead of last year and 3 days ahead of the five-year average. Soybean condition rated 1 percent very poor, 2 percent poor, 18 percent fair, 59 percent good and 20 percent excellent. Ninety-six percent of Iowa’s oat crop was headed and 71 percent of oats were turning color. Oats harvested for grain reached 19 percent complete. Oat condition rated 0 percent very poor, 1 percent poor, 13 percent fair, 71 percent good and 15 percent excellent. The State’s second cutting of alfalfa hay reached 66 percent complete while 7 percent of the third cutting was completed. Hay condition rated 83 percent good to excellent. Pasture condition rated 75 percent good to excellent. Wisconsin Wisconsin had 4.6 days suitable for fieldwork statewide for the week ending July 13, 2025. Rainfall in portions of the state slowed cutting of hay and forage.
Corn silking reached 13 percent, 1 day behind last year, but 1 day ahead of the 5-year average. Corn condition was rated 78 percent good to excellent, 1 percentage point higher than last week. Soybeans were 44 percent blooming, 7 days ahead of last year but even with the average. Five percent of soybeans were setting pods. Soybean condition was 74 percent good to excellent, 1 percentage point below last week. Winter wheat was 92 percent coloring. Condition was rated 72 percent good to excellent, up 1 percentage point from last week. Oats were 88 percent headed. Fifty-three percent of oats were coloring, 1 day ahead of both last year the average. Oat condition was rated 81 percent good to excellent, even with last week. Harvest of winter wheat and oats for grain had started in limited areas. Potato harvest had begun in some areas and condition was rated 89 percent good to excellent. The second cutting of alfalfa hay was 68 percent complete, 3 days ahead of last year, but 1 day behind the average. The third cutting was underway in some areas. Hay condition was rated 80 percent good to excellent, up 4 percentage points from last week. Pasture and range condition was rated 70 percent good to excellent, up 1 percentage point from last week.
|
Soil moisture supply measures how much moisture is present in cropland topsoil during the week. Soil moisture is reported as a percentage. The categories very short, short, adequate, and surplus must add up to 100%.
Additional information on agriculture impacts may be viewed from the: |
|||||||||||||||||||||||||||||||||||||||||||||||||||||||||||||||||||||||||||||||||||||||
|
As of the morning of July 15, fire danger was low (fires are not easily started) across northeast Iowa, southeast Minnesota, and from southwest and central Wisconsin. NOTE: This is time-sensitive and conditions could change from day to day. Fire conditions can change drastically on drier, windy days. Updated DNR fire conditions can be found via links to the right. Citizens should always check with local officials in their area before undertaking any outside burning. Citizens are liable for damages and suppression costs of any wildfire they may start. |
Description of Fire Danger Ratings For updated DNR Fire Conditions consult the following Web Sites: The Keetch-Byram Drought Index (KBDI) is a drought index that is specifically related to fire potential. The KDBI is broken into four categories which indicate the susceptibility of ground fuels to fire danger. Below are the four categories and a brief description of each.
KBDI and Dead Fuel Moisture data can be found through the: Burn Bans: |
|||||||||||||
|
From July 17 through July 22, near-normal temperatures and above-normal precipitation are expected. During this time frame, daily average temperatures range from 70 to 75°F and precipitation averages around 0.8". From July 23 through July 29 (8-14 day outlook), the Climate Prediction Center (CPC) has a shift in the probabilities toward above-normal temperatures (40-50%) and rainfall (33-40%). The normal daily average temperatures for this period range from 70 to 75°F and the normal precipitation is around 0.90". For August, the Climate Prediction Center has the odds tilted slightly toward warmer than normal (33-40%). Meanwhile, there are equal chances for drier-, near-, and wetter-than-normal rainfall. The 1991-2020 normal daily average temperatures are 70 to 75°F in the Mississippi and Wisconsin river valleys and 65 to 70°F elsewhere. The 1991-2020 normal rainfall ranges from 3.8 to 4.6". From August 1 through October 31, CPC has the odds tilted toward warmer-than-normal temperatures (40-50%) and below-normal precipitation 33-40%) in the Upper Mississippi River Valley. Seasonal temperatures range from 60 to 65°F in the Mississippi and Wisconsin river valleys and 55 to 60°F elsewhere and precipitation ranges from 10 to 11". Below are the seasonal outlooks for the next year.
|
For updated temperature and precipitation probabilities consult the following Climate Prediction Center (CPC) Web Sites:
NCEP's CFSv2 (Coupled Forecast System Model Version 2): |
|||||
|
If you have any questions or comments about this drought information please contact the NWS La Crosse at: E-mail: nws.lacrosse@noaa.gov |
Other Contacts: State climate impacts: |
|


.jpg)
 Weather Story
 Weather Map
 Local Radar