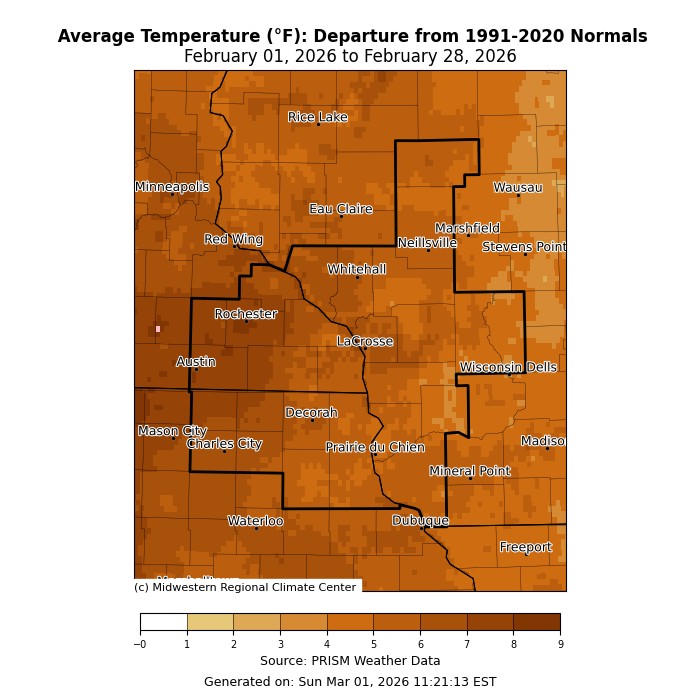
Upper Mississippi River Climate Summary for Febuary 2026:
Temperatures - Much Warmer than Normal
- During February 2026, average temperatures ranged from 20.4°F near Owen, WI (COOP) to 31.4°F at Boscobel, WI (ASOS).
- Temperature anomalies ranged from 2°F to 9°F warmer-than-normal.
- There was an 78°F difference between the warmest and coldest temperatures in the Upper Mississippi River Valley.
- The warmest temperature was 66°F near Prairie du Chien, WI (COOP) on February 17. Meanwhile, the coldest temperature was -12°F at Black River Falls, WI (RAWS) on February 4.
|
 |
Precipitation - Mainly Drier than Normal
- Precipitation totals varied from 0.10" near Austin, MN (CoCoRaHS) to 1.36" near Warrens, WI (CoCoRaHS).
- Precipitation anomalies ranged from near normal to 1" drier than normal.
- The highest one-day precipitation was 1.15" near Waukon, IA from February 19 to February 20.
|
 |
| Snowfall - Mainly Below Normal |
- Snowfall totals varied from 0.4" at St. Ansgar, IA (COOP) to 15.1" near New Hampton, IA (CoCoRaHS).
- Snowfall anomalies ranged from 12" below normal to 4" above normal.
- The highest one-day snowfall was 13.5" near New Hampton (CoCoRaHS) from February 19 to February 20.
|
 |
Below are the February 2026 climate summaries for La Crosse, WI, and Rochester, MN.
La Crosse, WI
February 2026 was Warmer and Drier than Normal for La Crosse, WI
...February 2026 Highlights...
Temperatures - Warmer than Normal
- During February 2026, La Crosse Regional Airport had an average temperature of 27.3°F. This was 4°F warmer than the 1991-2020 normal of 23.3°F.
- The average high temperature was 36.6°F. This was 4.1°F warmer than the 1991-2020 normal of 32.5°F. This was the 20th warmest.
- The average low temperature was 18°F. This was 3.8°F warmer than the 1991-2020 normal of 14.2°F.
- The warmest temperature was 58°F on February 16 and the coldest temperature -2°F on February 4.
|
Precipitation - Drier than Normal
- 0.56" of precipitation fell.
- This was 0.63" drier than the 1991-2020 normal of 1.19".
- Measurable precipitation fell on 5 days and trace amounts fell on 5 days.
- The wettest day was February 20 when 0.46" of precipitation fell.
Snowfall - Below Normal
- 7.9" of snow fell.
- This was 1.8" below the 1991-2020 normal of 9.7".
- Measurable snow fell on 2 days and trace amounts fell on 7 days.
- The snowiest day was February 20 when 6 inches of snow fell.
Snow Depth - Below Average
- The average snow depth was 2.3".
- This was 2.7" below the long-term average of 5".
- The greatest snow depth was 6" from February 20 to February 23.
Mississippi River at La Crosse - Near Average
- The February 2026 average 7 am stage was 5.14 feet.
- This was 0.02 feet lower than the 1937-2026 average of 5.16 feet.
- The lowest 7 am stage was 4.91 feet on February 17.
- The highest 7 am stage was 5.82 feet on February 23.
...Records...
...Looking ahead to March...
- The normal high temperature in La Crosse warms from 38°F on March 1st to 53°F by the end of the month. The normal low temperature warms from 20°F on the 1st and to 32°F by the end of the month. The warmest March temperature on record is 84°F on March 29, 1986; and the coldest is -28°F on March 1, 1962.
- The normal mean temperature for March is 35.8°F. La Crosse’s warmest March occurred in 2012 with an average temperature of 50.4°F, and their coldest March occurred in 1899 with an average temperature of 21.3°F.
- The normal March precipitation is 2.04". The wettest March occurred in 1876 with 4.23" of precipitation and the driest occurred in 1910 with just 0.03". The wettest March day occurred on March 27, 1880, when 2.01" of precipitation fell. Normally, there is 1 day with thunderstorms.
- The normal March snowfall is 7.3" (4th snowiest month). The snowiest March occurred in 1959 with 33.5" of snow and the least snow was no snow in 2010. The snowiest March day occurred on March 13, 1997, when 14.3" of snow fell.
Rochester, MN
February 2026 was Much Warmer and Drier than Normal for Rochester MN
...February 2026 Highlights...
Temperatures - 10th Warmest
- During February 2026, Rochester International Airport had an average temperature of 26.9°F.
- This was 8.2°F warmer than the 1991-2020 normal of 18.7°F.
- This was the 10th warmest February.
- In the table below are the 20 warmest Februarys for Rochester, MN.
20 Warmest Februarys
for Rochester MN
1886-2026
Rank Avg. Temp Year
---- --------- ----
1 32.6 degrees 2024
2 32.0 degrees 1931
3 31.8 degrees 1954
4 29.4 degrees 1998
5 29.3 degrees 1987
6 28.7 degrees 1930
7 28.2 degrees 1976
8 27.7 degrees 2012
9 27.6 degrees 2017
10 26.9 degrees 2026
11 26.7 degrees 1992
12 26.6 degrees 1999
13 26.3 degrees 2000
14 25.9 degrees 2002
15 25.6 degrees 1961
16 25.4 degrees 1984
17 24.9 degrees 1915
18 24.6 degrees 2005
19 24.5 degrees 1964
20 24.1 degrees 1952
- The average high temperature was 35.2°F. This was 8.5°F warmer than the 1991-2020 normal of 26.7°F. This was the 11th warmest for February.
- The average low temperature was 18.5°F. This was 7.8°F warmer than the 1991-2020 normal of 10.7°F. This was the 14th warmest for February.
- The warmest temperature was 55°F on February 16 and the coldest temperature 2°F on February 3.
Precipitation - Drier than Normal
- 0.51" of precipitation fell.
- This was 0.51" drier than the 1991-2020 normal of 1.02".
- Measurable precipitation fell on 4 days and trace amounts fell on 4 days.
- The wettest day was February 18 when 0.29" of precipitation fell.
Snowfall - Below Normal
- 6.1" of snow fell.
- This was 4.6" below the 1991-2020 normal of 10.7".
- Measurable precipitation fell on 3 days and trace amounts fell on 3 days.
- The snowiest day was February 28 when 4.9" of snow fell.
Snow Depth - Below Average
- The average snow depth was 0.5".
- This was 5.3" below the long-term average of 5.8".
- The greatest snow depth was 2" on February 2 to February 5.
...Records...
Daily...
- February 13 - High Temperature of 48°F - Previous record was 47°F in 1919
- February 15 - High Temperature of 53°F - Previous record was 49°F in 1931
- February 16 - Warm Low of 36°F - Previous record was 35°F in 1981
- February 17 - Warm Low of 36°F - Previous record was 35°F in 1981
...Looking ahead to March...
- The normal high temperature in Rochester warms from 32°F on March 1st to 48°F by the end of the month. The normal low temperature warms from 17°F on the 1st to 30°F by the end of the month. The warmest March temperature on record is 82°F on March 24, 1910; and the coldest is -31°F on March 1, 1962.
- The normal mean temperature for March is 31.7°F. Rochester’s warmest March occurred in 2012 with an average temperature of 49.1°F, and its coldest March occurred in 1888 with an average temperature of 17.4°F.
- The normal March precipitation is 2.02". The wettest March occurred in 1888 with 4.02" of precipitation and the driest occurred in 1910 with just a trace of precipitation. The wettest March day occurred on March 22, 2011, when 2.20" of precipitation fell. Normally, there is 1 day with thunderstorms.
- The normal March snowfall is 8.6" (4th snowiest month). The snowiest March occurred in 1951 with 35.1" of snow and the least snow was no snow in 2010. The snowiest March day occurred on March 18, 2005, when 19.8" of snow fell.


 Weather Story
 Weather Map
 Local Radar