
Freezing rain continues during the early morning for north central Wisconsin. Impacts to elevated surfaces possible... Read More >
| Temperatures | Precipitation | ||||||
| Month | High | Low | Average | Departure | Total | Departure | Snow |
| January | 25.4 | 9.5 | 17.4 | +1.5 | 1.40 | +0.21 | 14.3 |
| February | 35.8 | 21.2 | 28.5 | +5.9 | 1.28 | +0.29 | 5.6 |
| March | 42.8 | 22.2 | 32.5 | -2.1 | 1.90 | -0.10 | 19.7 |
| April | 64.0 | 41.0 | 52.5 | +4.1 | 2.00 | -1.38 | T |
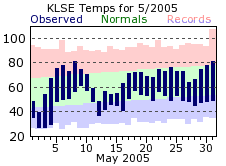
| May | 67.0 | 47.1 | 57.1 | -3.5 | 2.40 | -0.98 | T |
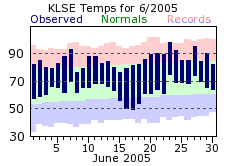
| June | 85.0 | 63.5 | 74.3 | +4.7 | 2.42 | -1.58 | ... |
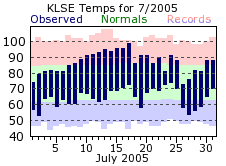
| July | 86.6 | 64.5 | 75.5 | +1.5 | 4.86 | +0.61 | ... |
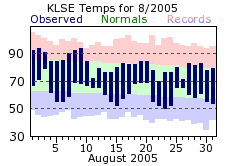
| August | 82.0 | 61.3 | 71.7 | +0.1 | 3.95 | -0.33 | ... |
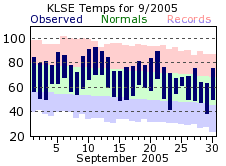
| September | 78.2 | 56.0 | 67.1 | +4.4 | 6.92 | +3.52 | ... |
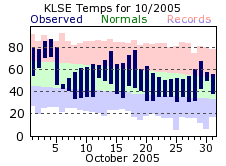
| October | 64.0 | 42.6 | 53.3 | +2.7 | 0.39 | -1.77 | ... |
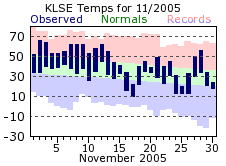
| November | 46.8 | 29.2 | 38.0 | +2.5 | 2.23 | +0.13 | 6.1 |
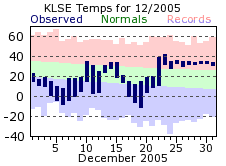
| December | 25.8 | 13.7 | 19.7 | -2.1 | 0.56 | -0.67 | 12.9 |
| TOTALS: | 58.6 | 39.3 | 49.0 | +1.5 | 30.31 | -2.05 | *** |
Records
Temperature...
Highs:
Lows:
Highest Lows:
Lowest Highs:
Monthly:
Seasonal:
Yearly:
Precipitation...
One-day pcpn:
One-day snowfall:
Monthly pcpn:
Monthly snowfall:
Seasonal precipitation:
Yearly precipitation:
|
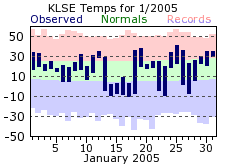
January 2005 got off to a wet start, with some mixed precipitation falling on the 1st. Temperatures were just warm enough that the bulk fell as rain. By the 5th and 6th, temperatures had cooled enough that the next system to pass through the region brought snow, instead of rain. Conditions would stay relatively dry after that, with some flurries or very light precipitation until the 21st. A storm system would then track across the Upper Mississippi River Valley on the 21st and 22nd, dropping 8.3 inches of snow on La Crosse over those 2 days. Drier conditions would return for the rest of the month. Temperatures were on the mild side for most of January, with one stretch of cold weather at mid month. From the 14th through the 17th, highs were only in the single digits, with lows below zero each day.
|
 |
|
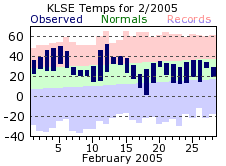
February was a mild month, and actually the mildest on average for all of 2005. Low temperatures never fell below zero, which usually occurs at least 6 times in a typical February, and only dropped into the single digits twice. Meanwhile, highs cracked 40 degrees 7 times, even reaching a high of 52 on the 12th. Snowfall was generally light when it fell, with the most in any one day coming on the 20th, with 2.7 inches that day.
|
 |
| March of 2005 will be remembered for one event, the major snow storm of the 18th and 19th. A low pressure system tracked across central Iowa and northern Illinois, bringing bands of heavy snow to the region. The highest totals were found across southeast Minnesota into western Wisconsin, with La Crosse receiving 14.7 inches over those 2 days. The majority fell on the 18th, with 13.9 inches, which set a record for that day, and also made it the 4th snowiest day on record for La Crosse. If it wasn’t for this significant storm, March would have been a dry month. Measurable precipitation only fell on 6 other days, with the 20th through the 29th not even receiving a trace. However, the first rumbles of thunder for the new year were heard on the 30th, which also brought some severe weather southwest of La Crosse, over parts of northeast Iowa. Temperatures were varied throughout the month, with highs reaching 63 on the 6th, and then as warm as 74 on the 29th. Overall though, it was a cool March by its standards. | 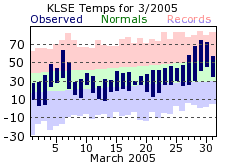 |
|
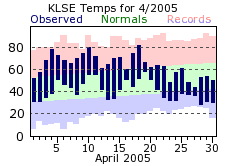
Much of April was mild, with above normal temperatures for the first two-thirds of the month. Highs reached or exceeded 70 on 10 occasions, with 80 degree or better days on the 10th and 18th. In a normal year, the first 80 degree day comes around May 1st. The latter part of the month was much cooler though, with highs in the 40s and 50s, and lows falling below freezing on a few days. It was dry month, with over 50% of the month’s total falling on the 19th (1.13 inches). Aside from a few flurries, there was no measurable snowfall for the month.
|
 |
|
May started out quite cool, with high temperatures failing to even crack the 40 degree mark on the 2nd. Highs did top 80 on the 8th and 31st, but 20 out of the 31 days recorded below normal temperatures. Most of the precipitation for May was confined to the middle part of the month, with 1.71 inches out of the 2.40 inch monthly total falling on the 12th and 18th. This was in stark contrast to 2004, where nearly 10 inches of precipitation fell that May.
|
 |
|
June brought a return to warmer, and relatively consistent temperatures. There were no huge swings in the daily highs or lows, with highs most days in the mid 80s and lows in the mid 60s. Despite not having a significant warmup throughout the month, the steady above normal conditions would help June average almost 5 degrees above normal, and make it the 2nd warmest June on record (tying with 1991). It was a dry month, finishing over 1 ½ inches below normal. There were 3 days with ½ inch or more of rainfall, but also a stretch of 9 days (the 15th through 23rd) where no measurable precipitation was recorded.
|
 |
|
July continued the warm trend, although saw a bit more variance in its day to day temperatures, as opposed to the consistency of June. There was a stretch of 8 days, from the 10th through the 17th, where highs exceeded 90 degrees. The 17th also brought the warmest day of the year to La Crosse, with highs topping out at 99 that day. However, maximum temperatures in the 70s were also recorded 4 times. Precipitation was above the monthly normal, but is misleading as 82% of this total came on 2 days (2.45 inches on the 21st and 1.53 inches on the 25th). Aside from those 2 days, measurable rainfall occurred on only 6 days, with 4 of those recording less than one-tenth of an inch.
|
 |
|
August got started on a warm note, recording 90 degree or better days in 6 out of the first 10 days. However, by the second half of the month, temperatures would settle into more seasonable levels. Still, August would help the summer months round out as the 7th warmest on record for La Crosse, at 73.8 degrees (tying with 1936 and 1931). Rainfall was about normal for a typical August, but like July, a bulk of this can be attributed to a few days. There were 4 days with over ½ inch of rainfall, with the 1.96 inches on the 26th accounting for 50% of the monthly total.
|
 |
|
The warm trend would continue in September, with temperatures averaging almost 4 ½ degrees above the normal. The 67.1 degree average temperature would also make it the 10th warmest September on record for La Crosse. In addition, the 90 degree mark was topped 2 more times (on the 10th and 11th), bringing the total for such occurrence to 26 for 2005. In a normal year, 90 degrees is reached or exceeded on 18 days. The 26 days for 2005 is well off the record though, which is 46 set back in 1988. Precipitation was well above normal in September, and also made it the wettest month of the year. The rainfall came in two significant chunks, with daily records being set on the 13th (2.61 inches) and 25th (2.32 inches).
|
 |
|
October jumped out to a very warm start, with 80 degree or greater days on 4 out of the first 5 days. A cold front would bring a drastic change come the 6th though, with a morning high that day of only 47, and temperatures then falling throughout the rest of the day. On the whole, October would finish above normal for the 5th straight month. It was a very dry month, with measurable precipitation falling on only 6 days. The 0.39 inch monthly total made it the 10th driest October on record. Usually the first flurries of the season fall in late October, but nary a flake flew this year.
|
 |
|
November saw more mild conditions, and helped make the traditional fall months of September, October, and November finish as the 8th warmest Fall on record for La Crosse. Despite the overall mild weather, there were a couple cold days, with temperatures barely reaching 20 on both the 17th and 25th. November saw a return to more normal precipitation, and also brought the first measurable snowfall of the season on the 15th. There would be a total of 6.1 inches of snow by month’s end, which is the most snow in a November since 1996. November was also a very windy month, and on average, the windiest month of 2005. There were 4 days when the average wind speed for the day was greater than 19 mph. This was not necessarily a surprise, as November, along with April, are generally the windiest months of the year.
|
 |
|
December was a tale of two halves, with the start of month ushering in significant cold along with snowy conditions. At least a few flurries flew on 17 out of the first 18 days, with the 14th tallying the highest snowfall of the month with 6.1 inches. By the second half of the month, however, these cold and snowy conditions would come to a screeching halt, as a much warmer weather pattern came into play. Low temperatures from the 23rd through the 31st would hover close to freezing, which is about 5 degrees warmer the normal high for this time of year. The highs didn’t warm much over these lows though, with temperatures nearly steady in the lower to mid 30s from the 24th through month’s end. There was only one day during the second half of the month with measurable snow, but a couple days where some light freezing precipitation occurred
|
 |
|
Overall, 2005 will be remembered as a warm year. The 49 degree average tied it for the 8th warmest on record (with 1990). Above normal temperatures were recorded on 9 out of the 12 months, with 4 of those months finishing at least 4 degrees above their normals . Precipitation was a bit below normal, although generally every month stayed within 1 ½ inches of their monthly normal (September and October were the exceptions).
|
 |
| Highest temperature for 2005 | 99 on July 17th |
| Lowest temperature for 2005 | -11 on December 19th |
| Highest one-day precipitation | 2.61" on September 13th |
| Highest one-day snowfall | 13.9" on March 18th |
| Number of days with highs at or above 90 degrees | 26 |
| Number of days with highs at or below 32 degrees | 61 |
| Number of days with zero or below temperatures | 16 |
| Peak wind gust | 59 mph from the west on May 26th |
| Number of days with measurable precipitation | 119 |
| Percentage of days with measurable precipitation | 33% |
| Number of days with above normal temperatures | 205 |
| Percentage of days with above normal temperatures | 56% |


 Weather Story
 Weather Map
 Local Radar