
Freezing rain continues during the early morning for north central Wisconsin. Impacts to elevated surfaces possible... Read More >
| Temperatures | Precipitation | ||||||
| Month | High | Low | Average | Departure | Total | Departure | Snow |
| January | 28.6 | 12.7 | 20.6 | +3.2 | 0.67 | -0.45 | 9.4 |
| February | 21.5 | 1.0 | 11.3 | -11.2 | 0.54 | -0.51 | 9.2 |
| March | 47.5 | 25.0 | 36.2 | +1.7 | 0.81 | -1.23 | 9.9 |
| April | 63.1 | 38.8 | 51.0 | +2.4 | 4.61 | +0.82 | 0.5 |
| May | 72.0 | 52.3 | 62.1 | +2.4 | 6.41 | +2.89 | 0.0 |
| June | 79.9 | 59.9 | 69.9 | +0.7 | 3.70 | -0.64 | ... |
| July | 82.9 | 62.5 | 72.7 | -1.0 | 3.62 | -0.64 | ... |
| August | 81.0 | 61.4 | 71.2 | -0.2 | 2.80 | -1.49 | ... |
| September | 79.3 | 59.3 | 69.3 | +6.5 | 2.73 | -0.83 | ... |
| October | 63.6 | 42.3 | 52.9 | +2.7 | 2.18 | 0.01 | 0.0 |
| November | 51.4 | 34.8 | 43.1 | +7.2 | 1.93 | -0.08 | 0.9 |
| December | 39.4 | 29.1 | 34.2 | +12.6 | 4.93 | +3.57 | 11.6 |
| TOTALS: | 59.2 | 39.9 | 49.5 | +2.1 | 34.48 | +1.42 | *** |
Records
Temperature...
Highs:
Lows:
Highest Lows:
Lowest Highs:
Monthly:
Seasonal:
Yearly:
Precipitation...
One-day pcpn:
One-day snowfall:
Monthly pcpn:
Monthly snowfall:
Seasonal precipitation:
Yearly precipitation:
|
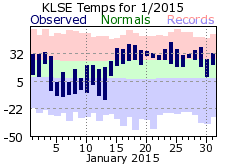
Unlike the previous year, 2015 did not get off to a frigid start. Aside from a 10 day stretch with below normal temperatures (4th through 13th), January was relatively mild. Highs were above freezing 14 days (normal is 10) with lows under 20 degrees 14 times (normal is 24) – tied for 7th least in a January. It was a dry month, receiving only 60% of the January normal. Measurable snow fell on 9 days – right around normal – but only amounted to 9.4 inches. In addition, daily amounts held under 2 inches for the entire month. This occurs less than 2 out of every 10 years. |
 |
|
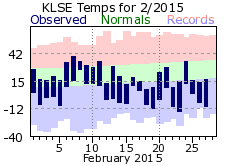
The icebox returned in February with an average temperature over 11 degrees below normal, tying it for the 9th coldest February on record. Lows dropped below zero on 15 days, well above the normal of 6 days and tying it for 5th most in a February. Highs held in the single digits 3 times and only warmed above freezing on 5 days. The 9.2 inch snow total was about what one could expect out of a typical February, but most of the came on the 1st with a 5 inch dumping. There were 7 more days with measurable snowfall after that, all but one recording less than an inch. |
 |
|
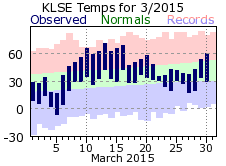
While March would finish above normal for its average temperature, to say March was a warm month would be misleading. Much of the warmth came in an 8 day stretch, from the 9th through 16th. Highs topped 60 on 6 of those days, with a max of 71 on the 13th. This was one of the earliest 70 degree days on record for La Crosse (4th) and well ahead of the average which is April 9th. However, temperatures nosedived after the mid month warm up, with highs mostly in the 40s or cooler. To further illustrate the roller coaster that was March, highs topped 60 on 7 days, but failed to warm above 40 on 10 days. March looked like it might be a very dry month with only one day of accumulating precipitation – for only a mere 0.01 inches - through the 21st. Snow then fell on 4 consecutive days, accounting for the entire month’s total of 9.9 inches. |
 |
|
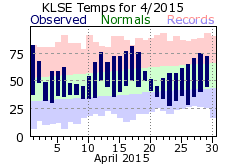
Typical for a spring month, April experienced the wild swings in temperature that occurred in March. There were more days with highs in the 40s and 50s (13) than in the 70s and 80s (10). Ironically, the 82 degree high for the month came on the 1st. It was also well ahead of the normal first 80 degree day in a year (April 29th). Over 4 inches of precipitation fell in April, almost 1 ½ inches above normal. However, nearly 2/3rds of that total came on the 7th and 9th, with only around an inch then falling through the end of the month. April did squeeze out some more snow though with minor accumulations on the 9th and 22nd (total of ½ inch for month). |
 |
|
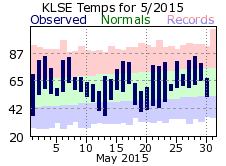
Not much consistency in temperatures for May either, although it did manage to finish above normal. Highs warmed to 80 degrees or higher 10 times, but couldn’t manage to get out of the 50s and 60s on 12 days. The wet trend would continue, but a bit more spread out compared to April. Measureable rain fell on 16 days, with 5 of those recording over 3/4rds of an inch. The 6.41 inch monthly total made it the 12th wettest May on record. On the whole, March, April and May would finish amongst the top 20 spring’s for temperature and precipitation (17th warmest and 18th wettest respectively).
|
 |
|
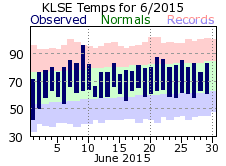
June was around normal for temperatures and a bit below in terms of rainfall. The warmest temperature of the year occurred on the 9th with a high of 96 degrees. However, it would be the only time it warmed into the 90s all month. Ironically, the coldest high occurred just a couple days later – 66 degrees on the 11th. Even though precipitation was below normal, what fell was spread across June, with no more than 4 days between accumulating rainfall. |
 |
|
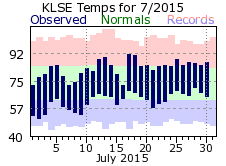
July got off to a relatively cool start with below normal temperatures on 10 of the first 11 days. Summery conditions settled in after that with highs 82 degrees or warmer from the 17th through month’s end. Rainfall was below normal for the second straight month – and got off to a very dry start. There was only 1 day of accumulating rainfall through the 12th with 0.40 inches dropping on the 6th. After that though, rain came on a fairly regular basis, falling every few days. |
 |
|
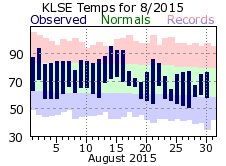
The first half of August averaged at or above normal temperatures, with a warm stretch of 3 consecutive 90 plus degrees on the 14th through 16th. It cooled down after that, mostly below normal, including 3 days where the high could not climb out of the 60s. On the whole though, August finished normal for its monthly average. Measurable rain fell on 10 days in August, typical for this late summer month. However, the bulk of that came on one day – with the 28th accounting for over 50% of the monthly total. Overall, August was around 1 ½ inches below normal. With 3 consecutive months of below normal precipitation, the summer came in just over 10 inches for rainfall, nearly 2 inches below normal. Temperatures were close to a typical summer. |
 |
|
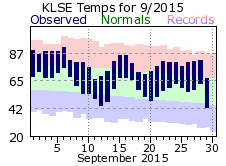
September started very warm as highs topped out in the upper 80s to around 90 the first 6 days. It was the second warmest start to a September in La Crosse, averaging 80.2 degrees during that period (1960 was warmer at 82.3 degrees). Aside from a few cooler days at mid-month and right at the end, it would stay warm and finish as the warmest September on record at 69.3 degrees. Highs were 80 degrees or higher 18 times, well above the average of 7, and second highest for September. In addition, highs only failed to crack 70 four times, below the average of 12 and tied for 4th fewest. Interestingly, there were no record high temperatures for the month, and only one highest low. September was below normal for precipitation, with most of it falling in the first half of the month. After the 18th, there was only one day with rain, and that only amounted to 0.16 inches on the 28th. |
 |
|
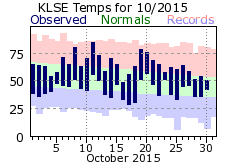
While October would finish above normal for temperatures, there was quite a bit of fluctuation. For example, it was 85 degrees on the 11th, the high for the month and the last 80 plus degree day of 2015. Just two days later, the high was only 59. The first freezing temperature of the fall season came on the morning of the 17th with 29 degrees. This was a week later than average. The dry trend of late September persisted into October with only one day of accumulating rainfall through the 22nd, and that was only 0.05 inches on the 8th. The last 9 days would try to make up for this deficit, raining on 6 of those for almost the entire 2.18 inch October total. This late burst helped it finish normal for precipitation. |
 |
|
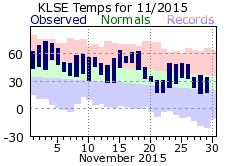
November continued the warm conditions of September and October and helped round of the fall months as the 2nd warmest on record for La Crosse at 55.1 degrees. It was the 3rd warmest November on record at 43.1 degrees. At or above normal temperatures occurred on all but 5 days…exceeding 60 degrees or greater for highs on 8 days. Low temperatures at or below freezing only occurred on 12 days…tied for second least in a November…and well below the average of 20 such days. Precipitation was right around normal for November. The bulk came after the 15th with over 3/4rds of the monthly total falling during the latter half. The first measurable snow fell in November - 0.7 inches on the 20th. This is over a week later than the average first measurable snow in La Crosse /Nov 11th/. |
 |
|
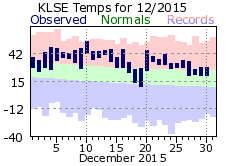
December rounded out 2015 very mild and wet, setting records for both. Daily temperatures were above normal on all but one day (the 19th) with highs reaching or exceeding 40 degrees on 16 days (average is only 6). The average low temperature of 29.1 degrees is actually the normal average high temperature for December. Lows never dropped into the single digits – which has only happened 4 other times. The mild temperatures kept most of December’s precipitation as rain, with the total of 4.93 inches crushing the previous all-time record for the month. That total is also the wettest out of any of the winter months. The 13th and 14th accounted for a bulk of the total with 3.16 inches on these two days. Less than 2 inches of snow fell through the 27th, but then a winter storm swept across the region on the 28th, dropping nearly 10 inches on the 28th and 29th. This dumping brought the monthly total more in line with its normal. |
 |
|
2015 will be remembered more for how it ended rather than started. A strong El Nino played a significant role in making it very mild. The last 4 months of the year were the warmest on record for La Crosse, tying it with 1931. The only month of the four to not set a top 10 record was October. Nine of the months of 2015 were above normal, with the only significantly cold month coming in February. While the year finished above normal for precipitation, much of that was due to a wet May and December. |
 |
| Highest temperature for 2015 | 96 on June 9th |
| Lowest temperature for 2015 | -15 on February 23rd |
| Highest one-day precipitation | 1.67 inches on May 29th |
| Highest one-day snowfall | 7.5 inches on December 28th |
| Number of days with highs at or above 90 degrees | 10 |
| Number of days with highs at or below 32 degrees | 52 |
| Number of days with zero or below temperatures | 26 |
| Peak wind gust | 49 mph from NW on July 18th |
| Number of days with measurable precipitation | 118 |
| Percentage of days with measurable precipitation | 32% |
| Number of days with above normal temperatures | 228 |
| Percentage of days with above normal temperatures | 62% |


 Weather Story
 Weather Map
 Local Radar