| Temperatures | Precipitation | ||||||
| Month | High | Low | Average | Departure | Total | Departure | Snow |
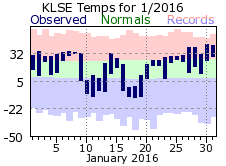
| January | 26.5 | 12.4 | 19.4 | +2.0 | 0.87 | -0.25 | 4.1 |
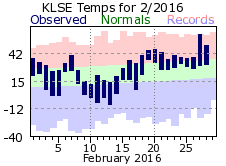
| February | 33.7 | 17.3 | 25.5 | +3.0 | 0.78 | -0.27 | 10.8 |
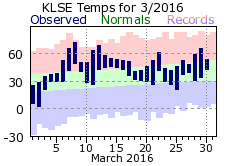
| March | 50.1 | 32.5 | 41.3 | +6.8 | 3.61 | +1.57 | 12.3 |
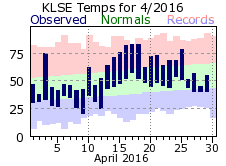
| April | 59.6 | 40.0 | 49.8 | +1.2 | 1.08 | -2.26 | 0.6 |
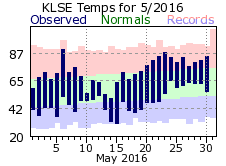
| May | 73.1 | 48.6 | 60.9 | +1.2 | 4.14 | +0.62 | 0.0 |
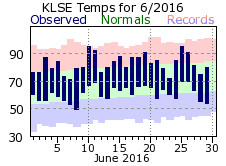
| June | 82.5 | 60.9 | 71.7 | +2.5 | 6.73 | +2.39 | ... |
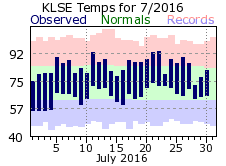
| July | 84.4 | 65.6 | 75.0 | +1.3 | 5.15 | +0.89 | ... |
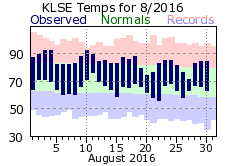
| August | 83.7 | 64.8 | 74.2 | +2.8 | 6.36 | +2.07 | ... |
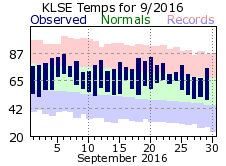
| September | 76.8 | 58.7 | 67.7 | +4.9 | 10.46 | +6.90 | ... |
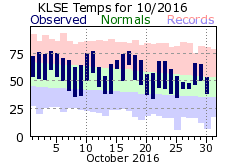
| October | 65.8 | 46.3 | 56.0 | +5.8 | 2.23 | +0.06 | 0.0 |
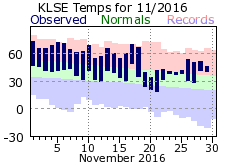
| November | 56.0 | 36.4 | 46.2 | +10.3 | 1.16 | -0.85 | T |
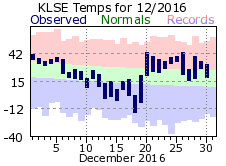
| December | 29.3 | 17.8 | 23.5 | +1.9 | 2.19 | +0.83 | 20.8 |
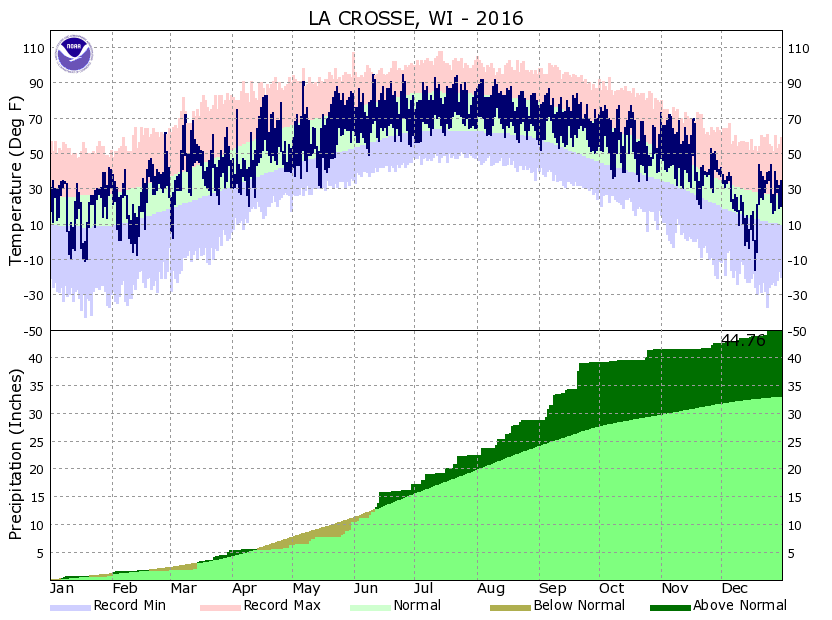
| TOTALS: | 60.1 | 41.8 | 51.0 | +3.6 | 44.76 | +11.70 | *** |
Records
Temperature...
Highs:
Lows:
Highest Lows:
Lowest Highs:
Monthly:
Seasonal:
Yearly:
Precipitation...
One-day pcpn:
One-day snowfall:
Monthly pcpn:
Monthly snowfall:
Seasonal precipitation:
Yearly precipitation:
|
The new year got started on a mild note with above normal temperatures for the first 9 days of 2016. It would cool off for the middle part of January with subzero lows occurring on 8 out of 10 days between the 10th and 19th. Mild conditions would round out the month, with a couple 40 degree days for the 30th and 31st. Snow was often but in very small amounts. A trace or more was recorded on 22 of the 31 days, but measurable on only 8 days. Of those, there was only day with over an inch of snow (1.2” on the 25th). The 4.1 inch total for the month tied it for the 13th least snowy January on record for La Crosse. |
 |
|
After a couple mild days, temperatures took a downward turn for the front half of February. Temperatures were at or below normal for 10 of the first 14 days, with a string of below zero lows for the 10th through 13th. The second half would see a return of the milder conditions as highs cracked 40 degrees 8 times. The max for the month of 62 on the 27th was the 10th earliest first occurrence of a 60 degree day in a year for La Crosse. Normally this occurs around March 23rd. Lows were at or above 30 degrees 21% of the time, well above the average of 9%. There were less days of measurable snowfall in February compared to January (5 to 8), but February more than doubled January’s total. A snow storm over the 2nd and 3rd accounted for most of the month’s accumulation with 8.4 inches falling on these two days. That said, only trace amounts fell after the 14th. |
 |
|
It would be a mild March for La Crosse in 2016 with its 41.3 degree average tying it for the 7th warmest on record. The bulk of the warmth came during the front half. The stretch from the 6th through 17th recorded highs of at least 50 degrees or warmer, with lows mostly in the 40s (closer to the normal highs rather than lows). The first 70 degree day of the year came on the 8th (72), which was the 3rd quickest 70 degree or warmer temperature in a year for La Crosse (average is around April 9th). Along with being very mild, March was a wet month. Measurable precipitation fell on 12 days with over ½ inch of precipitation on 3 of those. The 3.61 inch total made it the 9th wettest March on record. A lot of that came as snowfall with 12.3 falling through the month (well above the 7.1 inch normal). That said, the mild air made sure that when it snowed it did not stick around long. March harbored one of the windiest days of 2016. The 16th averaged 21.1 mph for the day and recorded a peak wind gust of 51 mph. |
 |
|
April experienced a lot of fluctuation when it came to temperatures, typical for this spring month. There were 10 days when highs could not climb to 50 degrees, while 8 days warmed above 70 – with a 3 day stretch of 80s from the 16th-18th. The biggest swing in temperatures came at the start of the month with a high of 38th on the 2nd, jumping to 75 on the 3rd, then falling back to earth for a chilly 44 on the 4th. The 3rd also has an impressive spread in the high and low for the day, with a morning low of 33 degrees, rocketing up 42 degrees by the afternoon. April was a dry month, finishing over 2 inches below its normal. There were 14 days with measurable precipitation, but 12 of those recorded less than 1/10 of an inch. The last measurable snow of the winter season fell on the 2nd with 0.6 inches. |
 |
|
Temperatures and precipitation were just about on par for May, finishing a bit above normal in both areas. Temperatures did experience a lot of swings over the first half of the month, illustrated by a high of 91 on the 6th and a chilly 51 on the 14th. The 90 degree day was the first of the year and about a month earlier than normal. The latter half of the month settled into highs in the lower 80s and lows near 60. While a bit above normal for rainfall, there was an 11 day stretch of dry conditions at mid month (14th through 24th). The only blemish was a meager 0.01” on the 16th. May did finish wet with measurable precipitation over the last 7 days – accounting for nearly 2/3rds of the monthly total. The average temperature of 50.7 degrees for the March, April and May made it the 9th warmest spring on record for La Crosse.
|
 |
|
June kicked off the summer on a warm and wet note. There were 20 days with highs 80 degrees or warmer, with 5 of those breaking 90. The warmest days of 2016 came in June, hitting 95 degrees on the 10th and 25th. Measurable rain fell on 13 days, with 5 of those recording over ½ inch. The bulk of the rain came mid month when 4.51 inches fell from the 9th through the 14th. |
 |
|
July would stay warm and wet. Highs were in the 80s or warmer most of the month (25 days) with lows of 70 or greater 9 times. While not quite as wet as June, July had its share of wet days. Over ½ inch fell on 5 days with only 4 days between bouts of measurable rain. The strongest wind of 2016 came courtesy of a severe thunderstorm on the 5th, gusting to 68 mph. |
 |
|
August continued the string of warm but wet summer months, finishing above normal for both temperatures and rainfall. Temperatures reached 80 degrees or warmer on 26 of the days, well above the average of 19 for such occurrences. The average of 74.2 tied it for the 12th warmest August on record for La Crosse. There were 11 days with measurable rain in August, right around what typically occurs. However, over ½ inch of rain fell on 6 of those days with an inch or more on 3 of them. It was a warm and wet summer in La Crosse. The average temperature of 73.6 degrees for June, July and August tied it for the 12th warmest on record. Meanwhile, the 18.24 inches made it the 7th wettest summer for La Crosse, exceeding the normal by over 8 inches. |
 |
|
The wet summer would give way to an even soggier September. The 10.46 inch total made it the 3rd wettest September on record for La Crosse, and 8th wettest for any month. There were 7 days with over ½ inch of rainfall, 4 of those exceeded an inch. The most for the month and year fell on the 21st with 3.17”. Not only did this set a record for the day, but it was the 22nd wettest day on record. In addition, it was just the 28th time that rainfall of 3 inches or greater has fallen in a day at La Crosse. Despite all the wet weather, the warmth continued. The 67.7 degree average made it the 7th warmest September on record. The stretch from June through September was the 3rd wettest 4 month period for La Crosse with 27.96 inches. For comparison, the normal rainfall for the entire year is 33.06 inches. So, 84% of the yearly normal fell during these 4 months |
 |
|
No end in sight to the mild conditions as the calendar rolled over to October. The 56.0 average was almost 6 degrees above normal and 14th warmest October on record. Temperatures failed to reach freezing, only the 11th time in La Crosse’s climate history this has occurred. In an average October freezing temperatures are felt on 6 days. Much, much less rain for October compared to the previous months – finishing right around its normal. There were 6 days with a 1/10 of an inch or more, but the bulk of the monthly total occurred over the 25th and 26th when 1.71 inches fell – accounting for 77% of the month’s total. |
 |
|
The mild conditions remained firmly entrenched across the region in November. The average temperature of 46.2 degrees in La Crosse was over 10 degrees above its normal, making it the second warmest on record. There were 4 days when highs reached or exceeded 70 degrees (tied for the most on record) and 15 days with highs of 60 or greater (also a record). It took until November 9th to record the first freezing temperature of the season – a record for latest in the season and well after the average of October 10th. Precipitation was sparse by November standards. It took until the 18th for the first measurable precipitation, which also happened to be the first day with a trace of snowfall. That said, there was no measurable snow for the month, and in normal year the first measurable snow of the season usually occurs during the 2nd week of November. The fall months of September, October and November finished as the warmest fall on record for La Crosse at 56.6 degrees (besting the previous record by a full degree). There were the most 60 degree or warmer days this fall (69) and the least amount of freezing days (only 10). The fall was also the 7th wettest on record with 13.85 inches, mostly thanks to the very wet September. |
 |
|
December ended 2016 on a relatively warm and wet note. Temperatures were above normal for the start and end of the month, with a cold stretch coming in the middle. Even then, it wasn’t significantly cold by December standards - the coldest day was on the 18th (high of 1 with a low of -16, coldest temperature for 2016). December finished close to an inch above normal for precipitation. Out of the 9 days that received measurable precipitation, 5 of those recorded ¼ inch or greater (one off the record for a December). It was a snowy month too, with the 20.8 inches just missing the top 10 for snowiest (it was number 11). The big snow maker was a winter storm that dropped 9.8 inches over the 10th and 11th. While there was snow on the ground Christmas morning in La Crosse, it didn’t necessarily feel like Christmas. Highs warmed to 40 just before midnight with over ½ inch of rain falling during the day. |
 |
|
2016 will go down as the wettest year on record for La Crosse, along with being one of the warmest. There were 44.76 inches of precipitation in 2016, squeaking by 1881 by 0.02” to make it the wettest on record. It was only the 3rd time La Crosse has exceeded 44 inches in a year. There were 32 days with ½ inch or more (2nd all time) and 14 days of an inch or more (tied the record for a year). The average temperature of 51.0 degrees was the 4th warmest and only the 6th time that La Crosse has averaged better than 50 degrees in a year. There were 94 days of 80 degrees or better, tied for 7th most in a year. Temperatures held above freezing on 248 days, 4th most in any year in La Crosse. Why so warm? A very strong El Nino (one of the strongest on record) in the early part of the early gave us a mild winter. A weak La Nina helped out to make the fall very warm. |
 |
| Highest temperature for 2016 | 96 on June 10th and 25th |
| Lowest temperature for 2016 | -16 on December 18th |
| Highest one-day precipitation | 3.17” on September 21st |
| Highest one-day snowfall | 7.5 inches on December 28th |
| Number of days with highs at or above 90 degrees | 14 |
| Number of days with highs at or below 32 degrees | 49 |
| Number of days with zero or below temperatures | 17 |
| Peak wind gust | 68 mph from west on July 5th |
| Number of days with measurable precipitation | 123 |
| Percentage of days with measurable precipitation | 34% |
| Number of days with above normal temperatures | 252 |
| Percentage of days with above normal temperatures | 69% |


 Weather Story
 Weather Map
 Local Radar