| Temperatures | Precipitation | ||||||
| Month | High | Low | Average | Departure | Total | Departure | Snow |
| January | 28.0 | 9.7 | 18.8 | +1.4 | 1.38 | +0.26 | 10.8 |
| February | 30.9 | 11.1 | 21.0 | -1.5 | 1.22 | +0.17 | 9.5 |
| March | 45.4 | 23.4 | 34.4 | -0.1 | 1.14 | -0.90 | 6.1 |
| April | 50.2 | 28.4 | 39.3 | -9.3 | 2.98 | -0.36 | 19.0 |
| May | 78.2 | 57.0 | 67.6 | +7.8 | 7.41 | +3.89 | 0.0 |
| June | 82.8 | 64.6 | 73.7 | +4.5 | 4.42 | +0.08 | ... |
| July | 85.8 | 65.0 | 75.4 | +1.7 | 2.40 | -1.86 | ... |
| August | 83.9 | 64.4 | 74.2 | +2.7 | 6.88 | +2.59 | ... |
| September | 75.2 | 56.3 | 65.8 | +3.0 | 6.08 | +2.52 | ... |
| October | 56.6 | 39.8 | 48.2 | -2.0 | 3.95 | +1.78 | 0.1 |
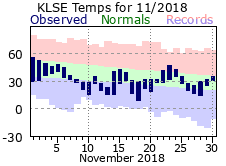
| November | 36.7 | 25.4 | 31.0 | -4.9 | 2.72 | +0.71 | 1.9 |
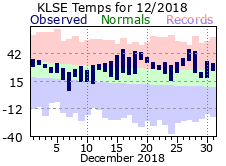
| December | 34.7 | 23.5 | 29.1 | +7.4 | 2.01 | +0.65 | 4.0 |
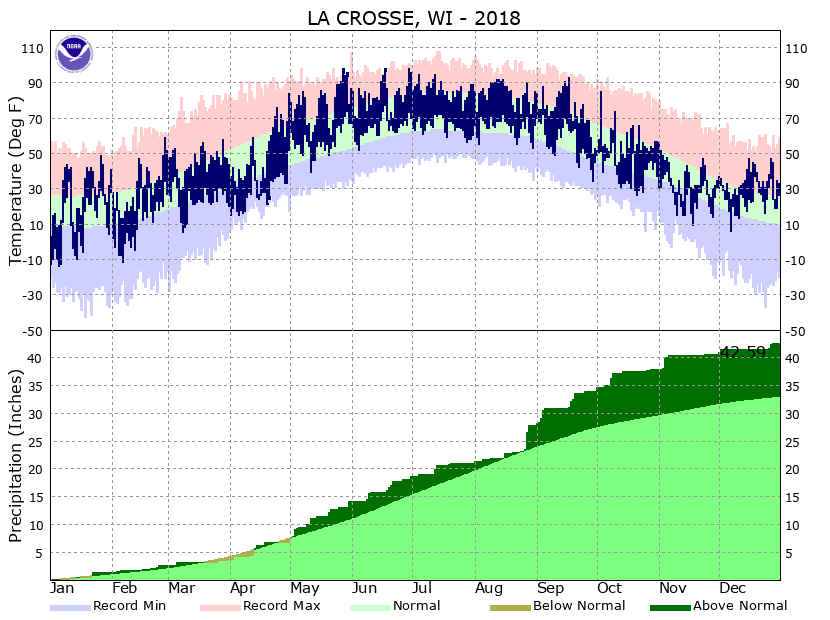
| TOTALS: | 57.4 | 39.1 | 48.2 | +0.8 | 42.59 | +9.53 | *** |
Records
Temperature...
Highs:
Lows:
Highest Lows:
Lowest Highs:
Monthly:
Seasonal:
Yearly:
Precipitation...
One-day pcpn:
One-day snowfall:
Monthly pcpn:
Monthly snowfall:
Seasonal precipitation:
Yearly precipitation:
|
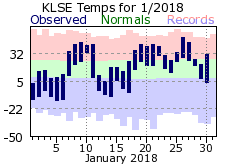
It was a chilly start to 2018 with single digit high temperatures on 3 of the first 6 days, with lows mostly in the teens below zero. That would quickly change as we entered the second week of January as much milder air spread into the region and then settled in for much of the rest of the month. Highs topped out in the 40s 11 times in January, well above the normal of 4 days and 6th most on record for a January. Despite the warmth, there were still enough colder days to keep the month on a whole only around 1 ½ degrees above its normal. Precipitation for the month finished a bit above normal, mostly thanks to the 22nd when 0.85 inches of rain fell (60% of the monthly total). Snowfall was normal for January, highlighted by the 6.7 inches that dropped on the 14th and 15th. Outside of those 2 days, measurable snowfall occurred on 7 days, but only amounted to an inch or more on 2 of them. |
 |
|
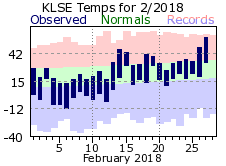
Winter returned for the first of half of February with highs only in the teens on 7 of the first 12 days with lows below zero also for 7 of those. More seasonable air returned for the rest of the month with highs even jumping into the 50s for the last 2 days. Shovels saw a lot of use for the start of February with at least a trace of snowfall falling over the first 9 days. Accumulations were minor over this period, only amounting to 6.9 inches. On the whole, there was 11 days with accumulating snow for February, 7th most on record and well above the normal of 6. However, no day recorded over 3 inches and the monthly total of 9.5 was actually an inch below normal. |
 |
|
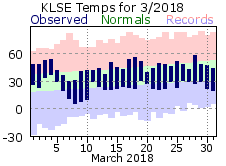
March hung right around its normal for temperatures all month long, averaging plus or minus 5 degrees of its daily normal on 20 of the 31 days. Highs were in the 40s to low 50s the bulk of the time, with lows generally in the 20s. It was a relatively dry month, finishing almost an inch below normal. There were 6 days with accumulating precipitation, with 3 days accounting for over 95% of the total. In fact, there was a stretch of 15 consecutive days when not even a flurry fell. Despite the 6.1 inch total for snowfall, it was a “snow free” March on the whole. There were only 2 days with measurable snow, and 6 of those inches came on the 5th with the additional tenth falling the next day. After the 6th, there were only 3 days that received a trace of snowfall. The 29 days with no measurable snowfall placed it in the top 20 for least in a March (on average March receives 5 days of measurable snow). |
 |
|
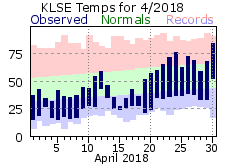
April in La Crosse felt more like March, Part 2 as temperatures averaged under 40 degrees for the entire month. The 39.3 degree average tied it with 1874 for the coldest April on record in La Crosse. High temperatures were held under 40 degrees 10 times with lows below 20 on 7 days. Both are records for April. The first 18 days were so cold that average temperatures were held below freezing (31.8), crushing the previous coldest start to an April by 4 ½ degrees. There was a taste of summer for the last day of April though as highs climbed to 84 degrees. It was not only winter temperatures for the start of April, but a lot of snow too. Measurable snow fell 6 times in April, all during the first 18 days. The 19 inch total set the all-time record for an April, blowing past the normal of just under 2 inches, and also made it the 42nd snowiest month on record in La Crosse. A sizable feat for an April. The month did end dry though with no rain or snow falling from the 19th onward. |
 |
|
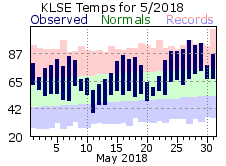
As the calendar flipped to May, so did the seasons – from winter to summer. Spring seemed to get left out this year. The average temperature for May was 67.6 degrees, almost 8 degrees above normal and also the second warmest on record. In fact, the average was so mild it was only a couple degrees below what can be expected for a normal June! Highs topped 80 degrees 15 times (tied for 3rd most in a May), exceeding 90 degrees 4 times. Temperatures nearly cracked 100 on the 27th with a 98 degree day – 4th earliest occurrence of 95 degree or warmer day in a year for La Crosse. The summer temperatures also brought a lot of summer-like rain. There was measurable rainfall on 16 days in May with 7 of those recording a ½ inch or more and 3 over an inch. The 7.41 inch total marked it as the 6th wettest May on record for La Crosse. The rainfall was fairly spread out with the longest stretch between measurable rains of only 4 days.
|
 |
|
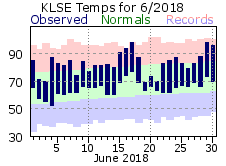
The warmth would continue for the start of the summer months with less than a week’s worth of below normal days in June. High temperatures reached 80 degrees or greater on 22 days (12th most in a June and well above the normal of 15) with 5 of those topping 90 (hitting 98 twice – 17th and 29th). The 73.7 degree monthly average set a new record for June, besting the previous by over a degree. Rainfall was normal for the month, both in number of days and total for the month. A thunderstorm did bring the highest wind gust for 2018 – 59 mph from the west on the 30th. |
 |
|
The warm summer air would hold across the region for July with daily temperatures generally at or above the monthly normal. Rainfall was well below normal for July (almost 2 inches). Measurable rains only fell on 7 days, but four of those recorded ¼ inch or more. There were a couple long dry stretches of note – the 5th through the 11th (no rain) and the 21st through 31st (only 0.03”). The peak wind speed for 2018 would be reached a second time, hitting 59 mph on the 4th . |
 |
|
August would continue the warm summer trend, finishing almost 3 degrees above normal (74.2, tied for 12th warmest on record). Highs reached 90 degrees or greater on 8 days, with a 7 day streak from the 9th through 15th accounting for most. Rain was more plentiful in August, measuring on 13 days for a total of 6.88 inches (15th most). Much of what fell came in a 2-day span with 4.39 inches on the 27th and 28th (64% of August’s total). The summer months of June, July and August were warm by La Crosse standards. The 74.4 degree average made it the 3rd warmest summer on records. No record for rainfall, but the 13.70 total was almost 2 inches above the average. |
 |
|
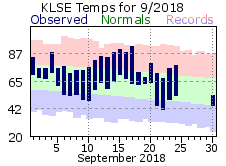
September would mark the 5th consecutive month with above normal temperatures – rounding out 3 degrees above a typical September. Most of the heat was found at mid month with a stretch of warm days from the 11th through the 20th. The last 90 degree day of 2018 would occur during this period (93 on the 17th). On the flip-side, highs would only reach 50 on the 29th. It was a very soggy start to September with 5 consecutive days of rain, amounting to over 3 inches. A spate of dry days from the 6th through the 16th would give the area a chance to dry out before another extended period of rain moved in for the 17th through the 21st. Overall, rainfall for the month would amount to 6.08 inches, 2 ½ inches above normal |
 |
|
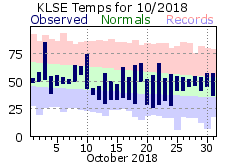
October broke the streak of warm months with daily temperatures mostly at or below normal. Highs didn’t reach 60 on 23 days, tied for 5th most in an October. Additionally, freezing temperatures were felt on 7 days. There were some dramatic daily swings in temperature; highs of 58 on the 2nd warmed to 85 on the 3rd, but tumbled right back to 54 on the 4th. The 10th and 11th also saw a 31 degree swing in highs – from 74 to 43 degrees. The month would start out wet with rain during half of the first two weeks. The 2.88 inches over this period accounted for nearly 3/4rds of the monthly total. On the whole, 3.95 inches would drop during October, 15th wettest for the month. The first snowfall of the new winter season would also fall in October with 0.1 inches on the 14th. This was the 8th quickest first measurable snowfall on record for La Crosse. |
 |
|
After a fairly wet but seasonable first week for November, temperatures would take a tumble, not warming above freezing on 14 of the remaining 23 days. This was the 3rd most days in a November where temperatures could not warm above 32. Average is only 5. On the flipside, highs only warmed to 50 degrees or greater twice (at the start of the month), tied for 3rd least on record and well below the average of 9. On the whole, the month was about 5 degrees below normal. As mentioned, it was a soggy start to the month as 2 ½ of rain fell from the 3rd through 6th. After that, while there were many days with flurries, not one day recorded more than 1/10 of an inch of precipitation or more than 1 inch of snow.
On the whole, it was a wet fall (Sep-Oct-Nov) with the 12.75 inches over those 3 months making it the 11th wettest fall for La Crosse on record. |
 |
|
The start to December was fairly seasonable with respect to temperatures, hovering around the normal through the 11th. After that, milder air settled in and held through the rest of the month. Temperatures averaged double digits above normal on 12 of the last 20 days. Highs topped 40 6 times while low temperatures during this period were generally at or above the normal highs for December. The mild conditions put a damper on snowfall. There was nearly 3 inches to kick the month off, but only 4 additional days with measurable snow after the 2nd, none recording over an inch. The bulk of the approximately 2 inches precipitation that fell in December came as rain, with the over 3/4rds of an inch on the 27th accounting for almost 40% of the total. |
 |
|
2018 will be remembered as a very wet year, along with its nearly complete absence of a spring season. 9 of the 12 months recorded above normal precipitation, with the yearly tally of 42.59 inches making it the 5th wettest on record for La Crosse. It was only the 12th time La Crosse has topped 40 inches in a year. There were 30 days with over ½ inch of precipitation falling – 3rd most on record – with 12 days of over an inch (4th most in a year).
As for the lack of a spring, as the calendar flipped from March to April and thoughts turned to flowers, budding trees and milder temperatures, Mother Nature had a decidedly different plan in store. Record cold and snow gripped the area for much of the month, with April recording the most snow out of any month for the 2017-18 snowfall season. The only other time this occurred was during the 2001-02 season. Moving into May, temperatures quickly rebounded to more summer-like readings. In fact, not only was it the 2nd warmest May on record, but its monthly average was only 1 ½ degrees colder than an average June. |
 |
| Highest temperature for 2018 | 98 on May 27th, June 17th and 29th |
| Lowest temperature for 2018 | -14 on January 5th |
| Highest one-day precipitation | 3.04 inches on August 27th |
| Highest one-day snowfall | 6.7 inches on April 3rd |
| Number of days with highs at or above 90 degrees | 24 |
| Number of days with highs at or below 32 degrees | 62 |
| Number of days with zero or below temperatures | 18 |
| Peak wind gust | 59 mph from W on June 30th and NW on July 4th |
| Number of days with measurable precipitation | 126 |
| Percentage of days with measurable precipitation | 35% |
| Number of days with above normal temperatures | 203 |
| Percentage of days with above normal temperatures | 56% |


 Weather Story
 Weather Map
 Local Radar