Upper Mississippi River Climate Summary for March 2024:
Temperatures - Well Above-Normal
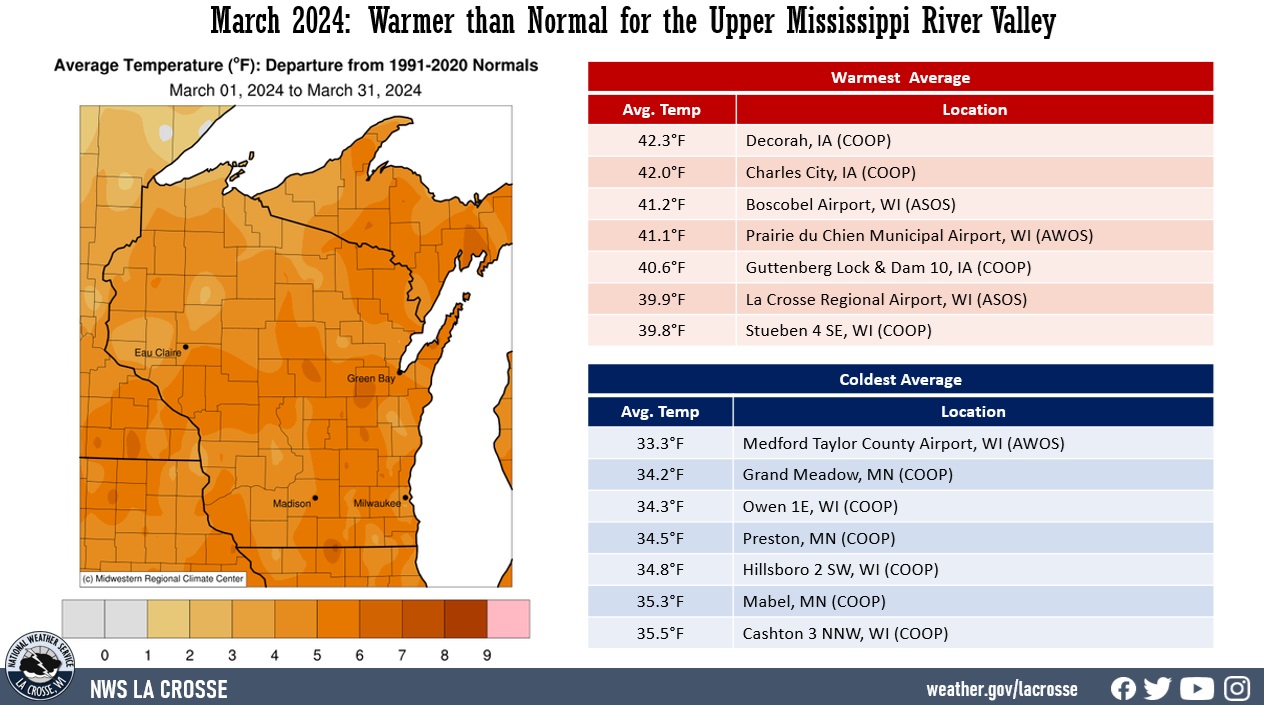
| During March 2024, average temperatures ranged from 33.3°F at Medford Taylor County Airport, WI to 42.3°F at Decorah, IA. Temperature anomalies ranged from 3 to 7°F above normal. There was a 76°F difference between the warmest and coldest temperatures in the Upper Mississippi River Valley. The warmest temperature was 78°F at Boscobel Airport, WI (ASOS) on March 3. Meanwhile, the coldest temperature was 2°F near Owen, WI (COOP) on March 1 and Sparta Fort/McCoy Airport, WI on March 23. |
 |
Precipitation - Below Normal
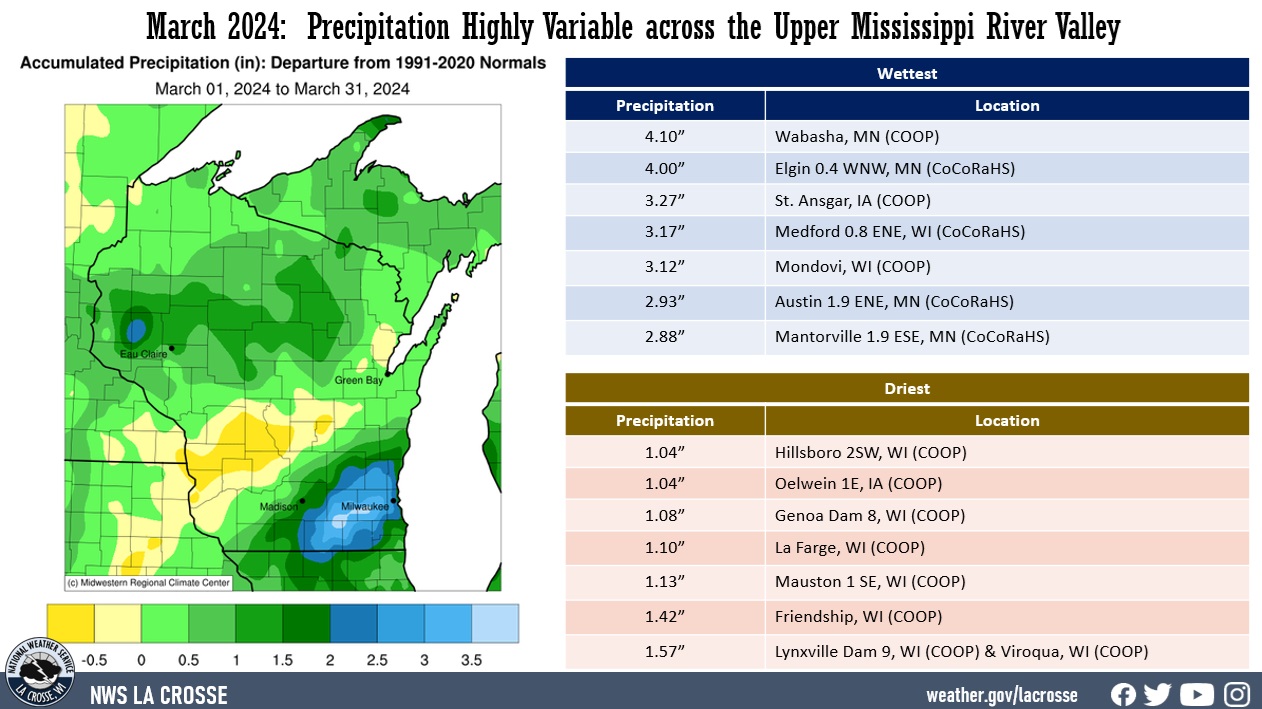
| Precipitation totals varied from 1.04" near Hillsboro, WI (COOP) to 4.10" at Wabasha, MN (COOP). Precipitation anomalies ranged from 1" drier than normal to 2" wetter than normal. The highest one-day precipitation was 2.20" from March 21 through March 22. Moderate drought developed briefly north of Interstate 90 by mid-March, but then heavy precipitation improved it to abnormally dry (D0). Meanwhile, abnormally dry (D0) to extreme (D3) drought lingers elsewhere. |
 |
Snowfall - Below Normal
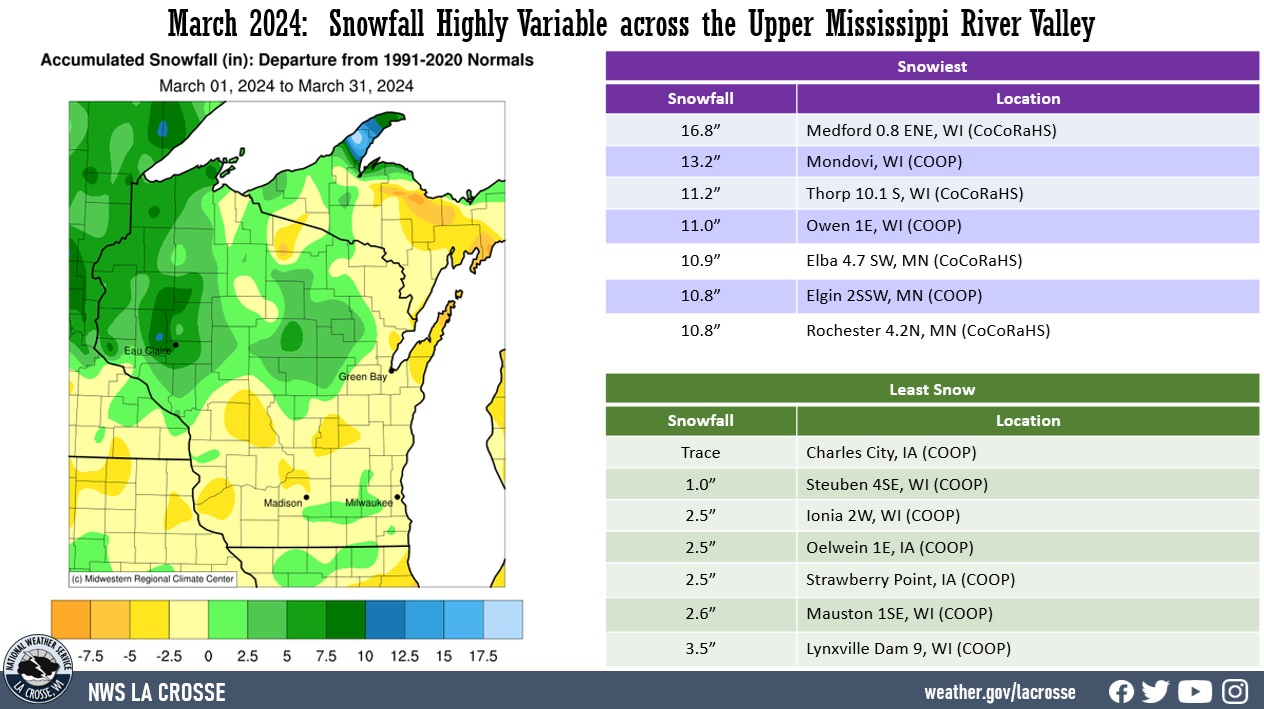
| Snowfall varied from a trace of snow at Charles City, IA (COOP) to 16.8" near Medford, WI (CoCoRaHS). Snowfall anomalies ranged from 7.5" below normal to 10” above normal. The highest one-day snowfall was 9.5" at Medford 0.8 ENE, WI (CoCoRaHS) from March 24 to March 25. |
 |
Below are the March 2024 climate summaries for La Crosse, WI, and Rochester, MN.
La Crosse, WI
March 2024 was Warmer- and Drier-than-Normal Precipitation for La Crosse, WI
...March 2024 Highlights...
Temperatures - Tied for the 14th Warmest March
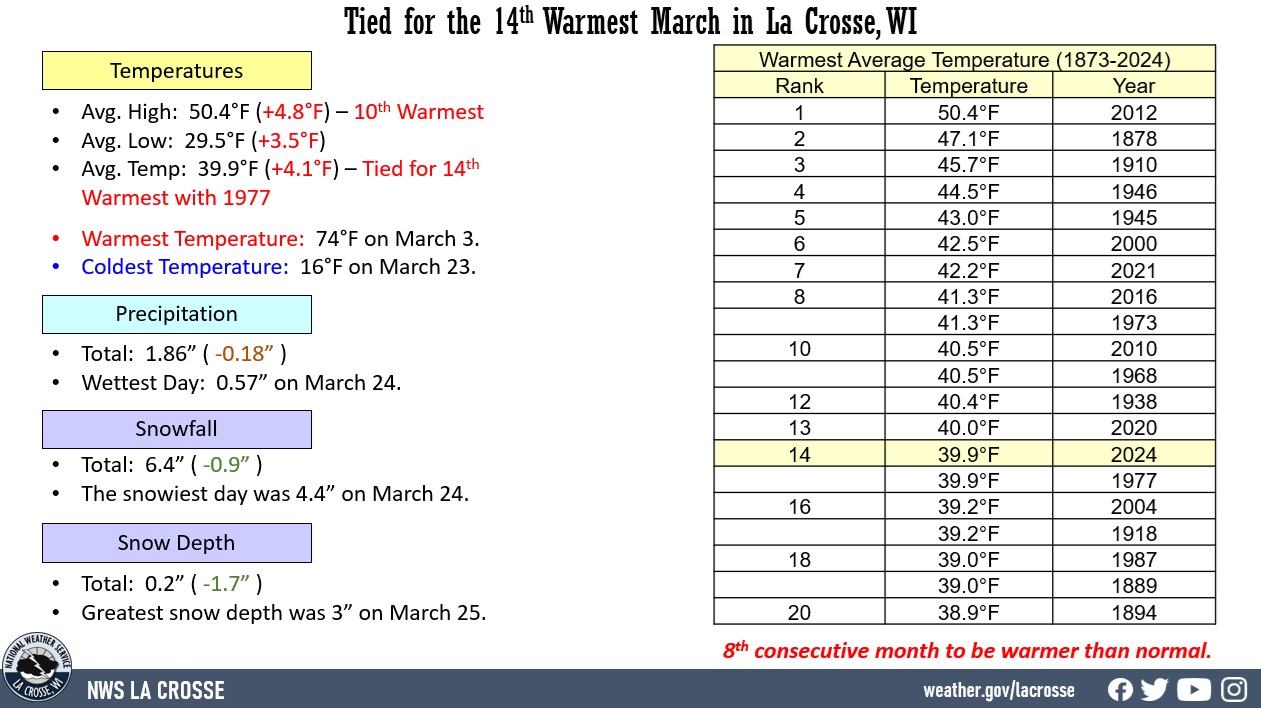
- The average temperature at La Crosse Regional Airport was 39.9°F.
- This was 4.1°F warmer than the 1991-2020 normal of 35.8°F.
- This March was tied for the 14th warmest March with 1977.
- This was the 8th consecutive month to be warmer than normal. 8 out of the 17 warmest Marches have occurred since 2000. This includes 3 out of the last 5 Marches.
|
 |
- Below are the 20 warmest Marches.
Warmest Marches
in La Crosse, WI
1873-2024
Average
Rank Temperature Year
---- ----------- ----
1 50.4°F 2012
2 47.1°F 1878
3 45.7°F 1910
4 44.5°F 1946
5 43.0°F 1945
6 42.5°F 2000
7 42.2°F 2021
8 41.3°F 2016
41.3°F 1973
10 40.5°F 2010
40.5°F 1968
12 40.4°F 1938
13 40.0°F 2020
14 39.9°F 2024
39.9°F 1977
16 39.2°F 2004
39.2°F 1918
18 39.0°F 1987
39.0°F 1889
20 38.9°F 1894
- The average high temperature was 50.4°F. This was 4.8°F warmer than the 1991-2020 normal of 45.6°F. This was the tenth warmest in March.
- The average low temperature was 29.5°F. This was 3.5°F warmer than the 1991-2020 normal of 26°F.
- The warmest temperature was 74°F on March 3.
- The coldest temperature was 16°F on March 23.
Precipitation - Slightly Drier than Normal
- A total of 1.86" of precipitation fell.
- This was 0.18 inches drier than the 1991-2020 normal of 2.04".
- 8 out of the last 10 months have been drier than normal.
- The wettest day was March 24 when 0.57" of precipitation fell.
- Measurable precipitation fell on 7 days (22.6%) and trace amounts of precipitation fell on 5 days (16.1%).
Snowfall - Slightly Below Normal
- A total of 6.4" of snow fell.
- This was 0.9" below the 1991-2020 normal of 7.3".
- The snowiest day was March 24 when 4.4" of snow fell.
- Measurable snow fell on 2 days (6.5%) and trace amounts of precipitation fell on 6 days (19.4%).
Snow Depth - Below Average
- The average snow depth was 0.2".
- This was 1.7" below the long-term average (1893-2024) of 1.9".
- The greatest snow depth was 3" on March 25.
- There was no snow on the ground on 26 days (83.9%), a trace of snow on 1 day (3.2%), and snow was on the ground on 4 days (12.9%).
...Records...
Daily...
- March 2 - Record High Tied - 65°F - Last set in 1923
- March 3 - Record High - 74°F - Previous record was 66°F in 1894
- March 11 - Record High - 70°F - Previous record was 67°F in 2012
...Looking Ahead to April...
- The normal high temperature in La Crosse starts at 53°F on April 1st and warms to 66°F by the end of the month.
- The normal low temperature starts at 33°F on the 1st and warms to 44°F by the end of the month.
- The warmest April temperature on record is 93°F on April 29, 1910, and April 22, 1980; and the coldest is -7°F on April 1, 1924, and April 6, 1982.
- The normal mean temperature for April is 49°F. La Crosse’s warmest April occurred in 1915 with an average temperature of 56.9°F, and their coldest April occurred in 1874 and 2018 with an average temperature of 39.3°F.
- The normal April precipitation is 3.75". The wettest April occurred in 1973 with 7.31" of precipitation and the driest occurred in 1879 with 0.42".
- The wettest April day occurred on April 27, 1975, when 3.91" of precipitation fell.
- Normally, there are 3 days with thunderstorms.
- The normal April snowfall is 2.9". The snowiest April occurred in 2018 with 19" of snow. The snowiest April day occurred on April 9, 1973, when 10.3" of snow fell.
Rochester, MN
March 2024 was Warmer- and Wetter-than-Normal Precipitation for Rochester, MN
...March 2024 Highlights...
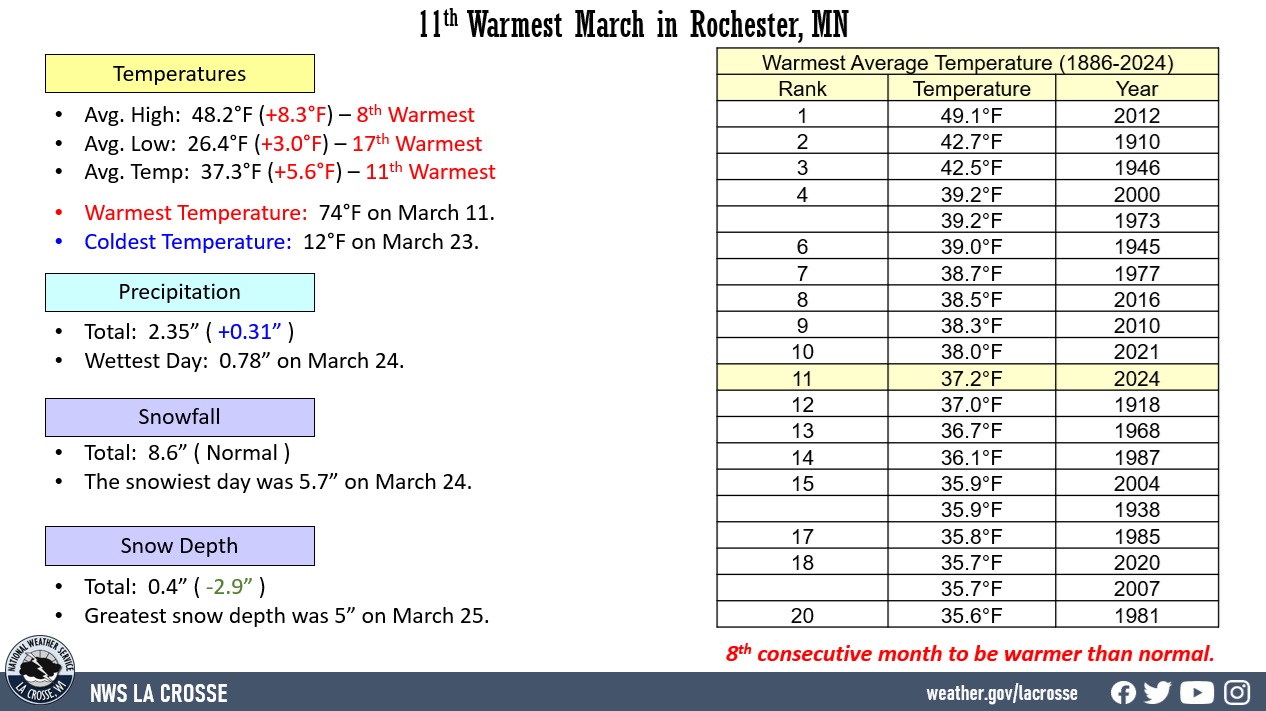
Temperatures - 11th warmest March
- The average temperature at Rochester International Airport was 37.3°F.
- This was 5.6°F warmer than the 1991-2020 normal of 31.7°F.
- This March was the 11th warmest.
- This was the 8th consecutive month to be warmer than normal. 9 out of the 19 warmest Marches have occurred since 2000. This includes 3 out of the last 5 Marches.
|
 |
- Below are the 20 warmest Marches.
Warmest Marches
in Rochester, MN
1886-2024
Average
Rank Temperature Year
---- ----------- ----
1 49.1°F 2012
2 42.7°F 1910
3 42.5°F 1946
4 39.2°F 2000
39.2°F 1973
6 39.0°F 1945
7 38.7°F 1977
8 38.5°F 2016
9 38.3°F 2010
10 38.0°F 2021
11 37.3°F 2024
12 37.0°F 1918
13 36.7°F 1968
14 36.1°F 1987
15 35.9°F 2004
35.9°F 1938
17 35.8°F 1985
18 35.7°F 2020
35.7°F 2007
20 35.6°F 1981
- The average high temperature was 48.2°F. This was 8.3°F warmer than the 1991-2020 normal of 39.9°F. This was the 8th warmest in March.
- The average low temperature was 26.4°F. This was 3°F warmer than the 1991-2020 normal of 23.4°F. This was the 17th warmest in March.
- The warmest temperature was 74°F on March 11.
- The coldest temperature was 12°F on March 23.
Precipitation - Above Normal
- A total of 2.35" of precipitation fell. This was 0.31" wetter than the 1991-2020 normal of 2.04".
- The wettest day was March 24 when 0.78" of precipitation fell.
- Measurable precipitation fell on 9 days (29%) and trace amounts of precipitation fell on 2 days (6.5%).
Snowfall - Normal
- A total of 8.6" of snow fell. This was the same as the 1991-2020 normal.
- The snowiest day was March 24 when 5.7" of snow fell.
- Measurable snow fell on 5 days (16.1%) and trace amounts of precipitation fell on 3 days (9.7%).
Snow Depth - Below Average
- The average snow depth was 0.4". This was 2.9" below the long-term average (1940-2024) of 3.3".
- The greatest snow depth was 5" on March 25.
- There was no snow on the ground on 25 days (80.6%), a trace of snow on 0 days (0%), and snow was on the ground on 6 days (19.4%).
...Records...
Daily...
- March 2 - Record High - 64°F - Previous record was 58°F in 1964
- March 3 - Record High - 72°F - Previous record was 56°F in 1946
- March 11 - Record High - 74°F - Previous record was 63°F in 2012
- March 12 - Record High - 69°F - Previous record was 67°F in 1990
- March 13 - Record High - 68°F - Previous record was 66°F in 1990
...Looking Ahead to April...
- The normal high temperature in Rochester starts at 48°F on April 1st and warms to 62°F by the end of the month.
- The normal low temperature starts at 30°F on the 1st and warms to 41°F by the end of the month. T
- The warmest April temperature on record was 92°F on April 24, 2009, and the coldest was 5°F on April 6, 1982.
- The normal mean temperature for April is 45.2°F.
- Rochester’s warmest April occurred in 1915 with an average temperature of 54.5°F, and its coldest April occurred in 2018 with an average temperature of 34.5°F.
- The normal April precipitation is 3.52". The wettest April occurred in 2001 with 7.30" of precipitation and the driest occurred in 1946 with 0.46".
- The wettest April day occurred on April 23, 1990, when 3.81" of precipitation fell.
- Normally, there are 3 days with thunderstorms.
- The normal April snowfall is 3.3". The snowiest April occurred in 2018 with 17" of snow.
- The snowiest April day occurred on April 20, 1893, when 14 inches of snow fell.


 Weather Story
 Weather Map
 Local Radar