| Temperatures | Precipitation | ||||||
| Month | High | Low | Average | Departure | Total | Departure | Snow |
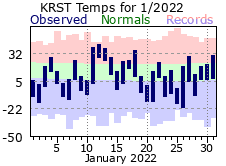
| January | 18.8 | -0.1 | 9.4 | -5.3 | 0.83 | -0.16 | 8.7 |
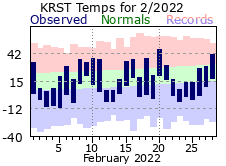
| February | 24.2 | 3.6 | 13.9 | -4.8 | 0.41 | -0.61 | 6.4 |
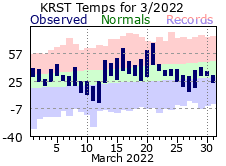
| March | 39.9 | 24.7 | 32.3 | +0.6 | 2.29 | +0.27 | 0.6 |
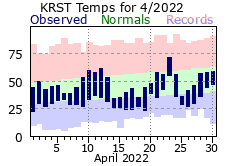
| April | 48.4 | 32.2 | 40.3 | -4.9 | 6.83 | +3.31 | 0.9 |
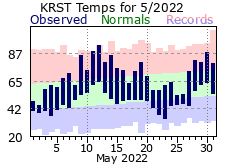
| May | 69.7 | 48.8 | 59.3 | +1.7 | 4.20 | -0.15 | 0.0 |
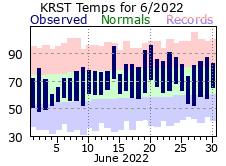
| June | 79.9 | 59.2 | 69.5 | +2.0 | 4.28 | -1.07 | ... |
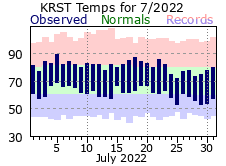
| July | 80.8 | 61.2 | 71.0 | +0.5 | 5.01 | +0.82 | ... |
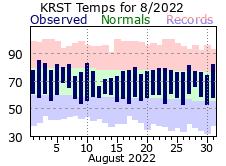
| August | 77.5 | 58.6 | 68.0 | -0.2 | 6.53 | +2.41 | ... |
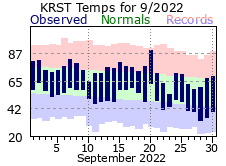
| September | 72.4 | 50.8 | 61.6 | +0.5 | 0.97 | 2.63 | ... |
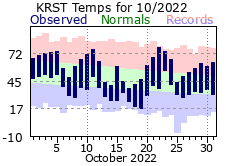
| October | 60.3 | 36.6 | 48.5 | +0.6 | 0.70 | -1.73 | 0.1 |
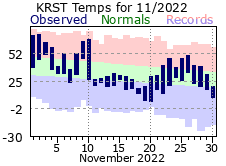
| November | 41.5 | 25.1 | 33.3 | -0.3 | 1.49 | -0.31 | 6.4 |
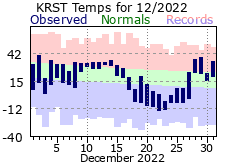
| December | 24.1 | 10.2 | 17.2 | -3.6 | 1.62 | +0.34 | 18.3 |
| TOTALS: | 53.1 | 34.2 | 43.7 | -1.1 | 35.16 | +0.49 | *** |
Records
Temperature...
Highs:
Lows:
Highest Lows:
Lowest Highs:
Monthly:
Seasonal:
Yearly:
Precipitation...
One-day pcpn:
One-day snowfall:
Monthly pcpn:
Monthly snowfall:
Seasonal precipitation:
Yearly precipitation:
|
January got 2022 off to a cold start, but temperatures would fluctuate from mild to cold every few days. Highs warmed to 30+ degrees 4 times (hitting 42 on the 12th) while holding in the single digits 7 times (not warming above zero on the 25th). Lows did bottom out at or below -10 nine times with the coldest temperatures of 2022 coming on the morning of the 26th (-21). On the whole, it was a cold month with the average temp finishing around 5 degrees below normal. Precipitation was around normal with 8 days recording measurable precipitation. However, most of what fell was minimal at best - outside of the 14th and 22nd which accounted for over 80% of the monthly total. Snowfall was on the lighter side for a January with the 8.7” total coming 3 ½ inches below normal. There were only 2 days with over 1” falling.
|
 |
|
More cold for February with the average temperature around 5 degrees below normal. Like January, there was a fair amount of fluctuation in day to day temps with 9 days warming above freezing while another 6 held in the single digits for highs (average is 3 days). February precipitation was over ½ inch below normal. While there were 8 days with measurable precipitation, only 2 of those recorded more than 0.05". Snowfall was limited – no surprise – with only 60% (6.4”) of the February normal falling. There were 8 days with measurable snow with only 2 recording more than 1”. |
 |
|
March was more in line with its monthly normal for both temperatures and precipitation, finishing just a bit above for both. Temperatures would get quite chilly into the 2nd week of the month with highs only in the 20s to teens for the 9th through the 12th. Mid month brought a brief warm up with a few days warming into the 60s before it got colder to round out the month. Almost 1” of rain fell on the 5th and 6th, but precipitation would be hard to come by after that – with only trace amounts falling through the 21st. More soaking rains returned for the 22nd and 23rd (1.23”) with 4 more days of measurable precipitation, although much lighter (mostly under 1/10”). Snowfall was almost negligible, with the first measurable snow holding off until the 23rd and only 3 additional days through the end of the month. The grand total of 0.6” made it the 7th least snowy March on record for Rochester (normal is 8.6”). |
 |
|
April continued the cool trend for the start of 2022 rounding out nearly 5 degrees below its normal. There were a lot of ups and downs when it came to day to day temps, however, illustrated by a high of only 35 degrees on the 18th, but then topping out at 71 on the 23rd. Highs didn’t climb out of the 50s 17 times (average is 10) while lows didn’t warm above freezing on 18 days (average is 13) – which tied for the 10th most freezing days in an April. It was a wet month, finishing almost 3 1/2 inches above normal with the 6.63” total making it the 2nd wettest April on record. There were 15 days when measurable amounts fell (average is 10) with 4 days accounting for 1” or more (tying for most such days in any April). The precipitation was also spread out with 6 days marking the longest stretch between measurable precipitation. Interestingly, April had 3 days with measurable snow, amounting to 0.9” – more than what occurred in March. |
 |
|
May managed to buck the cold trend of the previous months averaging around 1 ½ degrees above its normal. However, like most of the start of 2022, it was a month filled with warm and cold fluctuations: Highs topped 80 or warmer 9 times (average is 5), even managing to crack 90 degrees (94) on the 12th. This was a month sooner than average and also the 10th earliest in a year to reach 90 degrees in Rochester. Precipitation was right around its normal. Out of the 13 days with measurable rain, 8 of those recorded 1/10” with 3 of them coming in over ½”. The spring months of March, April, and May dropped 13.32” of precipitation on Rochester, making it the 7th wettest spring on record. |
 |
|
June finished a bit warmer than normal but got off to a cold start with temps at or below normal for the first week. A chilly high of only 60 degrees occurred on the 4th. Temperatures warmed after that, generally hovering at or a few degrees above the normal. The warmest day of the 2022 came in June with highs peaking out at 96 on the 20th. After that wet spring, it would dry out a bit in June, finishing around an inch below normal. That said, there were a couple days with over 1 ¼” of rain. |
 |
|
Temperatures went as expected for a typical July with the monthly average within ½ degree of the normal (on the warm side). Daily temperatures generally hovered within a few degrees of the normal, climbing to 80 or warmer 20 times but never reaching into the 90s. July rainfall was over ¾” above normal – mostly thanks to the 3.09” that drenched Rochester on the 23rd. It also happened to be the 8th wettest July day on record. 3 more days accounted for around 1/2” each while the other measurable rain days held around 1/10” or less. |
 |
|
Much like July, temperatures were right around the monthly normal, day in, day out, for August. Highs only warmed into the 80s 9 times, well below the average of 16. Conversely, highs never warmed out of the 60s only once (66 on the 12th), below the average of 3 such days. It was even soggier for August compared to July. The monthly total of 6.53” was almost 2 ½ inches above normal and finished as the 9th wettest August on record. There were only 9 days of measurable rain, but 5 of those measured ½ inch or more, with two exceeding 1”. While precipitation for summer months did not manage to crack the top 10 wettest for Rochester, the year to date was another matter. Total precipitation from January through the end of August amounted to 30.38”, 9th wettest start to a year for Rochester and also just a few inches off the normal for an entire year (35.67”). The wet conditions would not last as the summer transitioned into fall, however. |
 |
|
For the 3rd consecutive month, the average temperature was within a few tenths of a degree of its respective normal. Unlike the previous two months, September had more swings in daily temperatures as it transitioned from warmer summer temps to cooler fall ones. Highs topped 80 degrees on 5 days, but also failed to reach 70 degrees on 8 days. The last 90 degree day of 2022 came on the 20th (90F), about 1 month later than average and 8th latest occurrence of this kind of warmth for Rochester. September then flirted with freezing with a low of 33 degrees on the 28th. Unlike the wet end to the summer, September got the fall season off to a dry start with its monthly total of 0.97”, over 2 ½” below its normal, making it the 9th driest September on record. There were only 6 days with measurable rain, with 3 of those dropping 1/10” or greater (average is 6 such days). |
 |
|
While October continued the trend of rounding out close to its normal, the fall month gave Rochester a roller coaster ride of ups and downs when it came to daily highs and lows. .For instance, a high of 42 on the 18th would warm to 79 on the 22nd. Highs climbed above 70 degrees 8 times (average is 6) but couldn’t reach 50 degrees on 8 days. Further, low temperatures could not warm out of the 20s and 30s on 21 days. The first freeze of the fall season came on the 7th (morning low of 31) – about a week later than average. October was another very dry month with only 6 days of measurable precipitation – with only one of those dropping more than 1/10” of an inch.
|
 |
|
November got off to a very mild start with above normal temperatures on 8 of the first 10 days. Highs were in the 60s on 3 of those, climbing into the 70s twice. The average temperature over that period was 47.7 degrees, marking it as the 10th warmest start (of that length) in a November for Rochester. Temperatures tumbled after that, with a 12 day stretch of below normal temperatures. Highs were in the 20s and 30s over that period with a very chilly 5 degrees for a low on the 20th. The rest of the month hovered closer to its normal and in the end, all the big swings in temperature muted themselves out with the average for the month finishing nearly spot on its normal. Precipitation for November finished close to its normal too, highlighted by a mid month stretch of 6 consecutive days with measurable snowfall. For the month, there were 9 days of measurable snow, well ahead of the average of 4 and tied for 10th most in a November. While most of those days recorded on a few tenths, three of them had an inch or greater helping November finish at over 6 inches (a couple inches above the normal). |
 |
|
December ended 2022 as it began, on a chilly note, highlighted by a very cold 10 day stretch from the 18th through the 27th. Low temps were subzero through the period with temperatures never warming above zero on the 23rd (high of -5). Precipitation was a bit above normal for December, much of it falling during mid month. Measurable precipitation fell on 7 out of the 10 days from the 13th through the 22nd, accounting for 2/3rds of the monthly total. There were 10 days with measurable snow with 4 of those recording 2 or more inches. The 18.3” total was about 6 inches above normal. |
 |
|
Temperatures for 2022 were on the cooler side, mostly thanks to a cold start and chilly end to the year. After April, monthly temperatures held closer to their normals through November. However, most of those months experienced broad fluctuations between their warmest and coldest temperatures, over 50 degrees in some cases. These wide variances averaged each other “out”, pushing temps toward their normal, masking the true nature of how variable temperatures really were. Rochester was in the ballpark when it came to precipitation for 2022, finishing around ½” above normal. There were 120 days with measurable precipitation, over a week more than normal (112). 10 of those days recorded 1” or more. Snowfall for the 2021-22 season (July-June) was only 30.3”, lowest since the 2011-12 winter and 15th least snowy season on record for Rochester. The normal is 53.1”. |
 |
| Highest temperature for 2022 | 96 on June 20th |
| Lowest temperature for 2022 | -21 on January 26th |
| Highest one-day precipitation | 3.09" on July 23rd |
| Highest one-day snowfall | 5.2" on December 9th |
| Number of days with highs at or above 90 degrees | 6 |
| Number of days with highs at or below 32 degrees | 86 |
| Number of days with zero or below temperatures | 39 |
| Peak wind gust | 76 mph from the SW on May 9th |
| Number of days with measurable precipitation | 120 |
| Percentage of days with measurable precipitation | 33% |
| Number of days with above normal temperatures | 173 |
| Percentage of days with above normal temperatures | 47% |


 Weather Story
 Weather Map
 Local Radar