|
2012 Central Alabama - The Year in Review
2012 Headlines
**Note: All of the following data should be considered preliminary. Not all of the data has been quality controlled.**
One of the most persistent hydrologic features throughout 2012 was the drought that affected parts of the area, especially the southeast and east-central portions of Central Alabama.
As the year began, moderate to extreme drought prevailed across the southeast sections of Central Alabama and continued into the spring months, while gradually spreading northward into the east-central counties. The drought conditions persisted in these general areas through the summer and into the fall, despite a fairly typical summertime pattern of convective showers and thunderstorms across Central Alabama. Even rainfall associated with the remnants of Hurricane Isaac did little to alleviate the drought, as the most significant rain from this weather feature occurred in the western counties. By November, an a-typical pattern of very dry weather developed and drought conditions worsened and spread north and west, with exceptional drought developing in east-central Alabama. These conditions continued through December, even though a more normal pattern of periodic rainfall returned.
The major impacts from the drought of 2012 were to farm crops. Many crop yields were diminished, with impacts also felt to some degree by cattle farmers as forage and hay yields were affected. However, no major impacts to municipal water supplies and area reservoirs occurred despite low stream flows prevailing for much of the year.
|
| Flooding & Flash Flooding |
Despite drought conditions prevailing in the east-central and southeast sections throughout the year, there were some episodes of flooding across the area. Most of this flooding came in the form of flash flooding, with only a couple minor episodes of river flooding observed, such as on the lower Warrior River in late January. In contrast, widespread significant flash flooding occurred during the months of July and September.
In July, widespread flash flooding occurred on the 18th in the Alabaster area of Shelby County when four to six inches of rain fell in a few hours. This produced flash flooding of the Thompson High School and several homes in the surrounding area, with water four to six feet deep in the basements of some homes. Many streets and roads were also flooded in the area and impassable. Then, on the 31st, additional heavy rainfall produced widespread flash flooding across portions of Jefferson and Shelby Counties, including the Pelham and Helena areas. Several homes were flooded in the Saddle Run subdivision in Shelby County. Numerous roads and streets were flooded and impassable across the area.
In September, the remnants of Hurricane Isaac dropped torrential rainfall over the west and southwest portions of Central Alabama during the evening of the 3rd through the morning of the 4th. Five to ten inches of rain were reported in portions of Pickens, Hale and Tuscaloosa counties during the night, and farther south and east through Bibb, Dallas and Lowndes Counties during the morning hours of the 4th. Serious flash flooding occurred overnight in Reform in Pickens County, with widespread flooding of streets and buildings in the downtown area. In Gordo in Pickens County, evacuations were required due to flood waters and some bridges were washed out. Additional serious flash flooding developed during the morning of the 4th across Bibb, Dallas and Lowndes Counties, with many streets and roadways impassable due to high water. Portions of some major highways, including Highway 5 near Brent, were impassable. Widespread flash flooding occurred in Selma, with water three feet deep flowing through the downtown area, making many streets impassable and flooding businesses, including the Selma mall. Due to the serious, life-threatening nature of the flooding, a Flash Flood Emergency was issued for Selma during this event.
Although periodic, localized heavy rainfall occurred at other times during the year. Flooding was generally more of a nuisance type, affecting mostly localized streets and roadways.
Data supplied by the NWS BMX. Additional Flood Information can be found at the following links:
|
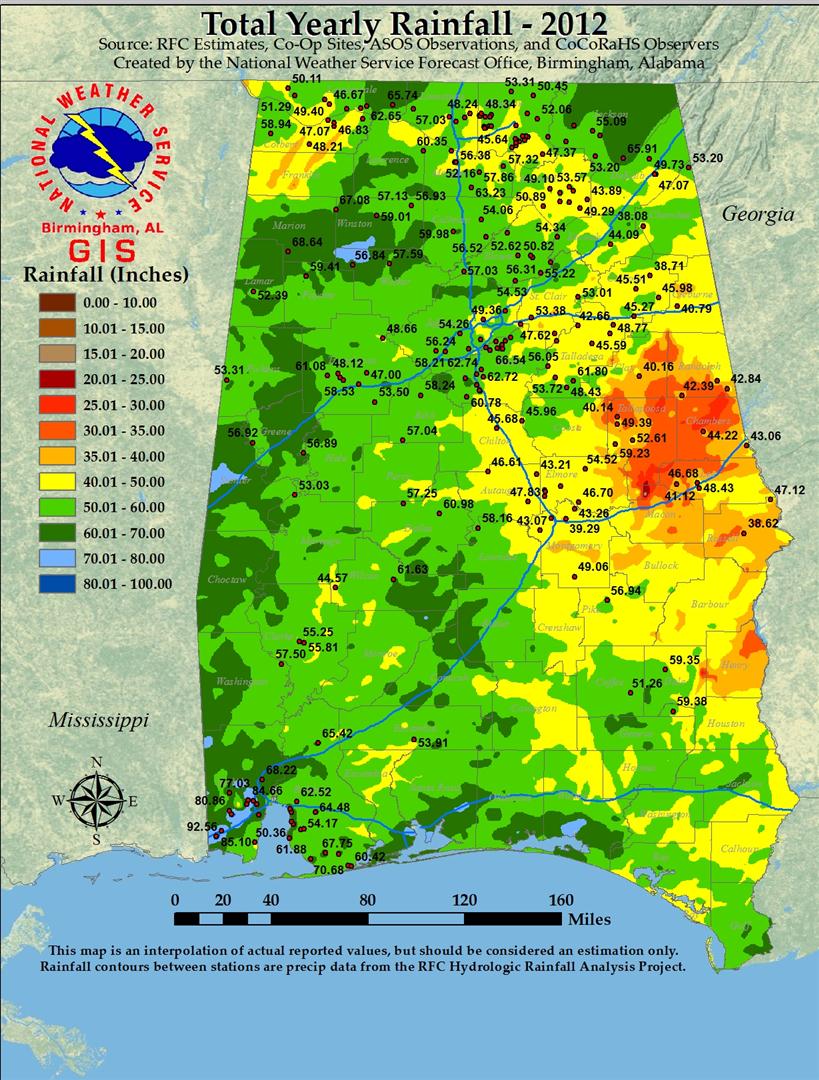
2012 Precipitation Totals around Central Alabama
|
| |
Birmingham
|
Montgomery
|
Tuscaloosa
|
Anniston
|
Calera
|
Troy
|
| Total Precipitation |
49.36"
|
43.07"
|
48.12"
|
45.27"
|
55.71"
|
56.94"
|
| Normal Precipitation |
53.72"
|
53.07"
|
52.60"
|
49.67"
|
54.68"
|
54.62"
|
| Departure from Normal |
-4.36" |
-10.00" |
-4.48" |
-4.40" |
1.03" |
2.32" |
|
|
|
|
An early spring season strong westward extension of the Bermuda high pressure ridge, combined with low pressure which developed over the distant southwestern United States, set up an atmosphere of prevailing mostly clear skies over the Heart of Dixie by the mid-month of March 2012. Several subsequent record breaking or near record breaking (match to previous occurrence) temperatures were reached at Birmingham and Montgomery by mid-March 2012.
In conjunction with the early season high pressure westward extension was the occurrence of a cut-off low pressure over the four corners. Had this cut-off low not occurred, there likely would not have been any remarkable records set. However, the polar jet stream steering had realigned across the northern states leaving the low pressure stagnant for days over the desert southwest, and persistent southerly flow prevailed west of the Mississippi.
For more on the heat from March, click here.
|
|
Preliminary severe weather numbers for Central Alabama in 2012:
|
Tornadoes in 2012
|
|
EF0
|
9
|
|
EF1
|
15
|
|
EF2
|
10
|
|
EF3
|
1
|
|
EF4
|
0
|
|
EF5
|
0
|
| Total # of Tornadoes |
35
|
| 10 Year Average # of Tornadoes (2002-2011) |
38 (383)
|
| 20 Year Average # of Tornadoes (1992-2011) |
26 (528)
|
| 30 Year Average # of Tornadoes (1982-2011) |
22 (655)
|
| Max# of Tornadoes in Any Year Since 1970 |
78 in 2011...Previous Record 58 in 2005
|
| Min# of Tornadoes in Any Year Since 1970 |
4 in 1993 & 1991
|
|
Days with Severe Weather in 2012
|
| Days with Tornadoes |
9 |
| Days with Wind Damage or Wind Speeds 58 mph or greater |
41 |
| Days with Hail 1.00 inch in diameter or larger |
23 |
| Days with Flash Floods |
16 |
|
Average Severe Weather Days Expected in a Year (2002-2011)
|
| Days with Tornadoes |
9 (94) |
| Days with Wind Damage or Wind Speeds 58 mph or greater |
41 (415) |
| Days with Severe Hail |
28 (278) |
| Days with Flash Floods |
16 (165) |
|
Previous Years Days with Severe Weather
|
| |
2011 |
2010 |
2009 |
2008 |
2007 |
2006 |
2005 |
2004 |
2003 |
2002 |
2001 |
| Tornado |
11 |
6 |
13 |
17 |
9 |
9 |
9 |
5 |
8 |
6 |
7 |
| Damaging Wind |
50 |
44 |
39 |
40 |
42 |
43 |
36 |
34 |
46 |
50 |
43 |
| Hail |
33 |
18 |
29 |
33 |
20 |
35 |
32 |
26 |
29 |
33 |
23 |
| Flash Flood |
19 |
22 |
32 |
6 |
3 |
11 |
20 |
14 |
22 |
11 |
9 |
Data supplied by the NWS BMX. Additional information on severe weather and storm surveys can be found at the following links:
|
|
The 2012 Atlantic Hurricane season produced 19 named storms, of which 10 became hurricanes and one became a major hurricane. The number of named storms is well above the average of 12. The number of hurricanes is also above the average of six, but the number of major hurricanes is below the average of three.
Based on the combined number, intensity, and duration of all tropical storms and hurricanes, NOAA classifies the season as above-normal. 2012 was an active year, but not exceptionally so as there were 10 busier years in the last three decades.
The remnants of Hurricane Issac brought heavy rainfall and flash flooding to Central Alabama during the first week of September. Hurricane Issac made landfall along the southeastern Louisiana coast late Tuesday, August 28 and slowly tracked northwestward through Louisiana and Arkansas for several days before turning to the east. The remnant upper level trough associated with Issac crossed Alabama on Monday and Tuesday, September 3 and 4. Within a moist airmass (precipitable water values over 2.00 inches), clusters of thunderstorms trained across the same areas, resulting in flash flooding and wind damage on September 3. Although storm intensity and rainfall rates weakened overnight, thunderstorms continued to develop along a convergent boundary across west Central Alabama. After sunrise on September 4, storms re-intensified and flash flooding occurred at several locations which had rainfall for much of the night. As the upper level trough axis pushed into the area, the thunderstorm clusters shifted south of the area by midday.
National Hurricane Center 2012 Atlantic Hurricane Seasonal Summary
Data provided by the NWS BMX and NHC.
|
|
Though we may have seen a couple of flurries at times during 2012, there was no significant winter weather through the year. In fact, January and February were fairly warm in comparison to normal values.
|
Average Temperature (T) Comparison for January and February 2012
|
| |
Average T for
January 1981-2010
|
Average T for
January 2012
|
Average T for
February 1981-2010
|
Average T for
February 2012
|
| Birmingham |
43.8
|
49.7 (+4.9)
|
47.7
|
51.9 (+4.2)
|
| Montgomery |
46.6
|
52.6 (+6.0)
|
50.5
|
55.2 (+4.7)
|
|
| |
Birmingham
|
Montgomery
|
Tuscaloosa
|
Anniston
|
Calera
|
Troy
|
Hottest
Day |
104 (July 1)
|
102 (July 30)
|
105 (Jun 29)
|
104 (Jun 30, Jul 1)
|
105 (Jun 29)
|
99 (Jun 30)
|
Coldest
Day |
20 (Feb 12)
|
19 (Jan 4)
|
20 (Jan 4)
|
17 ( Jan 4)
|
21 (Jan 4)
|
17 (Jan 4)
|
Wettest
Day |
4.31" (July 31)
|
2.21" (Feb 18)
|
2.82" (Sep 3)
|
2.11" (Aug 9)
|
4.81" (Jul 31)
|
3.02" (Mar 23)
|
| |
# of Days 95 Degrees
or Warmer
|
# of Days 100 Degrees
or Warmer
|
# of Days 32 Degrees
or Colder
|
# of Days 20 Degrees
or Colder
|
| Birmingham |
24
|
4
|
26
|
1
|
| Montgomery |
31
|
8
|
19
|
1
|
| Tuscaloosa |
33
|
12
|
27
|
1
|
| Anniston |
21
|
3
|
34
|
4
|
|
|

