 Email the authors
 TABLE OF CONTENTS
Section 1: Introduction
A powerful storm system brought high winds, a flash freeze/snow burst and heavy lake effect snow with blizzard conditions to the region between 23-25 December 2022. This included the second highest wind gust on record at the Burlington International Airport (BTV) at 71 mph, and widespread 60-70 mph gusts along with numerous power outages and tree damage. Tragically, there was also a storm-related fatality from a falling tree in Castleton. Lightning was also reported near Springfield, Vermont, and portions of northern New York due to the vigorous dynamics of the system with severe weather reported across southern New England. Temperatures rose well into the 50s before plummeting by 30 degrees in a few hours leading to a widespread flash freeze and hazardous travel during the evening of December 23rd and into the day on December 24th. A secondary low pressure system developed along the frontal boundary and brought brief near-blizzard like conditions on the evening of December 23rd, with a widespread 3 to 6 inches of fluffy snow, that ensured a White Christmas for the region after the antecedent snowpack vanished earlier in the day. As the primary low pressure exited, persistent southwest flow developed and due to the sharp temperature difference between 925mb and Great Lake temperatures, the stage was set for a long duration heavy lake effect snow event for St Lawrence County that brought 2 to 3 feet of snow through Christmas Day along with blizzard conditions. Finally, the combination of snow melt and rainfall produced sharp rises on waterways with several rivers reaching minor flood stage on December 23rd into the 24th. The arctic air also resulted in an isolated ice jam event on the Raquette River in Pierrepont, New York, necessitating the evacuation of several homes. In this analysis, we will review the above mentioned aspects of this high-end, multi faceted system.
Section 2: High Winds
This powerful winter storm produced very strong southeast to east winds across most of the North Country on 23 December 2022. A 71 mph wind gust was measured at Burlington International Airport at 829 AM on the 23rd, which was the 2nd highest gust ever recorded. The highest recorded gust of 72 mph on 26 November 1950 was associated with the Great Appalachian Storm. Other wind gusts included 61 mph in Malone, New York, 60 mph in Colchester, and 53 mph in Montpelier. The highest wind gust observed areawide occurred atop Mount Mansfield at 130 mph on the morning of December 23rd. It is possible high wind gust observations were underreported owing to the loss of power and ability to transmit data from some stations. Power outages across Vermont reached over 98,000 customers on December 23rd, with many outages occurring across the eastern side of the Champlain Valley, Western Slopes, and parts of central and northern Vermont, including the Northeast Kingdom. This windstorm ranked among the top 10 most outages in Vermont history.
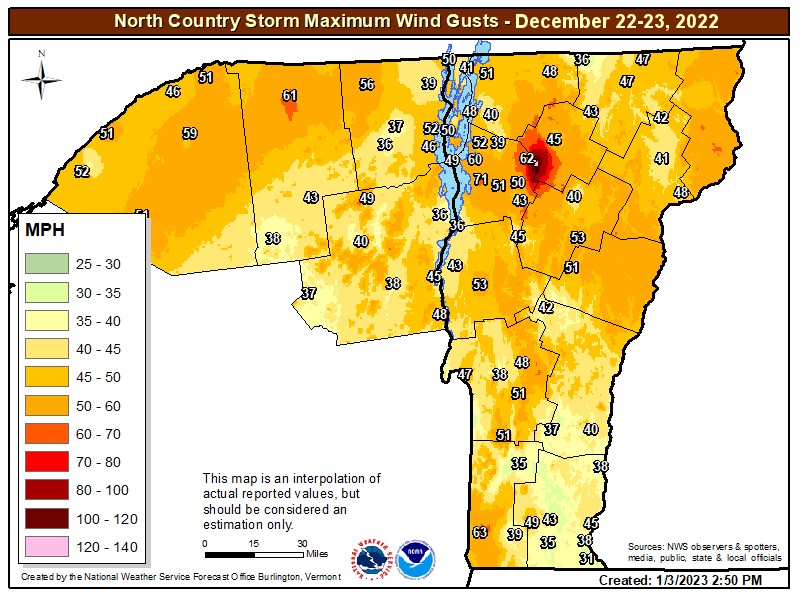
Figure 1: North Country maximum wind gusts ending on 24 December 2022. *** Disclaimer: The observed extent of strongest wind gusts might be underreported because a lot of sites lost power during the storm and stopped reporting. BTV might well have ended up with the highest gust aside from Mount Mansfield because power was maintained throughout the event.[click to enlarge]
The surface evolution of this powerful storm system was amazing to watch, developing from a broad region of low surface pressure, with a mature cyclone moving from the northern Plains into the Great Lakes region and a new cyclone developing in the Carolinas. By December 22nd at 7 PM, they would consolidate into a rapidly deepening area of low pressure with a central pressure of 970mb by 7 PM on the evening of December 23rd. This sudden and significant drop of over 30 mb in 24 hours of atmospheric pressure indicated rapid intensification. Figure 2 below (left image) shows the Weather Prediction Center (WPC) surface analysis on 23 December 2022 at 1 AM and at 7 AM (right image), with elongated 995 mb low pressure quickly deepening to 982 mb near Toronto, Ontario, while high pressure remained anchored over eastern Canada. The strong pressure gradient between developing low pressure and 1032 mb high pressure, helped to enhance the very strong and gusty southeast to east winds across our region on December 23rd. An upper jet streak digging into the base of an anomalous, negatively-tilted upper trough was observed over the Great Lakes with a corresponding negatively tilted ridge centered over the Canadian Maritimes, which is a common set up for downslope southeasterly winds (not displayed).
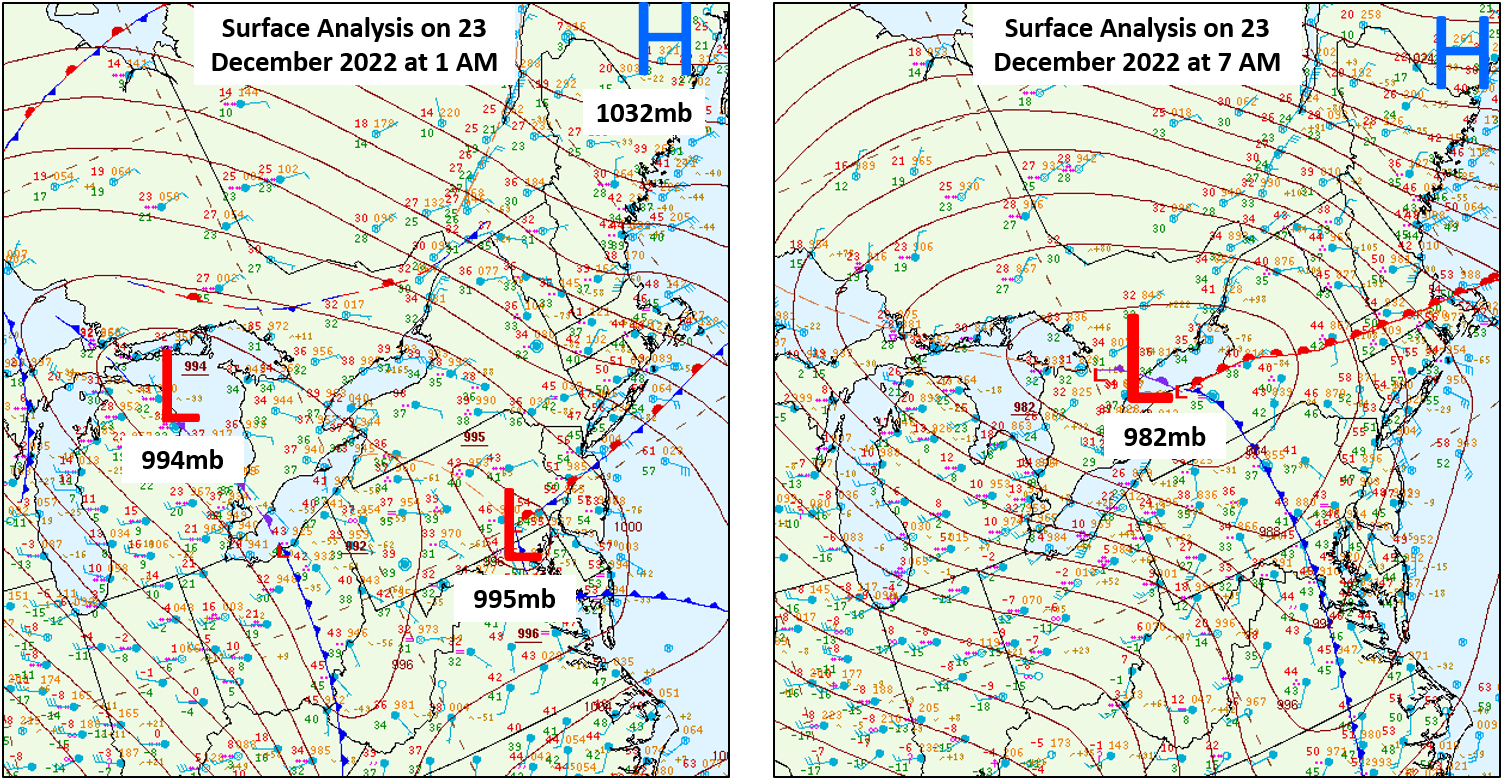
Figure 2: Weather Prediction Center (WPC) surface analysis 23 December 2022 at 1 AM (right) and 7 AM (left). [click to enlarge]
The next set of surface charts indicate how surface low pressure continued to deepen to 970mb by 7 PM on December 23rd, while surface high pressure slowly shifted toward the North Atlantic. The upstream blocking high pressure allowed the deepening area of strong low pressure to quickly become vertically stacked from the surface through 500 mb, resulting in a very slow movement to the northeast across southern Ontario Province. Initially, northern New York and Vermont were on the warm side with temperatures in the upper 40s to mid 50s, with Burlington reaching 56°F, before a sharp cold front caused temperatures to plummet by evening. Figure 3 below shows the surface evolution and associated fronts from 2 PM (left image) to 7 PM (right image) on 23 December 2022.
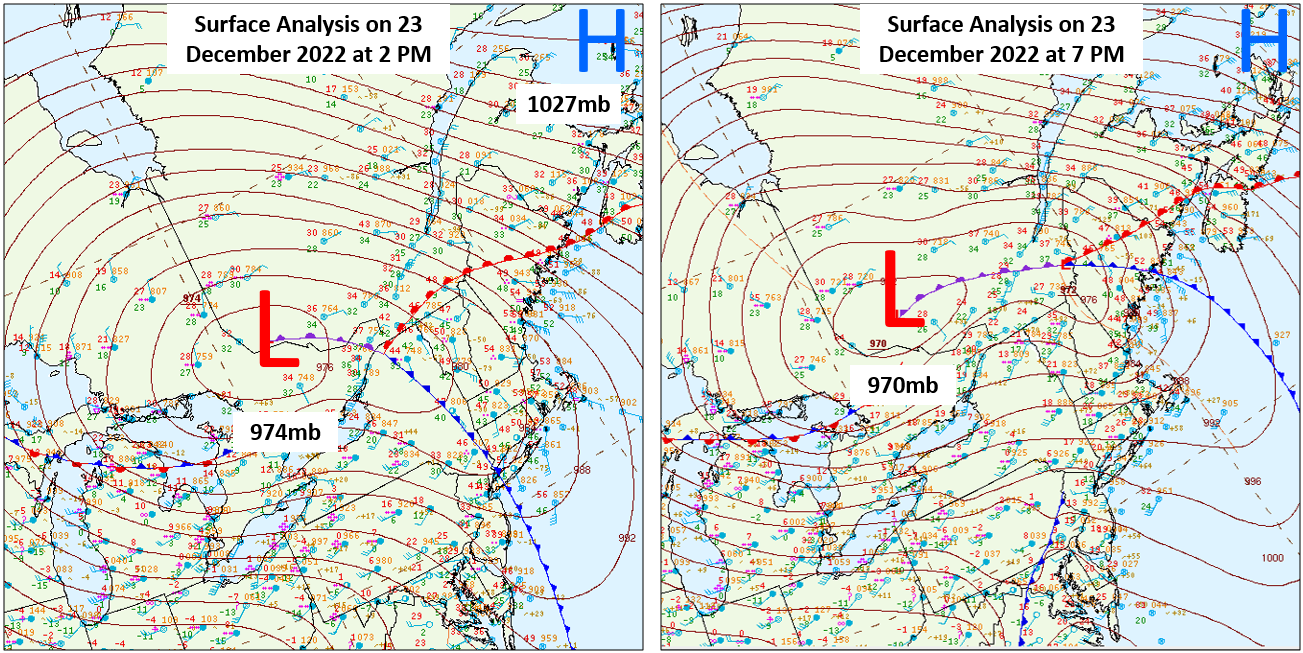
Figure 3: WPC surface analysis 23 December 2022 at 2 PM (right) and 7 PM (left).[click to enlarge]
The 500 mb analysis indicated an anomalous deep full latitude trough at 7 PM on December 22nd, became negatively tilted by 7 AM as potent short wave energy rounded the trough base and deepened the system at all levels. The strong and negatively tilted mid/upper level trough, enhanced deep layer conveyor belt of warm moist air into our forecast area on strong southerly flow of 70 to 90 knots, resulting in areas of moderate to heavy rainfall. When a system is this deep and closed off at all levels, movement is generally slow and impacts can linger for several days, as occurred with the lake effect snow.
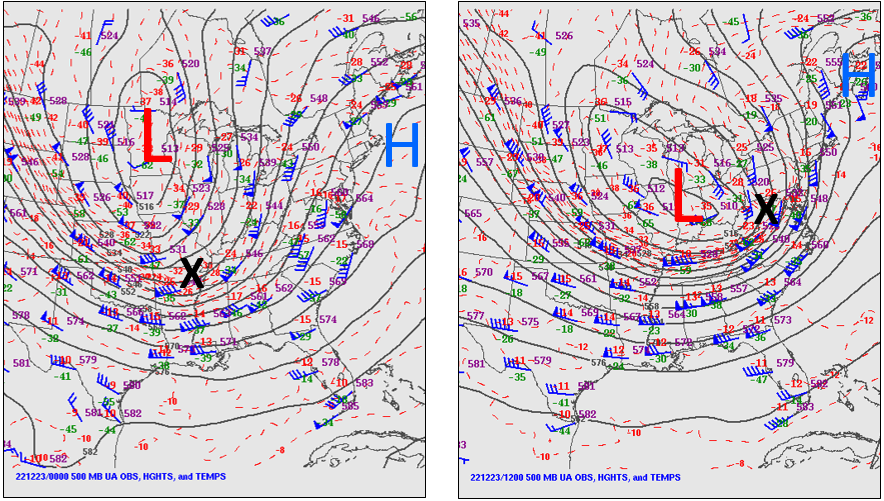
Figure 4: The Storm Prediction Center 500 mb (left) upper air analysis on 22 December 2022 at 7 PM and 7 AM (right) on 23 December 2022. Wind barbs, (plotted in blue, 1 pennant=50 knots, 1 barb=10 knots, 1/2 barb=5 knots), 500 mb heights (black lines), and temperatures (dotted red). X indicates vorticity maximum.[click to enlarge]
The High Resolution Ensemble Forecast (HREF) showed a very impressive southeast 850 mb jet of 100 to 110 knots lifting across central and northern Green Mountains on the morning of December 23rd. This jet coincided with the observed 130 mph wind gust atop Mount Mansfield (~4500 feet in elevation) during this time frame. In addition, note the widespread 70 to 100 knot (purple-pink shaded color) 850 mb wind field progged by the HREF in Figure 5 below, highlighting the potential for widespread damaging winds impacting most of Vermont into parts of northern New York.
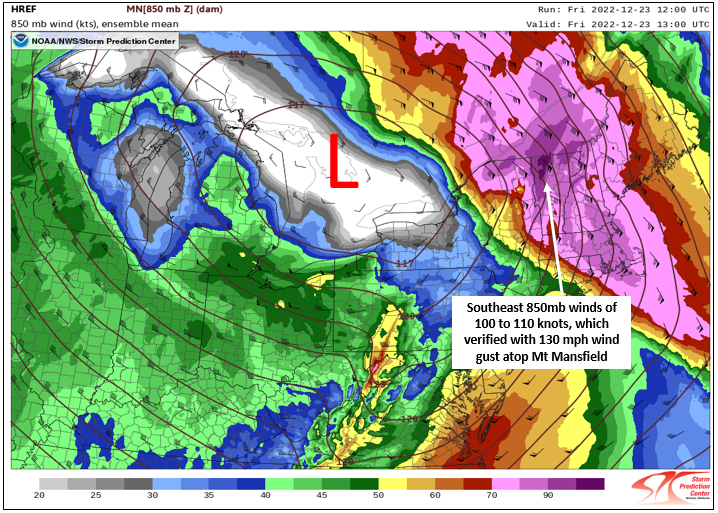
Figure 5: Storm Prediction Center imagery of High Resolution Ensemble Forecast (HREF) initialized on 23 December at 7 AM, valid for 8 AM on 23 December 2022.[click to enlarge]
Another helpful way forecasters examine wind fields and potential mixing of stronger winds aloft is by analyzing model forecast soundings at selection locations across the region. Figure 6 below is a model forecast sounding at Burlington from the RAP valid at 8 AM on 23 December 2022, just 30 minutes prior to the highest wind gust observed. When determining potential mixing, the height of the inversion in relation to the mountain summits is critically important, along with the speeds and direction of the low level jet in determining the magnitude of potential surface wind gusts. In this image below, the RAP predicted the height of the inversion near or just below the Green Mountains Summits (~3500 feet), while a core of very strong east-southeast winds of 70 to 90 knots was progged below this inversion. Cross barrier flow of very strong easterly winds of 70 to 90 knots at 1500 to 3000 feet above ground level, along with downslope warming, promoted favorable mixing conditions and observed surface wind gusts in the 50 to 70 mph range, especially for westward facing slopes. It was stated that several long term and very experienced forecasters had never seen such strong winds below the inversion height in model forecast soundings before, adding confidence to the historic nature of the strong winds.
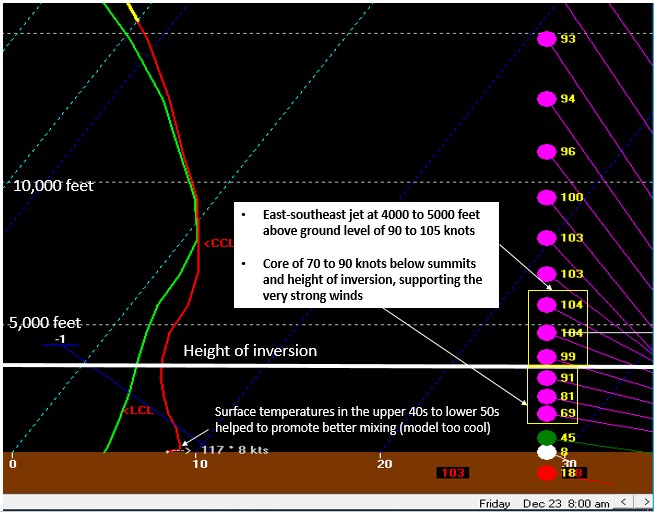
Figure 6: RAP forecast sounding at Burlington, Vermont initialized at 4 AM on 23 December 2022, valid at 8 AM.[click to enlarge]
Figure 7 below is a close up of the KCXX 1.3° velocity loop from 813 AM to 959 AM on 23 December. The brighter purple-pink colors indicated inbound winds (air moving toward the radar) of 90 to 105 knots across the central-northern Green Mountains of Vermont with small fingers of enhanced winds of 60 to 80 knots just above the surface propagating off the mountains toward the eastern Champlain Valley. These little finger couplets did travel across the Burlington area around 830 AM and produced an outbound velocity of similar values (yellow color) across Colchester Point toward the southern tip of South Hero during the morning hours on December 23rd. Finally, in the loop you can notice the magnitude of the strong low level wind fields decreased toward 10 AM, as the areal coverage of inbound velocities of 90 to 100 knots decreases.
Figure 7: KCXX 1.3° velocity loop from 813 AM to 959 AM on 23 December 2022.[click to enlarge]
In this section we continue to examine the impressive low level velocity data from the KCXX radar. This 0.9° velocity image at 823 AM, highlights an area of 90 to 110 knot inbound winds (white circle) near summit level of 3500 to 4000 feet above ground level (AGL), while “fingers†of enhanced inbound winds of 60 to 80 knots at 600 to 900 feet (AGL) can be seen on the image below (red circles). It was 6 minutes later that Burlington International Airport recorded a 71 mph wind gust, its 2nd highest ever and Mt Mansfield gusted to 130 mph. The period of very strong winds only persisted for 2 to 3 hours, before quickly shifting north of the International Border. However, plenty of damage was done with widespread power outages and numerous reports of trees blocking area roads. A secondary period of gusty winds occurred over northern New York during the afternoon hours associated with the sharp cold front, which saw Malone gust to 61 mph. As the flow shifted to the southwest behind the cold front, very gusty winds and heavy lake effect snow impacted the St. Lawrence Valley, where Potsdam observed a gust to 59 mph during the evening hours.
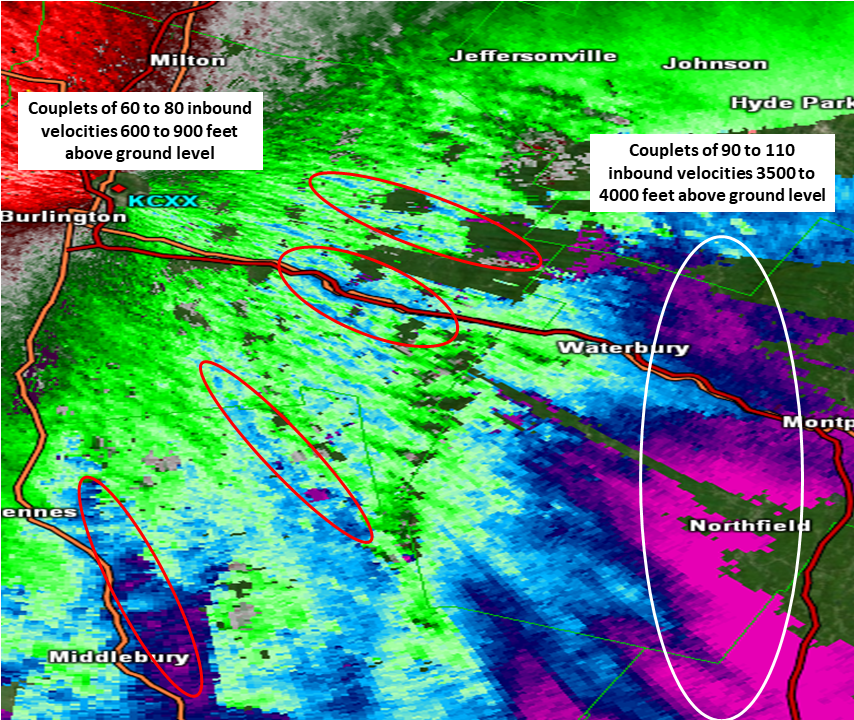
Figure 8: KCXX 0.9° velocity on 23 December 2022 at 823 AM.[click to enlarge]
Section 3: Flash Freeze
The next aspect of this powerful winter storm we are going to examine is the flash freeze, which occurred during the late afternoon and early evening hours on December 23rd. Snowmelt and widespread rainfall were expected to lead to water on roadways, despite the strong winds, as a strong cold front swiftly advected below freezing air back into the region. Unseasonably warm temperatures were observed, with the broader valleys warming well into the 50s underneath partial clearing ahead of a strong cold front. The cold front translated east during the afternoon, with 3 hour temperature drops between 15 and 20°F observed in RAP mesoanalysis (Figure 9), such that temperatures would fall below freezing in a roughly 4-hour time span from the frontal passage. For example, the Burlington ASOS experienced its 3rd highest temperature drop of 34 degrees in a 6 hour period for the meteorological winter season (December-January-February) for this event (Figure 10). Precipitation quickly transitioned into snow before temperatures fell below freezing as mid-level cooling along the frontal occlusion outpaced cooling at the surface. These conditions were of particular concern given the potential for elevated travel during the holiday weekend, and forecast messaging discouraged travel for the evening of December 23rd. Nevertheless, this sharp fall in temperatures was not as pronounced as parts of the Midwest that experienced a 40°F drop in under an hour. For example, BTV first fell from 55 to 34°F and stabilized for roughly an hour before resuming its fall. This pause to cooling, and forecast messaging that discouraged travel likely helped reduce the initial impacts of the flash freeze component.
Figure 9: SPC mesoanalysis of 3 hour temperature change (black contour, blue or red shaded) and surface winds from 10 AM to 7 PM on 23 December 2022.[click to enlarge]
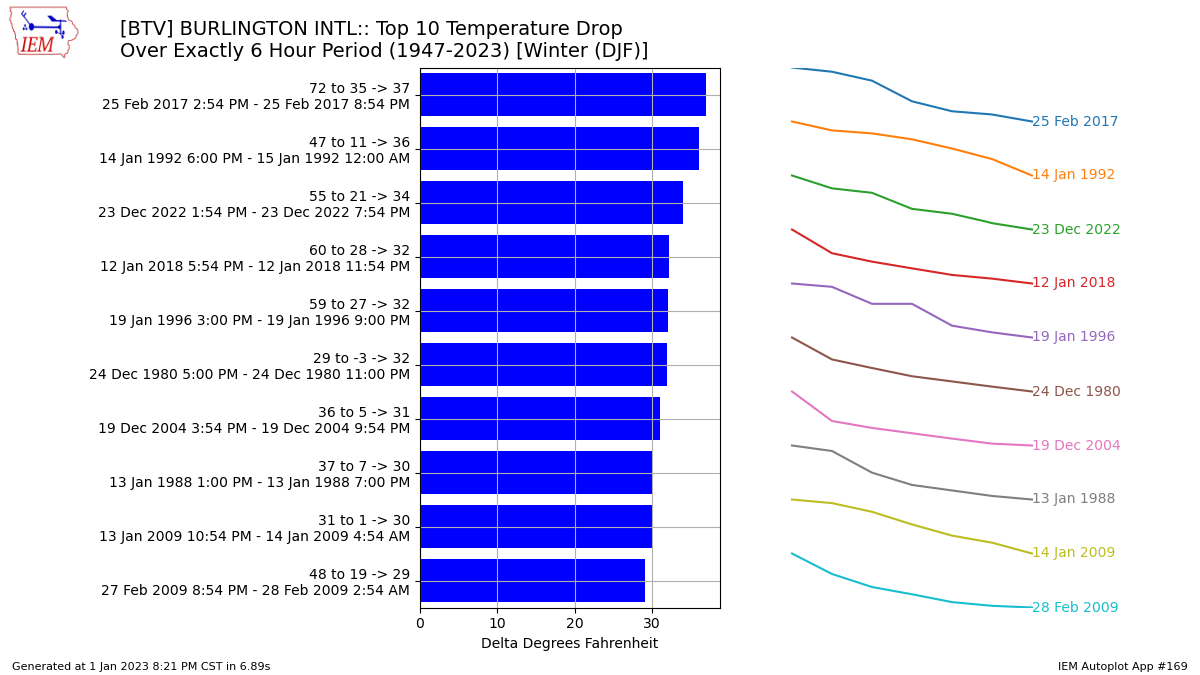
Figure 10: The top 10 temperature drops observed during meteorological winter (December, January, and February) for Burlington, Vermont within a 6 hour period (1947-2023). December 23rd, 2022 ranked 3rd. The bar chart on the left graphically depicts that delta T observed over the 6-hour period. The line graph on the right shows the character of the temperature drop over the 6-hour period. [click to enlarge]
Section 4: Short Period of Heavy Snow in Northern Vermont
One of the more challenging aspects of the forecast was the timing of when precipitation would exit the area. As temperatures were making a rapid decline, precipitation blossomed over the region, and heavy snow began to fall across much of Vermont late on December 23rd. This was the result of a concentrated area of pressure falls that took place across the area that produced strong surface convergence over the area coupled with an area of upper divergence (Figure 11). This provided an area of concentrated ascent over northern New York.
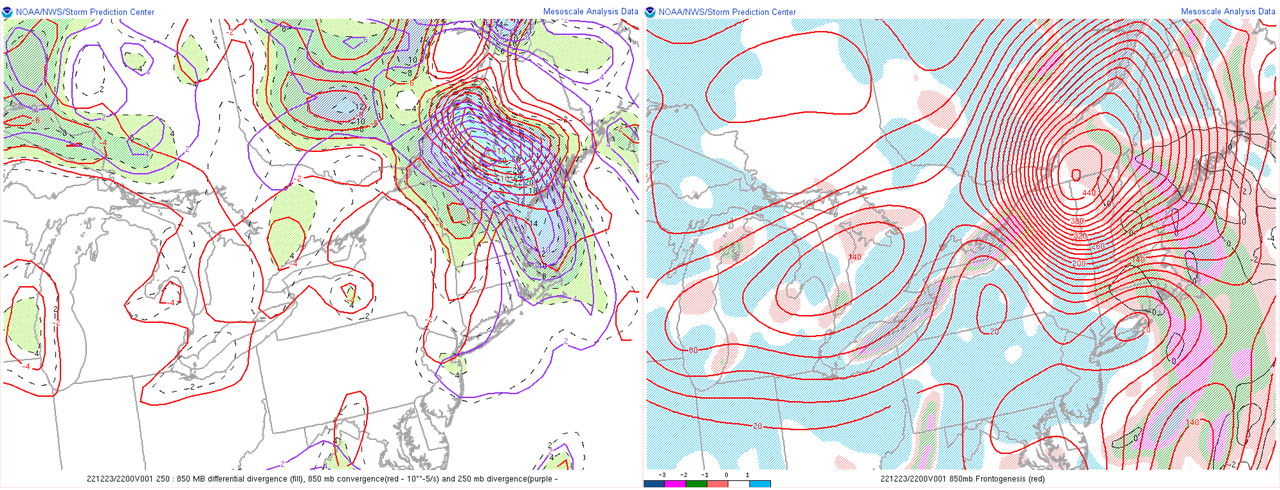
Figure 11: RAP mesoanalysis of 850mb convergence, in red contours, and 250mb upper divergence, in purple contours at 5 PM on 23 December 2022. Shaded areas with hatching indicate overlap. Green shading indicates some overlap, and blue to white shading indicates the more intense overlap.[click to enlarge]
Figure 12 below is the Multiple Radar Multiple Sensor (MRMS) winter precipitation type radar loop from 5:50 PM to 9:50 PM on the evening of December 23rd showing the rapid change of rain to snow associated with the secondary burst of precipitation that occurred coincident with the flash freeze from the eastern Adirondacks into most of central and northern Vermont. In addition, toward the end of the loop one can clearly see how the lake effect snow is developing across the St Lawrence Valley with some darker blue shading, indicating heavier bands of snow. Snowfall was brief, yet in that four hour span, 2 to 6 inches of snow fell in sections of northern Vermont during the timeframe, adding onto the icy roadways (Figure 13). This culminated in dangerous travel on December 24th.
Figure 12: Global Systems Laboratory loop of Multiple Radar Multiple Sensor (MRMS) winter precipitation type reflectivity between 5:50 PM and 9:50 PM on 23 December 2022. Green colors indicate where the radar is suggesting rain, while blue colors indicate snow. [click to enlarge]
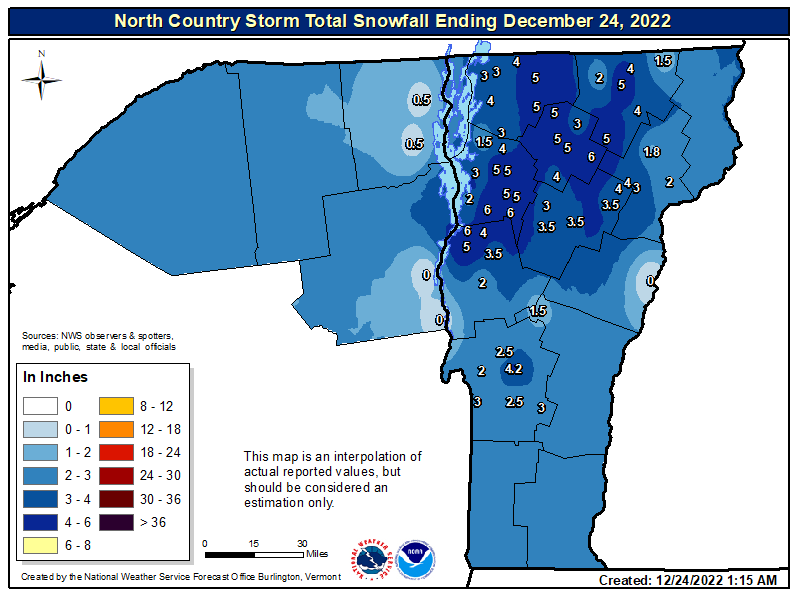
Figure 13: Reported snowfall (inches) behind the cold front late December 23rd into early December 24th. 2 to 6 inches of snow fell in a three hour period across northern Vermont in the wake of the flash freeze, adding to icy road conditions. [click to enlarge]
Section 5: Lake Effect Snow and Blizzard
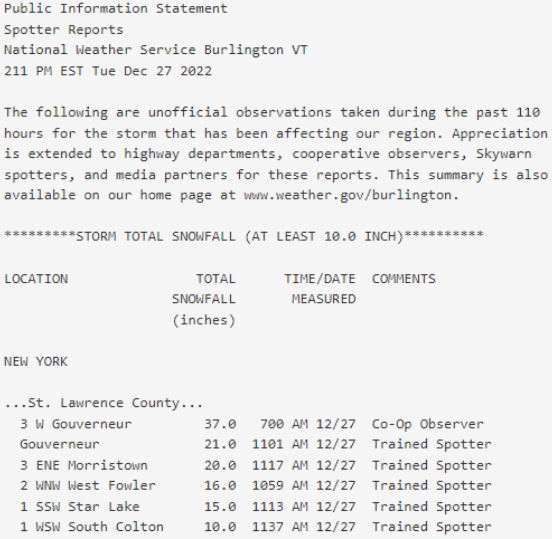
Figure 14: A public information statement generated by NWS Burlington with the highest snowfall reports from the lake effect snow event in St. Lawrence County from December 23rd through December 27th.[click to enlarge]
This storm included the first Blizzard Warning that the National Weather Service Burlington, Vermont had issued in 2108 days, which was the 2017 Pi Day storm. To meet blizzard criteria, wind speeds or frequent gusts exceeding 35 mph and visibilities less than ¼ mile must be met in conjunction with heavy snow. Yet it is not enough to meet it for a few minutes. The criteria must prevail for 3 hours within an event.
While precipitation wrapped up across Vermont, outside some brief snow showers, cold temperatures aloft and unidirectional flow produced blizzard conditions within lake effect streamers, and would result in the historic deadly blizzard in Buffalo, New York. While the fetch over Lake Ontario was less extreme compared to Lake Erie, the channeling effect of the St Lawrence River Valley led to persistent 40-50 mph wind gusts, which along with intense lake effect snowfall, led to widespread and prolonged blizzard conditions. The area of Gouverneur, New York experienced the most snow, with localized totals near 3 feet of snow when lake effect snow finally ended (Figure 14). We did hoist a Blizzard Warning across southwestern St. Lawrence County including Ogdensburg, Potsdam and Gouverneur, which likely verified with Ogdensburg and Massena observing these conditions for many hours (Figure 15). Though we did not issue a Blizzard Warning across northern St. Lawrence County, we emphasized the possibility of localized blizzard conditions with the 50 mph winds in the Lake Effect Snow Warning.
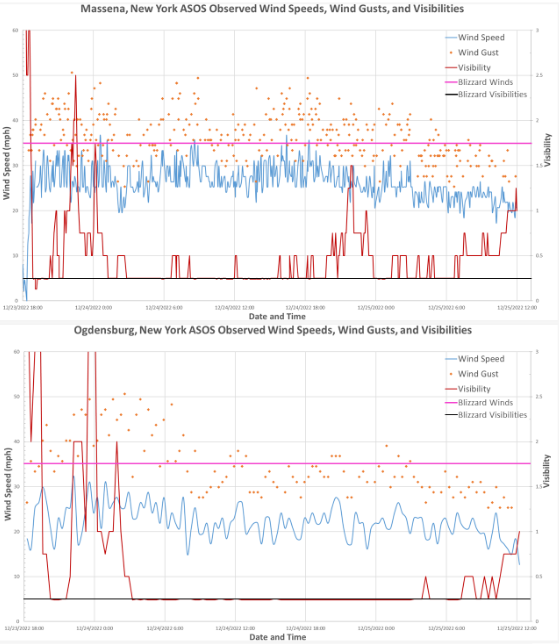
Figure 15: Top) Charted ASOS observations at KMSS from 1 PM on 23 December 2022 through about 7 AM on 25 December 2022. The blue line indicates wind speeds (mph) over time, and the orange dots represent wind gusts (mph). These are tied to the primary axis to the left. The red line indicates visibility (miles) over time, and is placed on the secondary axis to the right. A bright pink line at 35 mph marks the threshold for blizzard wind conditions. The area under a black line represents blizzard visibility conditions. Data accessed via Iowa Environmental Mesonet (IEM). Visibilities of M1/4SM were marked as 0.24 due to a lack of clarity in the exact value. These are still visible below the black line.[click to enlarge]
Section 5: Wind Chills
While the combination of winds and lake effect snow created blizzard conditions near the St. Lawrence River, outside of that lake effect snow, winds were still quite strong across the region. As low temperatures fell into the 10s, wind speeds remained elevated, with frequent gusts up to 30 to 40 mph continuing across much of the North Country. Wind chill values between 5 and 20 below zero (Fahrenheit) were widely reported throughout Vermont and northern New York on December 24th (Figure 16). Despite not reaching the wind chill advisory threshold of -20°F for our region, the fact much of the region remained without power caused these low wind chills to be of some concern. The combination of winds and cold would hinder the recovery effort. This was incorporated into forecast messaging in support of decision making for warming shelters.
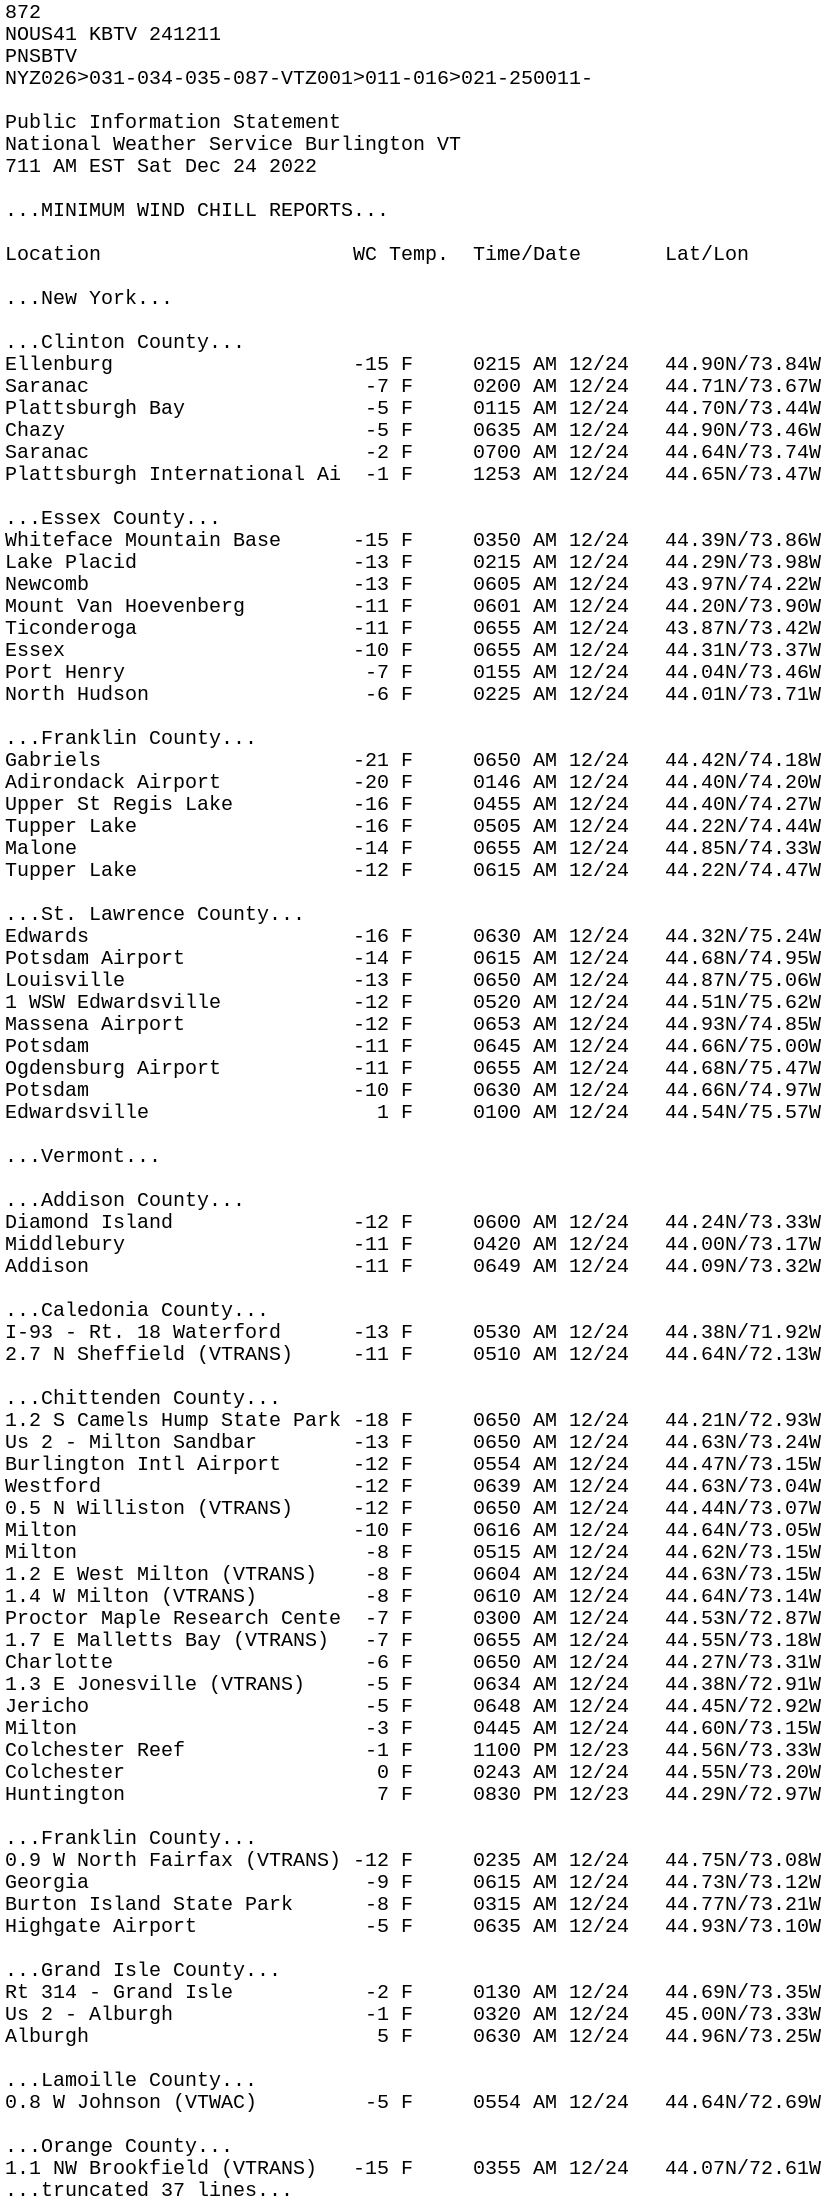
Figure 16: Sample of coldest wind chills observed 24 December 2022 across parts of Vermont and northern New York [click to enlarge]
Section 6: River Flooding and the Ice Jam on the Raquette River
The combination of rain and snowmelt contributions led to runoff that resulted in minor flooding across main stem rivers like the Mad River at Moretown and the Barton River at Coventry, as well as others like the Browns River in Essex, Vermont between December 24th and 25th. Several other reports of water on roads or overflowing banks were received, notably along Belvidere Pond, Mud Creek, and Lake Dunmore. Locally heavy rain, and even thunderstorms, prompted issuance of a flood warning for parts of Rutland and Windsor County as well, which received doppler estimates of 1.50†to 2.50†of rainfall on December 23rd. Across December 23rd and 24th, a widespread 0.75†to 1.75†was observed. Locally higher totals were observed in the favored eastern slopes of the Adirondacks and Greens, as well as sections of eastern Vermont, where around 2.75†of rainfall was reported (Figure 17).
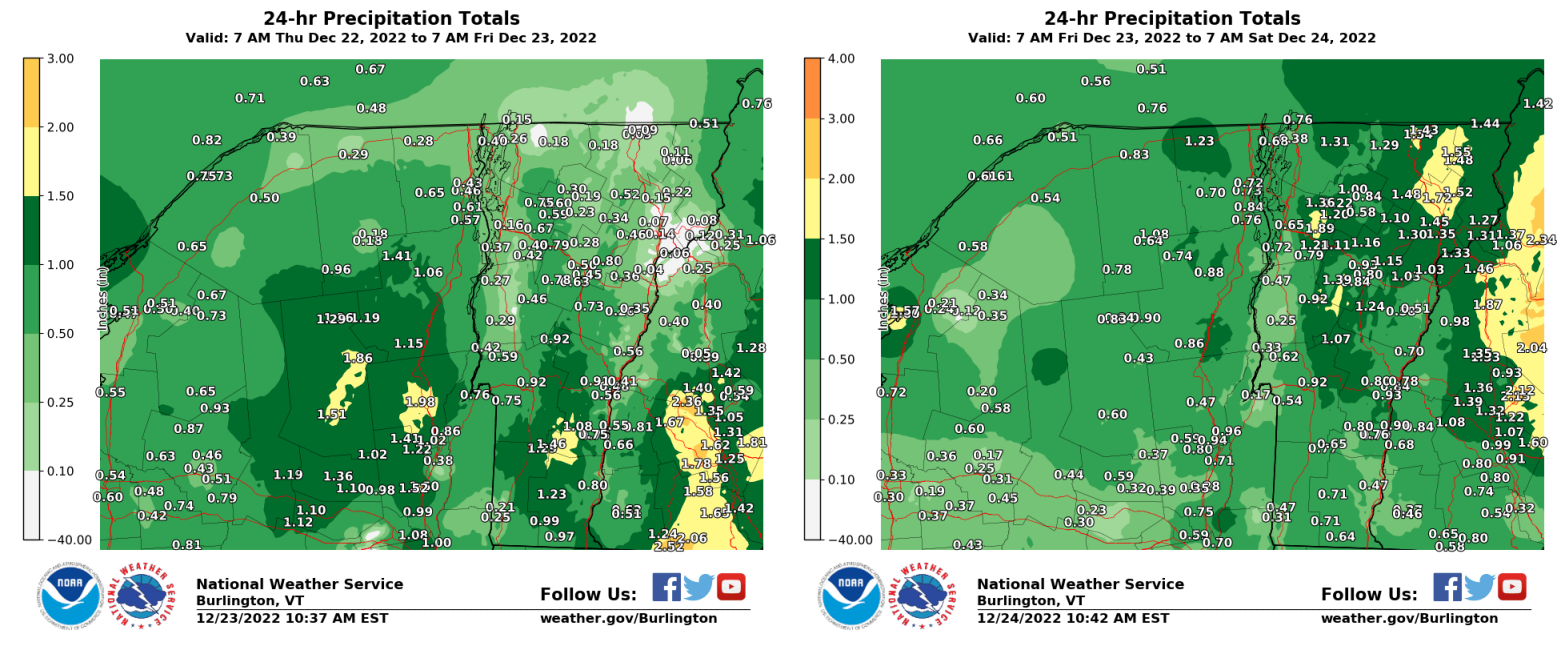
Figure 17: Two daily climate maps of precipitation issued from NWS Burlington. Left) Precipitation observed between 7 AM December 22nd and 7 AM December 23rd, 2022. Right) Precipitation observed between 7 AM December 23rd and 7 AM December 24th, 2022.[click to enlarge]
Impacts from river flooding were relatively short-lived and mainly impacted secondary road networks. However, during December 25th, an ice jam occurred on the Raquette River, near Pierrepont, New York that resulted in the evacuation of a few homes and businesses. After speaking with the town manager, we learned of impounded water and ice behind the Hannawa Falls Dam. This likely helped to further slow the flow upstream, allowing the ice jam to develop and water to overflow its banks.
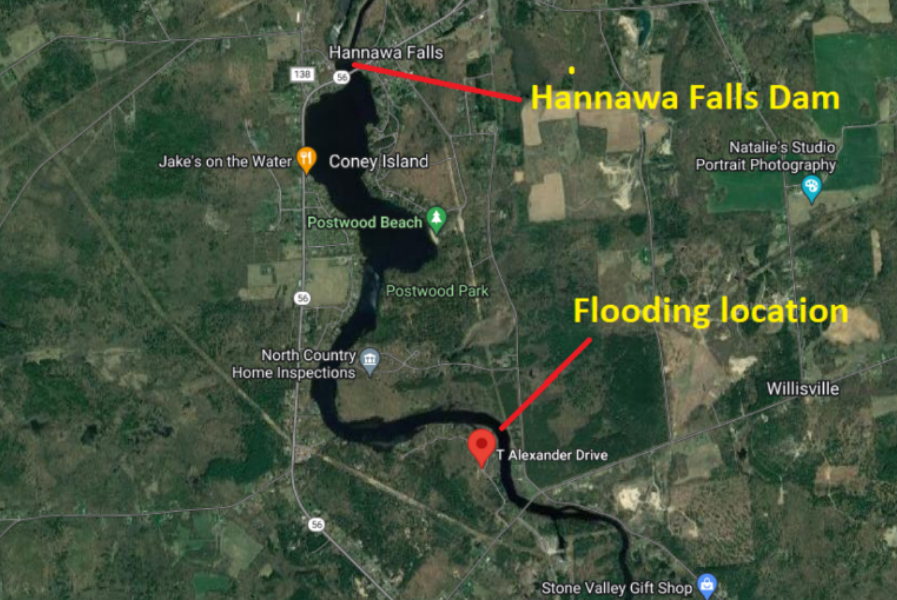
Figure 18: Site of a localized ice jam flooding on Christmas Day 2022 in Pierrepoint, NY. The ice jam was a result of the ice flow releases not being timed correctly at Hannawa Falls Dam.[click to enlarge]
Typically ice flows downstream into the reservoir and backs up when releases from Brookfield Power aren’t timed correctly during higher flows, which was the case here. Even though this was not a typical freeze up jam, four homes were flooded to the first floor with associated basement flooding. Homeowners were evacuated temporarily for safety reasons.
Summary
A powerful low pressure system brought a myriad of weather hazards to our region betw1een 23-25 December 2022, including high winds, flash freeze, flooding and prolonged lake effect snow with blizzard conditions. The strength of the system and strong synoptic scale forcing at play resulted in hazardous - to at times - life threatening conditions. The event was well forecasted and communicated via weather headlines, decision support briefings, state-level emergency management conference calls, coordination with the Weather Prediction Center as well as social media. The greatest concern was the potential for widespread damaging winds over 60 to 70 mph, with the secondary concern of the resultant power outages compounded by flash freeze and bitterly cold wind chills during the height of Christmas travel. These hazards were well messaged through High Wind Warnings as well as timeline infographics (Figure 18). We also timed out the flash freeze and timing of the high winds as confidence in more specific timing increased. All these infographics were well received by emergency managers and the public. The lingering gusty winds, while falling below Advisory criteria, were also communicated in our DSS briefings as they slowed down the recovery and power restoration efforts for communities hit hard by the high winds. For the lake effect snow, when it became apparent that explosive cyclogenesis would result in prolonged blizzard and whiteout conditions across northern NY, NWS BTV issued its first blizzard warning since the Pi Day Storm of 2017 (a period of 2108 days). While paling in comparison to the deadly blizzard that unfolded in Buffalo, New York, St. Lawrence county experienced an unusually strong lake effect snow event off Lake Ontario, which included blizzard conditions for communities near and along the St. Lawrence River.
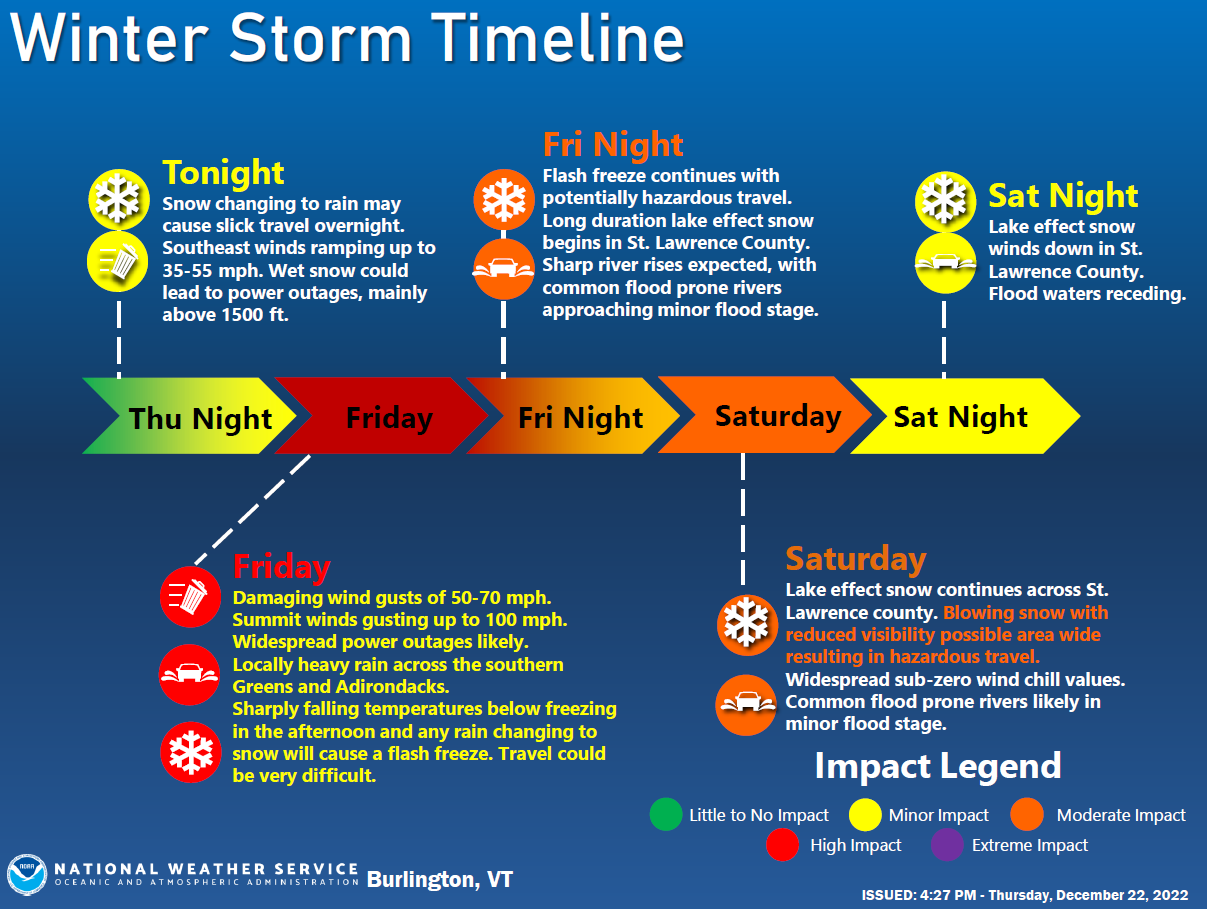
Figure 19: An infographic that we used on both DSS briefings and social media to communicate the myriad of hazards in this long duration high-end multi faceted event.[click to enlarge]
Overall, our team did a great job providing adequate attention to each of the aforementioned details, which can be quite challenging when one aspect of the weather’s impact increases vulnerability to future weather hazards. Any one of these hazards alone would not have been as serious, but given how things like strong winds knocking out power and then cold wind chills can be connected, it is important to put all of these into a coherent message to the public. Our messaging was intentionally stronger than usual for this event because of these concerns.
To list out some of the events that took place, strong winds and heavy rain took place Friday morning and early afternoon on December 23rd. Numerous power outages occurred throughout the state. Unfortunately, a fatality from a falling tree took place. Heavy rain and snowmelt produced relatively minor river flood impacts, but along with a surprise bout of snow, created dangerous icy travel. Vermont State Police, via Twitter, reported 73 weather-related accidents and 21 injuries Friday through Sunday due to the slick road conditions. Cold conditions behind the system and continued strong winds produced single digit to teens below zero for wind chills after knocking out power for so many. Across Vermont alone, Vermont Emergency Management in their January newsletter release estimated $2 million in damage. Strong winds also contributed to dangerous blizzard conditions in the St. Lawrence Valley as lake effect snow produced locally up to 2 to 3 feet of snow over southern St. Lawrence County between December 23rd and December 27th. Strong winds and cold air temperatures likely helped to produce the freeze up jam along the Raquette River that required the evacuation of four homes and businesses in these very cold conditions. Through all this, we’re thankful to all who helped keep the region safe during this weather event, and thank you for reading.
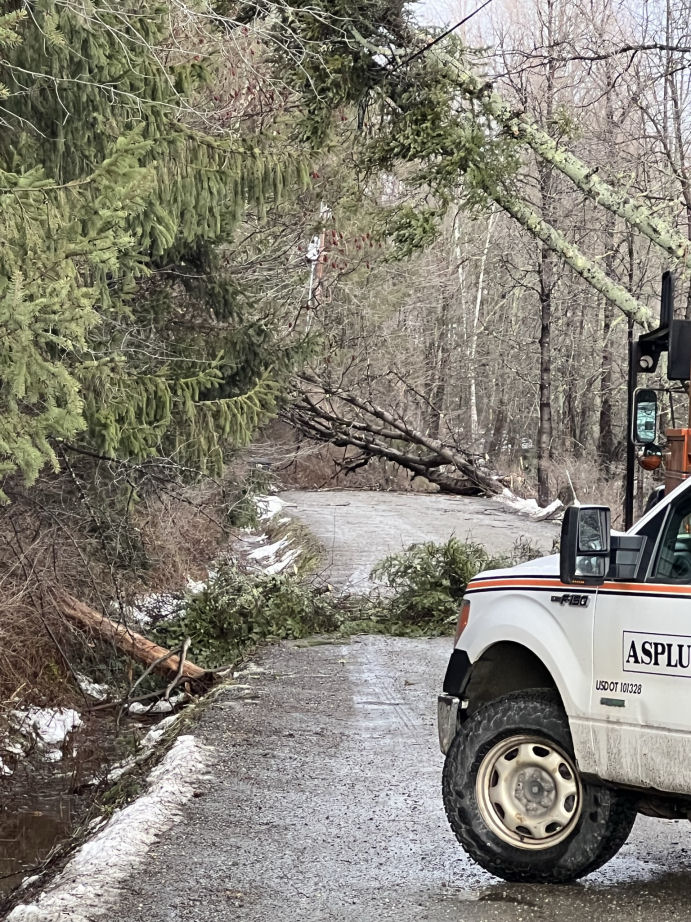
Figure 20: Photo Report on Gregg Hill Rd with multiple trees down, and one on a powerline. Submitted by Skywarn Spotter, Dave McGuriman.[click to enlarge]
References:
Figure 6: Visualized through BUFKIT: NWS\OCLO Warning Decision Training Division: BUFKIT (weather.gov)
For Figure 10 and 14: ASOS data for KBTV, KMSS, and KOGS accessed via Iowa State University’s Iowa Environmental Mesonet page, which collects and archives data via Unidata IDD, NCEI ISD, and MADIS One Minute ASOS.
Radar imagery for Figures 7 and 8 was generated using GR2Analyst, Gibson Ridge Software Company http://www.grlevelx.com/gr2analyst_2/
VEM Jan 2023 Newsletter: https://vem.vermont.gov/contact-us/newsletter/january23
Accident statistics for the event retrieved via Vermont State Police’s Twitter account: https://twitter.com/VTStatePolice/status/1607818251102261248
A special thanks to Peter Banacos, SOO of NWS Burlington, for review and comments.

