 Email the authors
Introduction:
On 17 May 2025 several rounds of strong to severe thunderstorms produced large hail, isolated damaging winds, and localized flash flooding across parts of northern New York and Vermont. The Storm Prediction Center (SPC) placed our entire forecast area under a Severe Thunderstorm Watch from 12:35 PM to 8:00 PM EDT, indicating conditions were favorable for several rounds of severe thunderstorms. The pre-storm environment was characterized by moderately strong instability and favorable deep layer shear, ahead of an approaching potent shortwave trough. This favorable pre-storm environment and large-scale synoptic ascent, supported organized convection with a mix of bowing line segments and localized supercells as the primary convective modes. Hail up to 2 inches in diameter was observed near Richmond, Vermont. This was the largest hail to fall across our forecast area since 2.0 inch diameter hail was observed in Massena, NY on 1 October 2019. Meanwhile, strong thunderstorm winds knocked a silo over near St. George. Fallen trees on powerlines caused over 4,000 customers to lose power in Vermont. In addition, localized very heavy rainfall rates produced flash flooding in the Cambridge, Waitsfield, Killington, and Hartford, Vermont areas during this event. The Weather Prediction Center (WPC) issued a Mesoscale Precipitation Discussion highlighting possible flash flooding with rainfall rates of 1 to 2 inches in 60 minutes or less.
Pre-Storm Environment:

Figure 1: Storm Prediction Center (SPC) day 1 categorical convective outlook (left image), wind probability outlook (middle image), and hail probability outlook (right image) issued at 12:30 PM on 17 May 2025 and preliminary storm reports (blue circles for wind and green for hail) valid 12:30 PM on 17 May to 8 AM on 18 May 2025.[click to enlarge]
Figure 1 shows the Day 1 Categorical Outlook from the SPC issued at 12:30 PM 17 May 2025, with the wind and hail probability outlooks and preliminary storm reports valid from 12:30 PM on May 17th to 8 AM on 18 May 2025. The blue dots indicate severe thunderstorm wind damage, while the green dots show areas where severe hail (≥1 inch in diameter) was observed. The black triangle (left image) is associated with significant hail of 2 inches in diameter hail near Richmond, VT. The convective outlook highlighted northern New York into all of Vermont with a slight risk, with wind and hail being the primary severe weather hazard. From SPC, a slight risk implies well-organized severe thunderstorms are expected, but in small numbers and/or low coverage. Depending on the size of the area, approximately 5-25 reports of 1 inch or larger diameter hail, and/or 5-25 wind events, and/or 1-5 tornadoes would be possible. The probabilistic wind and hail from SPC indicated a 15% chance of severe thunderstorm wind and hail within 25 miles of a given point during the outlook period.

Figure 2: The 500mb (~20,000 feet above ground level) upper air analysis on 17 May 2025 at 8 AM EDT. Wind barbs, (plotted in blue, 1 pennant = 50 knots, 1 barb = 10 knots, 1/2 barb = 5 knots), 500mb heights (black lines), and temperatures (dotted red).[click to enlarge]
The 500 mb (~20,000 feet above ground level) upper air analysis on 17 May 2025 showed (Figure 2 above) an anomalous deep mid-level trough across the central Great Lakes, with a ribbon of enhanced winds greater than 50 knots translating from the Ohio Valley into the Mid-Atlantic states. The tightening of the black height contours in the image above over the Ohio Valley, is typically a good indication of strong mid-level wind fields. This shortwave trough, good upper-level divergence, and mid-level wind speed maximum, helped to produce large-scale ascent for thunderstorm development, while the strong winds aloft aided in favorable shear parameters for organized thunderstorms, with damaging winds and large hail representing the primary severe weather threat.
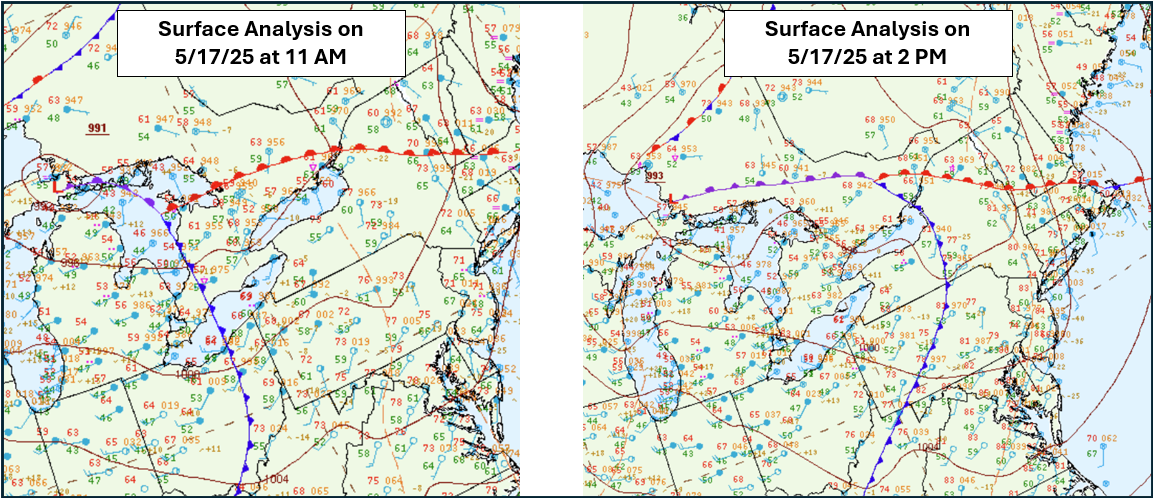
Figure 3: Surface analysis with fronts and stations plots on 17 May 2025 at 11 AM (left) and 2 PM (right).[click to enlarge]
Convection was ongoing during the morning hours of 17 May 2025. The first strong thunderstorm prior to 8 AM in northern New York was associated with a surface warm front and elevated instability. While these thunderstorms were rooted above the local boundary layer, good storm structure was observed, consistent with large-scale height falls, elevated instability, and effective shear of 30 to 35 knots. These factors supported tall updrafts and hail reaching near-severe thresholds. After the early morning convection, southerly winds allowed for modest surface-based destabilization with a brief break in cloud cover across portions of Vermont. This brief break allowed for insolational heating and 2-meter temperatures warmed into the mid 70s to lower 80s. Dewpoints hovered in the lower to mid 60s.
Mid-day surface analyses (Figure 3) placed a moderately strong 991 mb low pressure over the Upper Peninsula of Michigan, while a cold front was slicing through the eastern Great Lakes and eastern Ohio Valley and a warm front was draped over northern New York into southern Vermont at 11 AM on May 17th. Meanwhile, by 2 PM a triple point had developed just west of the St Lawrence Valley, while the warm front was lifting north into central Vermont and a cold front was approaching our region from the west. Middlebury was 77 degrees with a dewpoint of 62, with areas of convection associated with both the surface cold front and warm front impacting our region. These surface features, combined with significant height falls associated with an approaching strong shortwave trough and cold pool aloft, created an environment favorable for multiple rounds of strong to severe convection producing localized heavy rainfall.
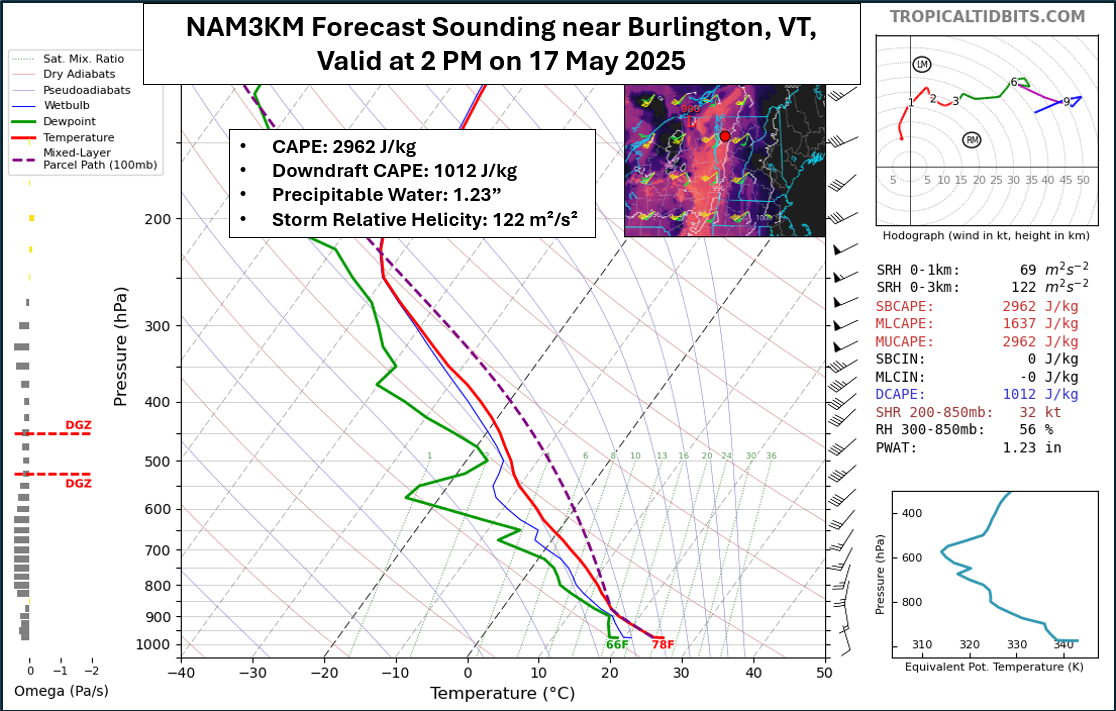
Figure 4: The NAM-3km upper air forecast sounding near Burlington, VT, initialized on 17 May 2025 at 8 AM, valid for 2 PM on 17 May 2025.[click to enlarge]
Figure 4 above shows the NAM-3km upper air forecast sounding near Burlington, VT, initialized on 17 May 2025 at 8 AM, valid for 2 PM on the 17th. This sounding showed a progged surface temperature of 78°F and dewpoint of 66°F, which was a little too high based on surface data and resulted in forecast CAPE values by this model run being 400 to 800 J/kg too high. As surface temperatures began to warm, cold air aloft had already begun to filter into the region which allowed for increased mid-level lapse rates. The combination of surface heating and steepening lapse rates allowed for widespread 1500-2000 J/kg of surface-based CAPE to develop with favorable deep layer shear between 30 and 40 knots. The deep layer shear was mostly driven off stronger wind fields in the 700-mb to 500-mb layer, as winds closer to the surface were under 20 knots, per the progged NAM-3km sounding data. In addition, the progged sounding indicated Downdraft CAPE (DCAPE) values of ~1000 J/kg, which suggested the potential for damaging winds. From the SPC mesoanalysis website: “DCAPE (Downdraft CAPE) can be used to estimate the potential strength of rain-cooled downdrafts within deep convection, and is similar to CAPE. Larger DCAPE values are associated with stronger downdrafts and greater potential for damaging thunderstorm winds."
The moderate CAPE profile and high equilibrium levels indicated thunderstorms would extend 45,000 to 50,000 feet into the atmosphere, and be capable of producing severe winds, large hail, and localized heavy rainfall. The equilibrium level (EL) is the level at which the rising parcel equals the actual air temperature at that given height, and results in the rising parcel now becoming stable; it no longer accelerates upward. The higher the EL the taller the potential thunderstorm and greater potential for severe weather and very heavy rainfall rates.
Also, progged precipitable water values of 1.2" to 1.4" supported the potential for localized heavy rainfall and flash flooding. Precipitable water (PW) is the depth of the amount of water in a column of the atmosphere if all the water vapor in that column were precipitated out as rain. High PW values support a greater potential for heavy rainfall.

Figure 5: Storm Prediction Center (SPC) RAP-based mesoanalysis image showing the most unstable Convective Available Potential Energy (MUCAPE, red contours), Convective Inhibition (CIN, blue dash lines shaded at -25 and -100 J/kg) and surface to 6-km effective bulk shear (in knots, with plotting convention as in Figure 2) on 17 May 2025 at 18 UTC (2 PM EDT).[click to enlarge]
Figure 5 shows the Rapid Refresh (RAP) based mesoanalysis of most unstable CAPE (Convective Available Potential Energy), CIN (Convective Inhibition) and surface to 6 km effective bulk shear from SPC on 17 May 2025 at 2 PM. As the mid-level jet approached the region the deep-layer shear increased to between 30 and 40 knots, while CAPE values ranged from 1500 to 2000 J/kg. The best combination of deep layer shear and instability (i.e., CAPE) was co-located across eastern New York into central-southern Vermont, and closely matches the region of greatest concentration of wind damage and severe hail. This moderate deep-layer shear and CAPE pre-storm environment was conducive for organized and persistent convection to develop, capable of producing damaging winds and hail associated with bowing line segments and supercell storm structures. Note that much less instability and greater CIN was observed over the southern New England Coastal region associated with marine modified air.
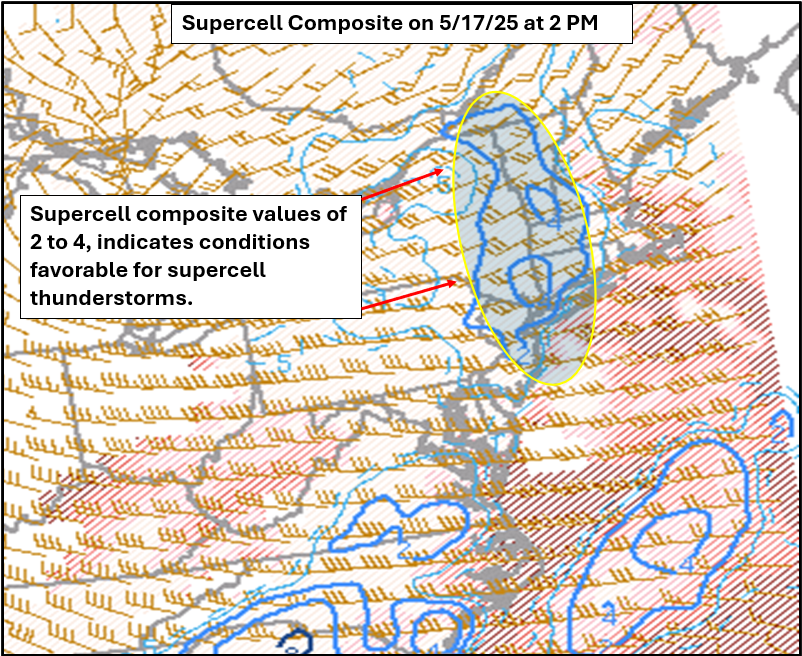
Figure 6: Storm Prediction Center (SPC) (RAP) Rapid Refresh Supercell Composite Parameter (SCP, blue contours)), most unstable Convective Inhibition (CIN) (red lines) and Bunkers storm motion (brown barbs, with plotting convention as in Fig. 2) on 17 May 2025 at 18 UTC (2 PM EDT).[click to enlarge]
Figure 6 above shows the SPC Mesoanalysis Supercell Composite Parameter (SCP), most unstable CIN and Bunkers storm motion at 2 PM on May 17th. The SCP values between 2 and 4 across the Champlain Valley, highlighted the area where the combination of instability and shear were favorable for potential right-moving supercells. From SPC the SCP is defined as, “A multiple ingredient, composite index that includes effective storm-relative helicity (ESRH, based on Bunker's right supercell motion), most unstable parcel CAPE (MUCAPE) and convective inhibition (MUCIN), and effective bulk wind difference (EBWD). Each ingredient is normalized to supercell 'threshold' values, and larger values of SCP denote greater 'overlap' in the three supercell ingredients. Only positive values of SCP are displayed, which correspond to environments favoring right-moving (cyclonic) supercells".
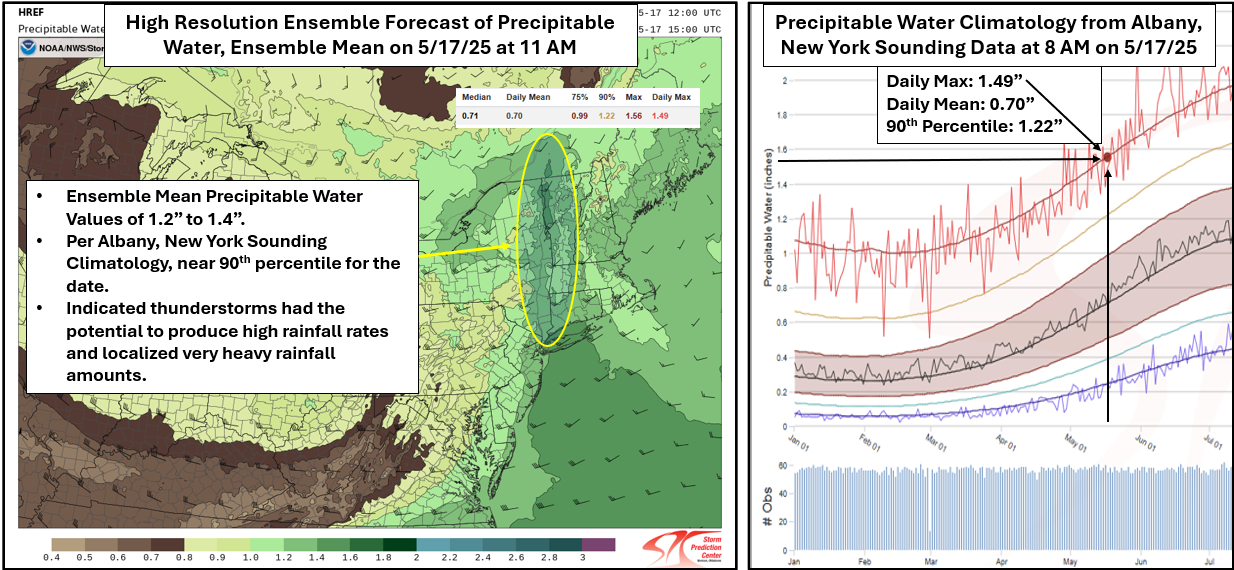
Figure 7: High Resolution Ensemble Forecast (HREF) of mean precipitable water (color filled), storm motion (knots) on 17 May 2025 at 11 AM (left image) and precipitable water climatology from Albany, NY sounding data at 8 AM on 17 May 2025. [click to enlarge]
The progged High Resolution Ensemble Forecast (HREF) mean of precipitable water (Figure 7) showed an axis of 1.2" to 1.4" across the Champlain Valley ahead of the approaching trough. This moisture, combined with favorable upper level divergence and synoptic scale ascent from the approaching trough, enhanced localized rainfall rates to cause areas of flash flooding. Per the Albany, New York sounding climatology, the 1.4" precipitable water value was near the 90th percentile for mid-May and less than a tenth of an inch from the daily maximum of 1.49" for May 17th. The impressive storm structures and associated vertical depth of 45 to 55 dBZ up to 45,000 feet, resulted in localized very heavy rainfall rates, which caused areas of flash flooding in the Waitsfield, Cambridge, Killington and Hartland areas during this event.
Figure 8: NAM-3km initialized at 12 UTC (8 AM EDT) on 17 May 2025 instantaneous precipitation rate (mm/hr), mean sea level pressure (MSLP) in hPa, and 1000 to 500 mb thickness (dam) loop from 9 AM to 8 PM EDT.[click to enlarge]
The NAM-3km instantaneous precipitation rate and mean sea-level pressure product initializing at 8 AM on 17 May 2025 did a good job highlighting the location and timing of the most robust convection. Figure 8 shows the NAM-3km instantaneous precipitation rate loop from 9 AM to 8 PM EDT on 17 May 2025. This model guidance progged a developing line of thunderstorms across the eastern Adirondacks into central Vermont, with more scattered activity over southern Vermont. The deeper red, pink and purple colors in the loop, indicated where the model progged convection would be the strongest and provided forecasters an idea of storm mode, location and potential severe threat. In addition, the progged deep convection by the NAM-3km also suggested very heavy rainfall would likely be associated with the convective storms.
Storm Analysis - Supercell from Saranac to Schulyer Falls
A supercell developed near Saranac, New York around 2:30 PM and tracked northeastward over Peasleeville, NY and Schuyler Falls, NY. The KCXX radar was able to sample wind speeds of 58 mph just above ground level (Figure 9). However, given that the storm was moving nearly perpendicular to the radar beam, it's likely that the velocity measurements by the radar were slightly underestimated. This supercell continued to track northeastward over Lake Champlain and produced additional wind damage in western Franklin County in Vermont. This supercell was not as tall as the supercell across Chittenden County, Vermont, which produced 2 inch diameter hail near Richmond.
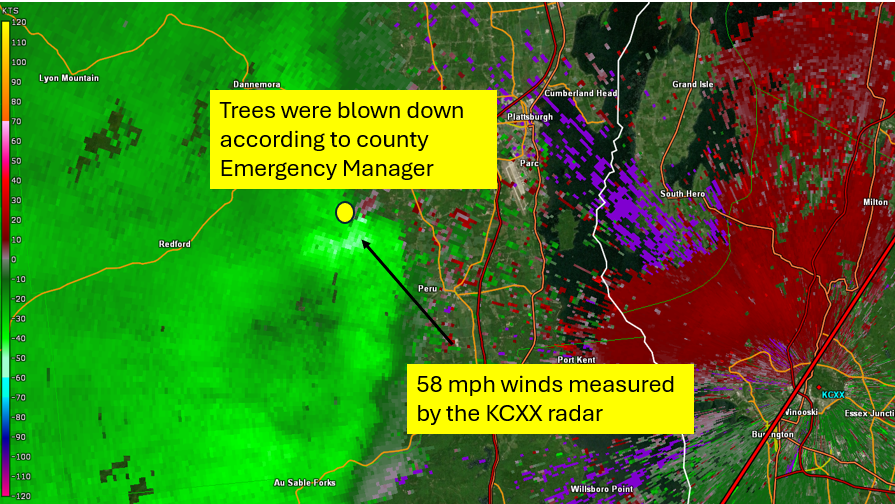
Figure 9: The Colchester, VT (KCXX) WSR-88D base (0.5°) velocity at 2:40 PM EDT on 17 May 2025. [click to enlarge]
Storm Analysis - Supercell from Westport to Morrisville
There was one storm that was particularly interesting on May 17th. A long-lived supercell produced a swath of wind damage and large hail extending from near Westport in eastern Essex County, NY, all the way to Morrisville in Lamoille County, VT, which covers 50 miles. Within this swath of storm damage and hail, numerous reports of large hail ranging from 1" to 2" in diameter were noted, with the largest hailstones falling in Charlotte, Richmond, and Stowe.
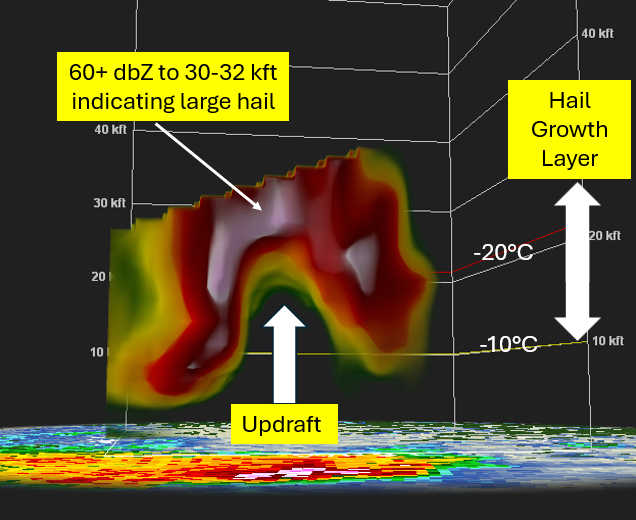
Figure 10: KCXX reflectivity cross section near Richmond, VT at 2:45 PM on 17 May 2025.[click to enlarge]
This supercell had all of the classic characteristics that one would expect with a deep mid-level mesocyclone, a bounded weak echo region (BWER) within the strong updraft, and an appendage of low reflectivities along the rear flank (Figure 10). A deeper look into the storm shows a persistent core of 60+ dBZ reflectivities coinciding within the -10 to -20 degree C threshold (Figure 11), indicating the development of severe hail. While radar data is unable to directly measure residence time for individual hailstones, the presence of a persistent 60+ dBZ core within the favorable hail growth region, indicates the potential for hail greater than 1 inch in diameter. There is no direct correlation to residence time and hail size but larger hail typically correlates to stronger updrafts (more residence time). The presence of a BWER is a known predictor of more significant hail, as the updraft becomes so strong that it evacuates air in the immediate vicinity, resulting in very little precipitation falling to the ground in the location of the BWER. The BWER also implies strong enough updrafts to suspend larger, heavier meteorological objects, such as large hailstones.
Figure 11: KCXX reflectivity cross section highlighting the 60 dBZ reflectivity core (white image) near Charlotte, VT, loop from 2:35 PM to 3:02 PM EDT on 17 May 2025. [click to enlarge]
Figure 11 is a loop from the KCXX radar showing the height of the 60 dBZ echoes from 2:35 PM to 3:02 PM EDT as the storm moved from Charlotte, VT, eastward toward Richmond, Vermont. In this loop, you can see the height of the 60 dBZ core extended well above the -10 degree C (yellow line) isotherm and the -20 degree C (red line) isotherm. When you see high reflectivities like this above the -20 degree C isotherm, it's a strong indication that hail is developing or present within a storm. In this case, the updraft was large enough for hailstones up to 2 inches in diameter!
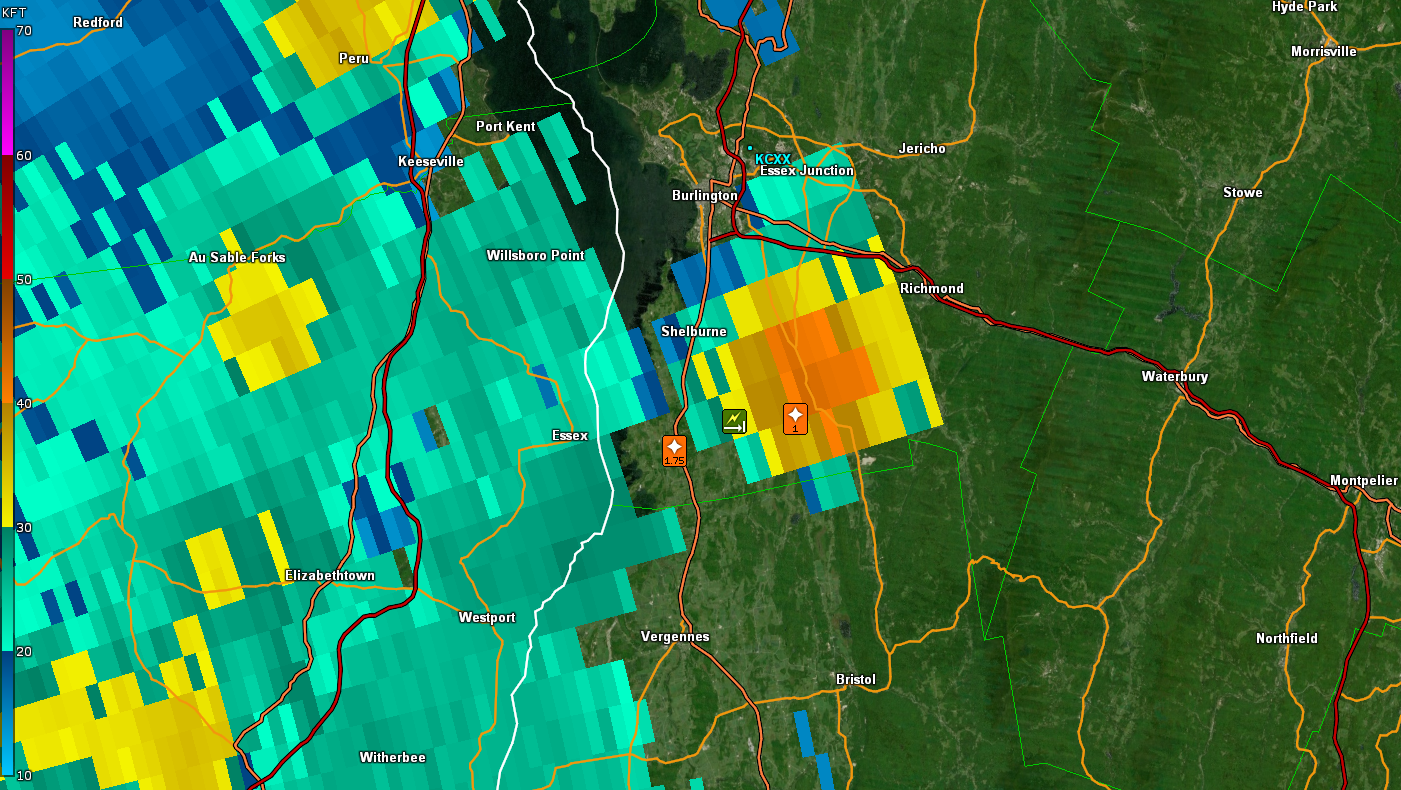
Figure 12: The KCXX Echo Top product (in kft) valid at 2:45 PM EDT on 17 May 2025.
Given the close proximity of the storm to the KCXX radar, we needed to use the KTYX radar in Montague, NY to supplement data in the upper levels of the storm. One product that was especially useful in this case was the echo tops (Figure 12). Echo tops are the highest altitude at which the radar is detecting precipitation-sized particles (i.e., ≥ 18 dBZ). In the case of the Charlotte/Richmond supercell, echo tops ranged from 45-50 kft which is well above the EL shown in the sounding earlier in this write-up. These higher echo tops indicate the presence of a convective storm overshooting the EL resulting from an intense updraft.
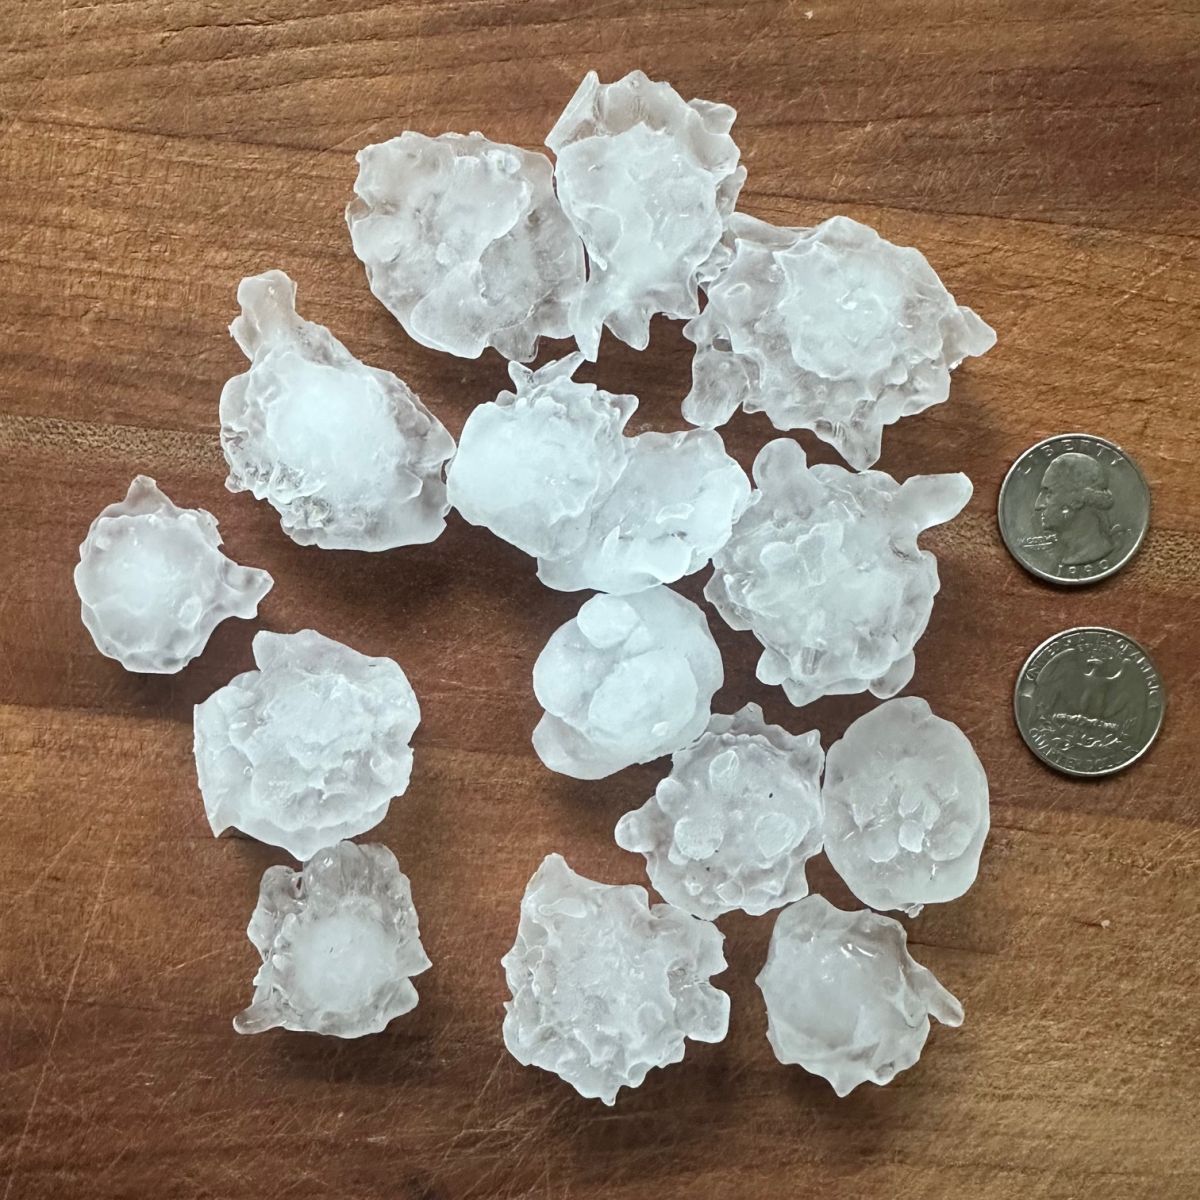
Figure 13: Photo of 1.5 - 2 inch diameter hailstones collected near Richmond, VT on 17 May 2025. U.S. quarters are shown for perspective. Photo courtesy of Michael Hampton.[click to enlarge]
A fine photo of hailstones in Richmond, Vermont (Figure 13) was provided to the office via email the day following the severe weather. This photo was used to verify the significant hailstone of 2" in diameter. For reference, the last time we saw a 2" hailstone in Vermont or northern New York was on October 1st, 2019 in Massena, NY. A very rare occurrence indeed! In addition to the large hail, we saw a lot of small hail across the region. The same supercell that produced the large hail in Charlotte, Richmond, and Stowe also produced a lot of small hail. Portions of Charlotte saw up to 6 inches of accumulating hail (Figure 14), with many hailstones ranging from pea sized to dime sized. This hail quickly melted given temperatures in the 70s at the time.
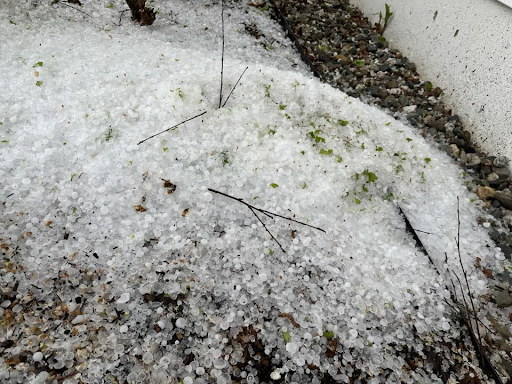
Figure 14: Significant small hail in Charlotte, Vermont. Photo courtesy of Evan Osler. [click to enlarge]
Storm Analysis - Significant flooding in Waitsfield, Warren, Killington, and Hartland
In addition to the severe thunderstorms observed on May 17th, we also saw localized significant flooding across multiple locations in central Vermont. A few of these locations were in Waitsfield, Warren, Killington, and Hartford in Vermont. Here are a few quotes from officials:
From Hartford Town Police Department, shared through VT-Alerts: “There is major flooding in the downtown areas of Hartford as well as trees and powerlines down throughout the town and villages. Do not travel if you do not need to. Do not attempt to drive through flooded roads."
Killington Golf's Superintendent Scott Watelet - Interview with WCAX: “Two failed culverts spilled debris onto the fairway, ripping grass and leaving large ravines in the cart path. The golf course and many activities at the Killington Resort were still closed Memorial Day Weekend as a result of the flooding damage from the 17th." (per their website on 5/24/25)
Rainfall totals for this event were not overly impressive or excessive when compared to previous significant flash flooding events in recent years. Many places saw less than 2 inches of rainfall altogether. The month of May has been wet across the North Country with 13 of the first 17 days reporting rainfall at Burlington. However, rainfall amounts were only slightly above normal and nothing climatologically significant based on rainfall records dating back to 1884 at the Burlington International Airport. Persistent rainfall earlier in the month saturated soils, resulting in more runoff, as heavy rainfall fell on the afternoon of the 17th. This creates locally hydrophobic surfaces which can allow for flash flooding to occur more rapidly than when the ground is able to absorb water. You can see the 7-day average streamflow percent of normal values across the region provided by the United States Geological Survey (USGS) (Figure 15). The dark blue values you see across much of Vermont indicate that the streamflows leading into May 17th were in the 90th percentile or greater compared to historical averages. These high streamflow values likely aided in the flash flooding across the region with rainfall amounts largely 2 inches or less across the areas impacted by flash flooding.
Figure 15: United States Geological Survey (USGS) map showing a 7-day average river and stream flow percent of normal through 16 May 2025. [click to enlarge]
Rainfall amounts on the 17th ranged from a couple tenths of an inch over western St. Lawrence County to two and a half inches across portions of central Vermont; which isn't atypical on days with convective storms. In the areas where flash flooding was observed, rainfall amounts generally ranged from 1.50 to 2.00 inches. The values you see in Figure 16 are a combination of automated gauges, COOP and CoCoRaHs observers. In addition to flash flooding, we also saw some very isolated river flooding with the Mad River near Moretown briefly reaching minor flood stage (Figure 17). Figure 18 shows localized river flooding near Waitsfield from the Mad River.
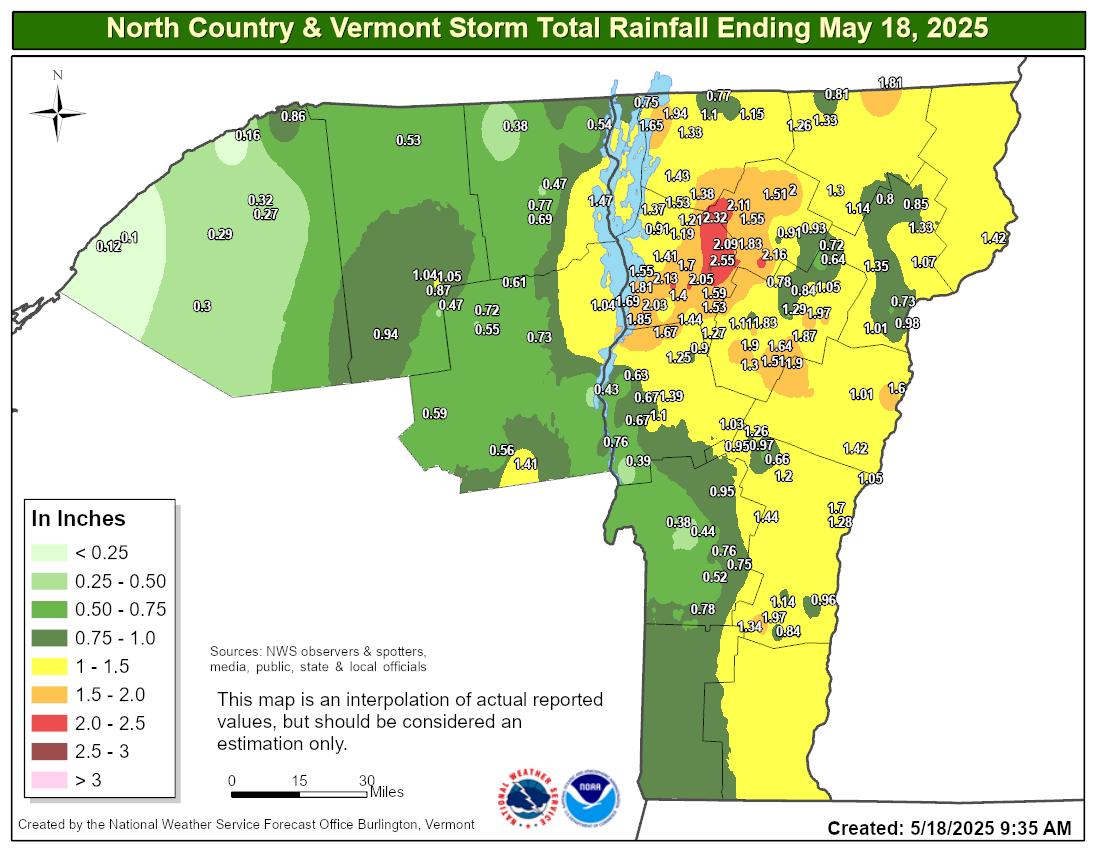
Figure 16: North Country storm total rainfall (in inches) ending at 8 AM EDT on 18 May 2025.[click to enlarge]
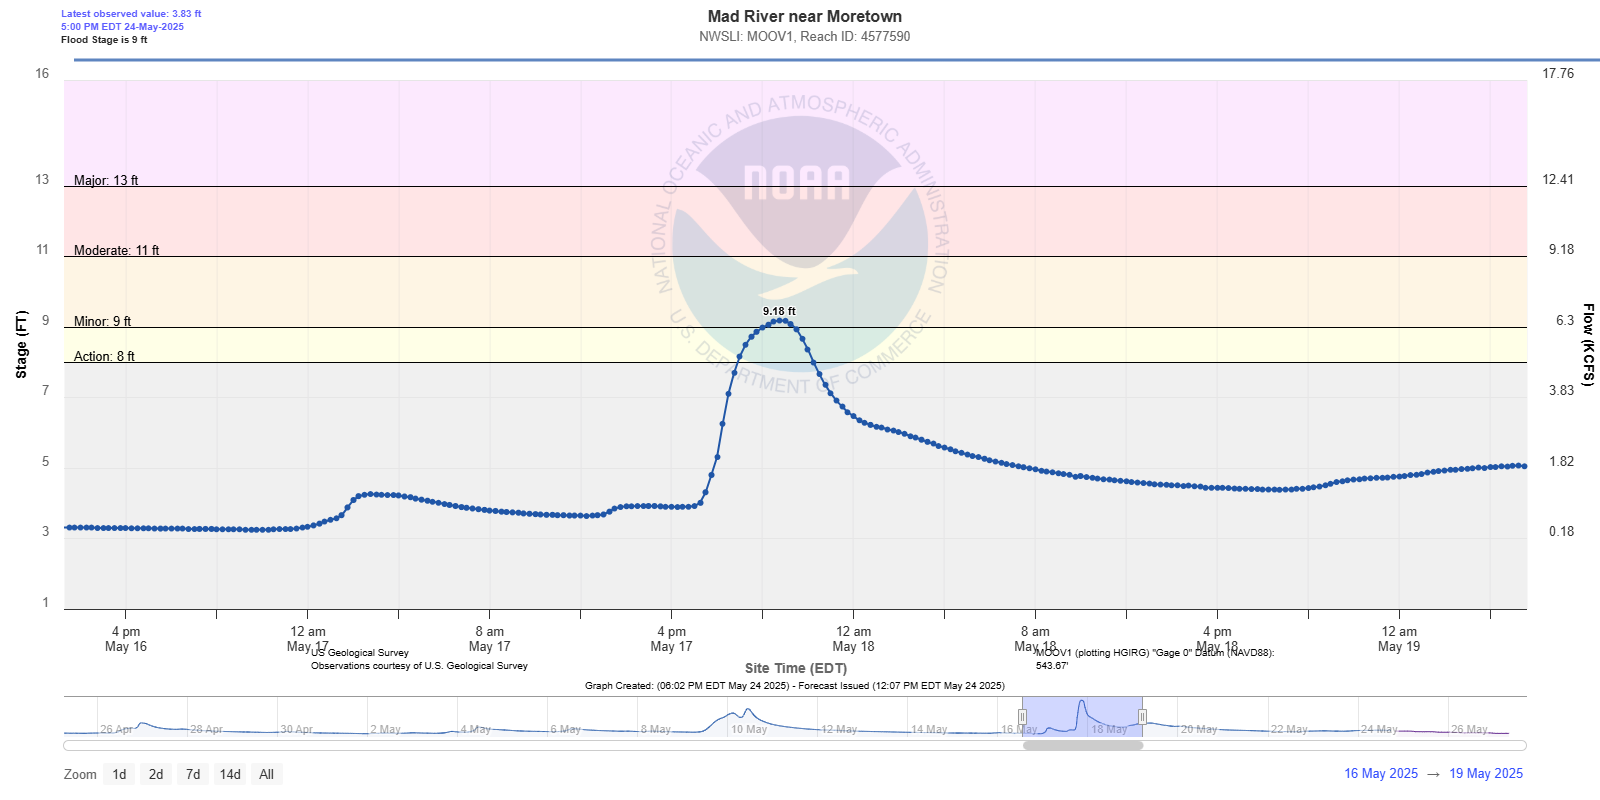
Figure 17: A hydrograph for the Mad River near Moretown, VT briefly reaching flood stage on the evening of May 17th. The river stage (in feet) is shown along the y-axis, with date/time along the x-axis. [click to enlarge]
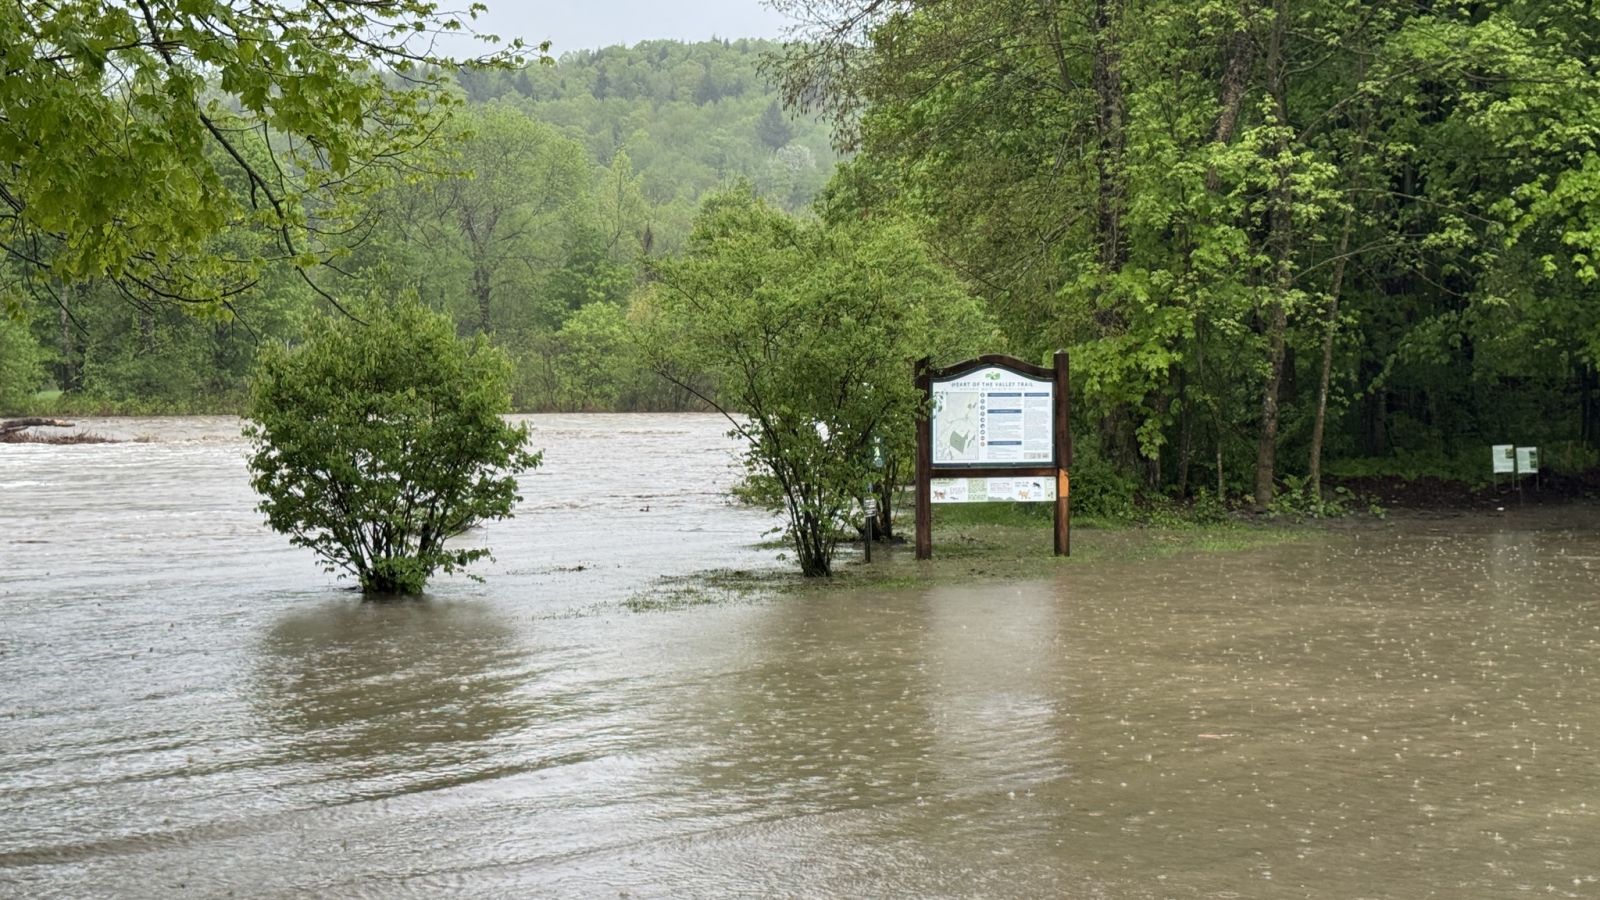
Figure 18: A photo showing the Mad River exceeding flood stage with areas of inundation along the river in Waitsfield. Photo courtesy of John Williams via social media. [click to enlarge]
Forecasters use multiple tools in order to assess rainfall and the potential for flooding, especially in areas of mountainous terrain. On top of automated rain gauges, we use a product called Multiple Radar Multiple Sensor (MRMS) to view all available radar imagery and provide as much information as possible to the forecasters. You can click here to learn more about the MRMS data. One such product of MRMS is something called Quantitative Precipitation Estimate (QPE) to Flash Flood Guidance (FFG) ratio. This takes the radar QPE and compares it to FFG provided by the Northeast River Forecast Center (NERFC) (Figure 19). This product has QPE/FFG ratio as its output. So, let's say we have 2 inches of rainfall measured by the radar and our FFG is 2 inches. This would give us a result of 1. Typically, a value of 1 is a good sign that flash flooding may be occurring or imminent as we exceed the amount of rainfall that the basin can handle. Values less than 1 can still create some flooding concerns, especially in urbanized areas. When you get values above 1, the likelihood for more significant flooding is possible. In the case of May 17th, we had 4 locations that had rainfall footprints that had a ratio of 1 or higher. Three of those areas are shown below with the fourth location being Killington where they have multiple culverts blown out with flooding along their golf course. A look at some of the flooding and flood damage can be seen in Figure 20.
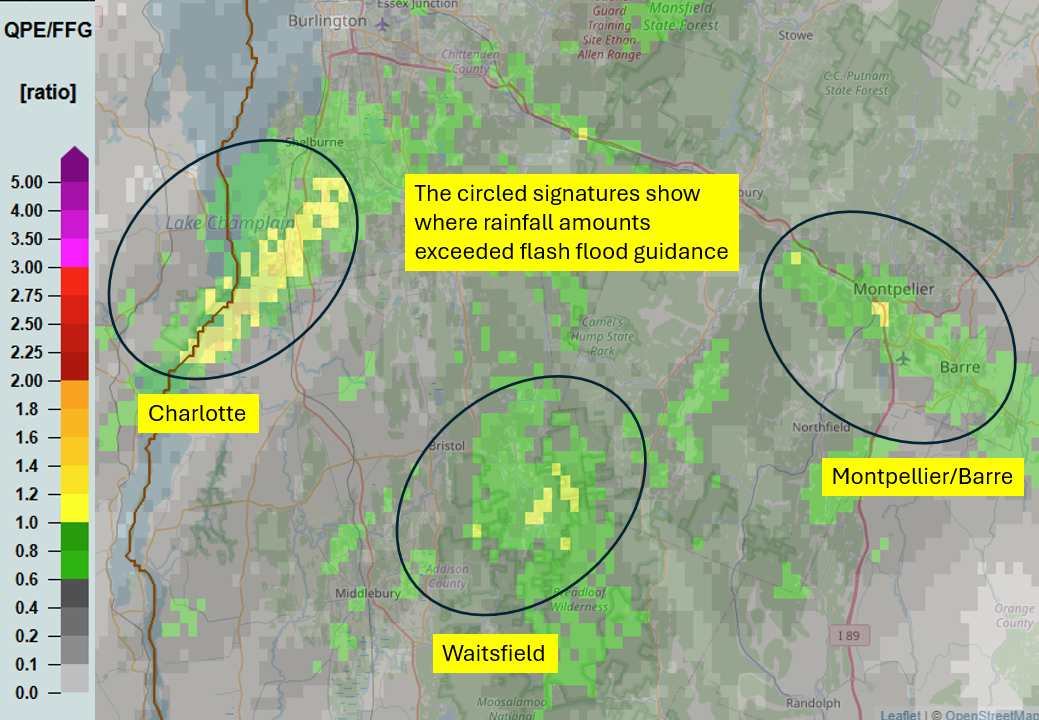
Figure 19: Multiple Radar Multiple Sensor (MRMS) data showing the radar derived Quantitative Precipitation Estimates (QPE) compared to the Flash Flood Guidance (FFG) provided by the NERFC. The yellow color indicates areas where the QPE is equal to or greater than the FFG, which can be a cue to the onset of flash flooding.[click to enlarge]
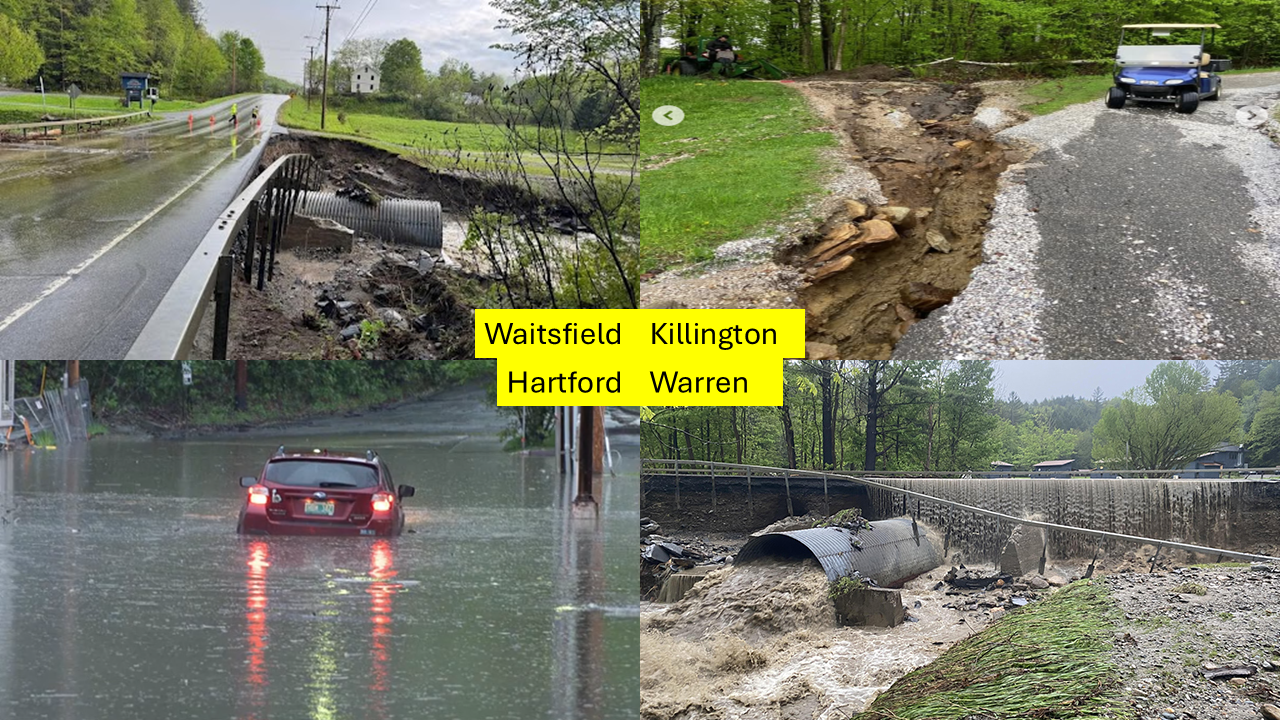
Figure 20: A 4-panel image showing flooding and flood damage in Waitsfield, Killington, Hartford, and Warren. Photos courtesy of local media outlets and Killington Mountain Resort. [click to enlarge]
Storm Summary
This was our first significant severe weather event of the 2025 season, which featured significant hail up to 2" in diameter near Richmond, VT, areas of wind damage, and localized flash flooding. The damaging thunderstorm winds and dangerous lightning produced almost 4,000 power outages across Vermont during this event. This event featured a combination of supercells and bowing line segments as the primary storm mode, which transitioned into areas of multiple cell clusters. These thunderstorms produced very heavy rainfall from the central Champlain Valley into parts of central and southern Vermont, where 1 to 3 inches of precipitation was observed in a short period of time. The high rainfall rates caused localized flash flooding in the Cambridge, Waitsfield, Killington and Hartland areas, with some culvert and dirt road washouts, along with areas of water impacting homes and businesses, including flood damage to the Killington Golf Course. Figure 21 summarizes the North Country severe weather and flooding reports, which included wind and tree damage, along with hail reports from severe thunderstorms.
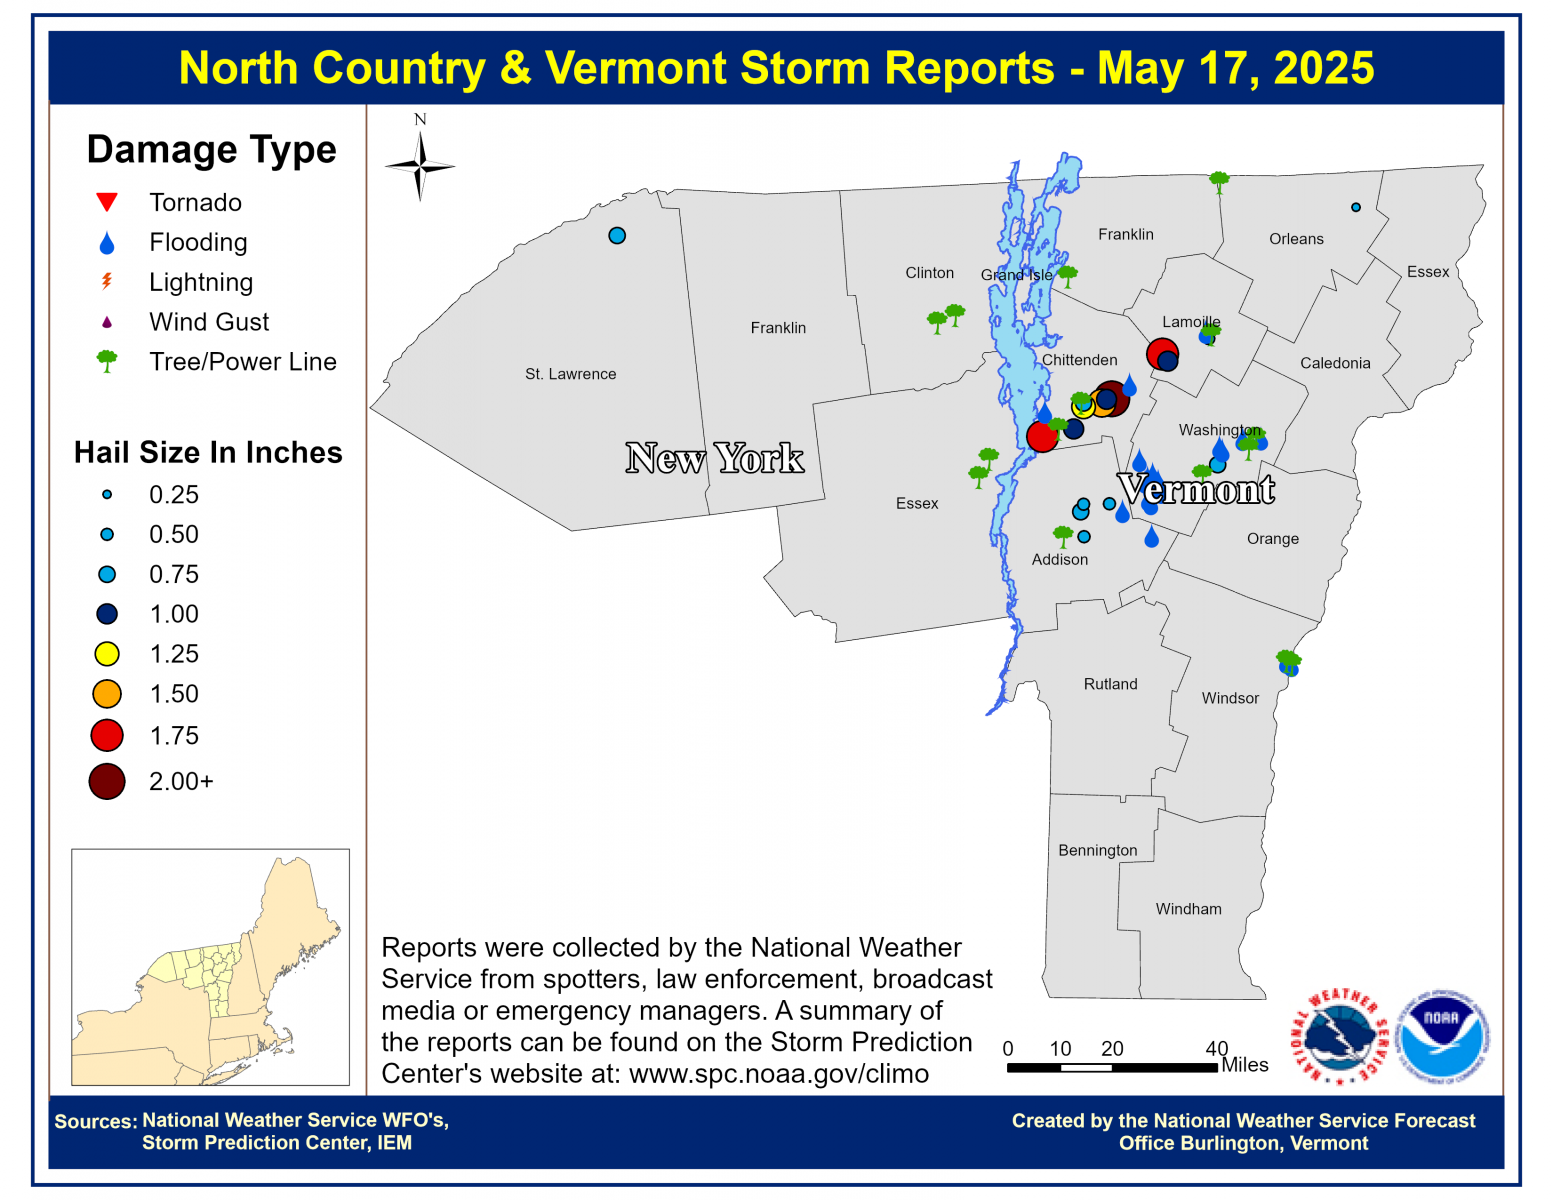
Figure 21: North Country storm reports received as of 8 PM EDT on 17 May 2025.
Disclaimer: Figure 8 courtesy of Tropical Tidbits web site: https://www.tropicaltidbits.com/
Radar imagery for images 9, 10, 11, and 12 were generated using GR2Analyst, Gibson Ridge Software Company http://www.grlevelx.com/gr2analyst_2/

