 Email the authors
On March 23rd, 2024, snow began falling overnight into much of the day as a quick-moving, but very dynamic system produced a swath of 15 to 30 inches of snow across portions of interior New England. Despite such a warm winter, antecedent cold air was in place leading up to this event, and the timing of when snow began to fall ensured that we could achieve as much accumulation as possible given the late-March Sun angle. The primary forecast challenge was the intensity of a developing area of low pressure in the mid-levels of the atmosphere and how that would affect the positioning of the most favorable frontogenetic forcing across the region. Additionally, the track of the system moved nearly overhead, which resulted in a subtle warm nose to shift into southern Vermont capable of producing sleet. How and when that lifted north was another factor when forecasting snowfall accumulations. For a large portion of the region, the final forecast before the event was too high, but in parts of south-central Vermont the forecast was too low due to the potential for sleet and wet snow (Figure 1).
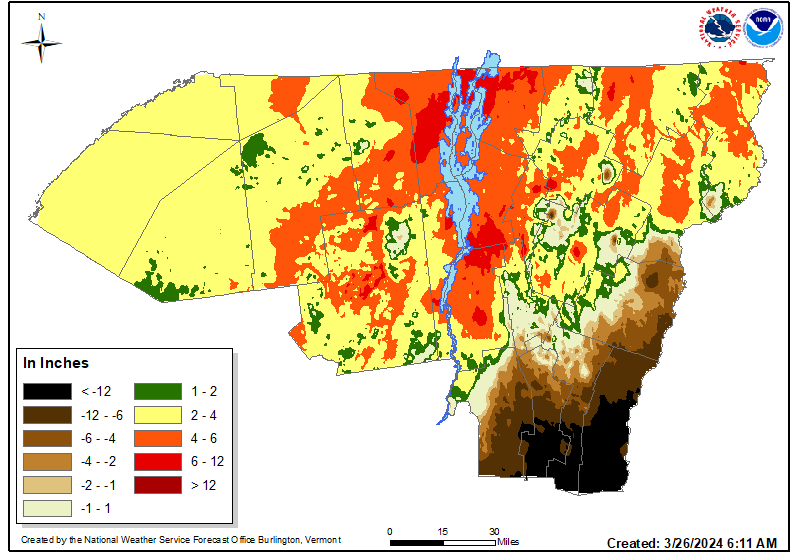
Figure 1: The forecast error map for snowfall between March 23rd and March 24th, 2024. Configurations like the positive bias across northern New York and the northern half of Vermont while the negative forecast bias across south-central Vermont is a common characteristic of the heaviest observed snowfall displaced with respect to the forecast maximum snowfall.[click to enlarge]
As has been the case for many events this winter, forecast ranges for snowfall were high, but forecast guidance was also slow to trend south until snow began to fall. Given the time of year and the warm nose edging into parts of Vermont, heavy wet snow was anticipated. However as snow began to fall, it quickly became apparent snow characteristics would be drier. This resulted in a significant underforecast across southern Vermont, but on the bright side, yielded far less impacts. As a result, this event will be remembered for its benefits to ski slopes given the lack of snow for the 2023-2024 Winter Season. While the heaviest snowfall occurred east of Vermont, a couple of cooperative observers (COOP) saw late season 24-hour accumulations second only to the Pi Day Storm of 2017 (Figure 2).
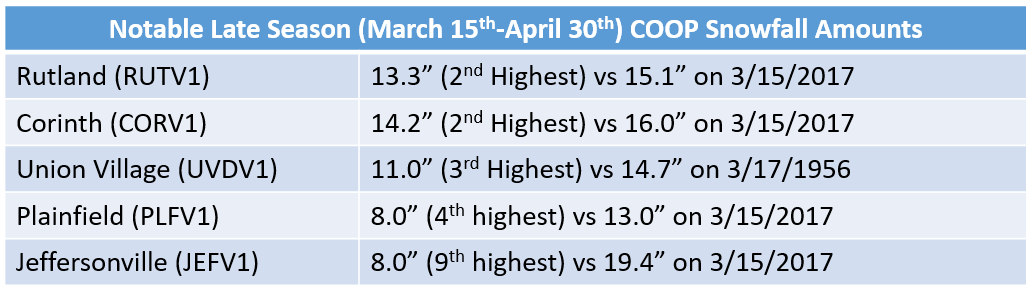
Figure 2: List of COOP observers with 24 hour snowfall observations in the top ten compared to their record value for late season events (defined here as March 15th to April 30th). Only COOP sites with a data record of 25 years were selected.[click to enlarge]
This event had two defining features. The first was the rich connection of tropical moisture as noted in the 700hPa analysis from upper air plots by the Storm Prediction Center. This would supply deep-layer moisture to produce high snowfall totals. The other defining feature was the lack of a strong upper low. Typically our biggest events come from large scale lows high in the atmosphere. However, this event featured a coupled jet structure with a meridional subtropical jet connection originating in the tropics with another 300hPa jet streak ahead of an upper trough east of the Great Lakes. One can also note the tight isotherm packing across Vermont and northern New York in the 700hPa analysis (Figure 3). These situations can be challenging. If the layer of cold air had advanced more slowly, more sleet would have occurred. Given the proximity of the 850hPa low across south-central Vermont, this was largely expected but did not happen (not shown). So the combination of strong synoptic scale forcing and the interaction of a tropical air mass with cool winter conditions produced this swath of late season snow.
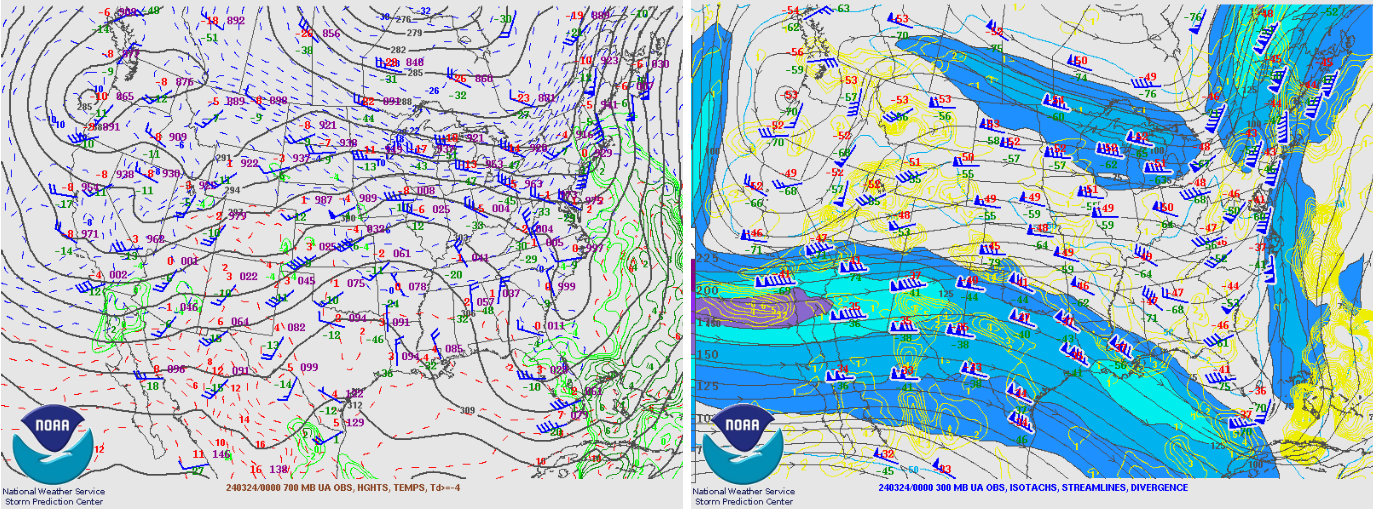
Figure 3:
Since there was no upper level low, the area of low pressure rapidly shifted northeast. While the residence time of the surface low was not long as it quickly traversed North Carolina to the Gulf of St. Lawrence in 24 hours, the forcing made up for it. Helping to maintain precipitation were two other surface lows. One near James Bay would help funnel moisture towards the region, and another in the Ohio River Valley would merge the low tracking along the coastline. Snow showers continued as a cold front attached to the northernmost trough shifted east, but dry air and building high pressure quickly removed lingering precipitation (Figure 4).
Figure 4: An animated loop of surface pressure and station plots mapped by the Weather Prediction Center. An L indicates the center of low pressure, and an H indicates the center of high pressure. The first image was analyzed 09z 23 March 2024, the second image was analyzed 21z 23 March 2024, and the final map was analyzed 09z 24 March 2024.[click to enlarge]
Based on the position of the surface low and the 700hPa thermal gradient, the southern Adirondacks, the southern half of Vermont, New Hampshire, and parts of Maine received the most snow where a narrow band of intense snowfall rates developed. The gradient was gradual with this event. Across the St. Lawrence Valley, amounts were less than 4 inches. Across the Adirondacks and the northern Champlain Valley, about 5 to 9 inches of snow were observed. Along the northernmost fringe of mesoscale banding in Essex County, New York, and Washington County northward in Vermont were mainly between 10 and 16 inches. Within the heaviest pocket of snow, 16 to 22 inch observations were common, with localized amounts over 2 feet near the southern border of Rutland and Windsor Counties (Figure 5).
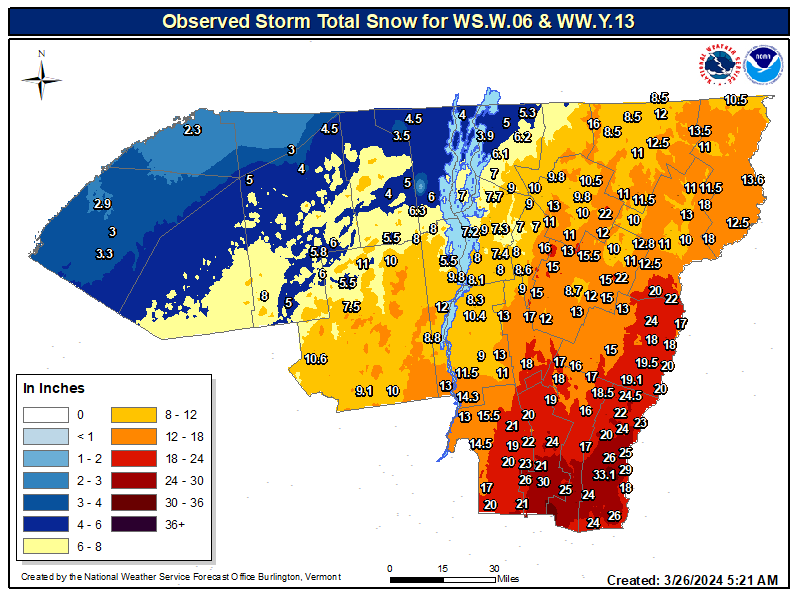
Figure 5: Observed storm total snowfall across northern New York and most of Vermont between March 23rd and March 24th.[click to enlarge]
The potential for 20 to 30 inch snowfall accumulations was a difficult consideration due to how quickly the system ejected northeastward and the potential for low snow-to-liquid ratios. Probabilistic information depicted through a box and whisker plot indicated that observed totals in central Vermont exceeded their 90th percentile. For example, Rutland’s 90th percentile was just under 17 inches, while the town reported almost 20 inches of snow. Another example would be Springfield, Vermont with the 90th percentile forecast just over 12 inches, but observations near Springfield were over 24 inches (Figure 6). The range of possible outcomes was large already but stemmed from liquid equivalent amounts approaching two inches. Localized liquid equivalent values greater than 2.50” were observed where the heaviest snow fell in Rutland and Windsor Counties. Forecasting the placement and intensity of mesoscale banding within these quick events remains a challenge.
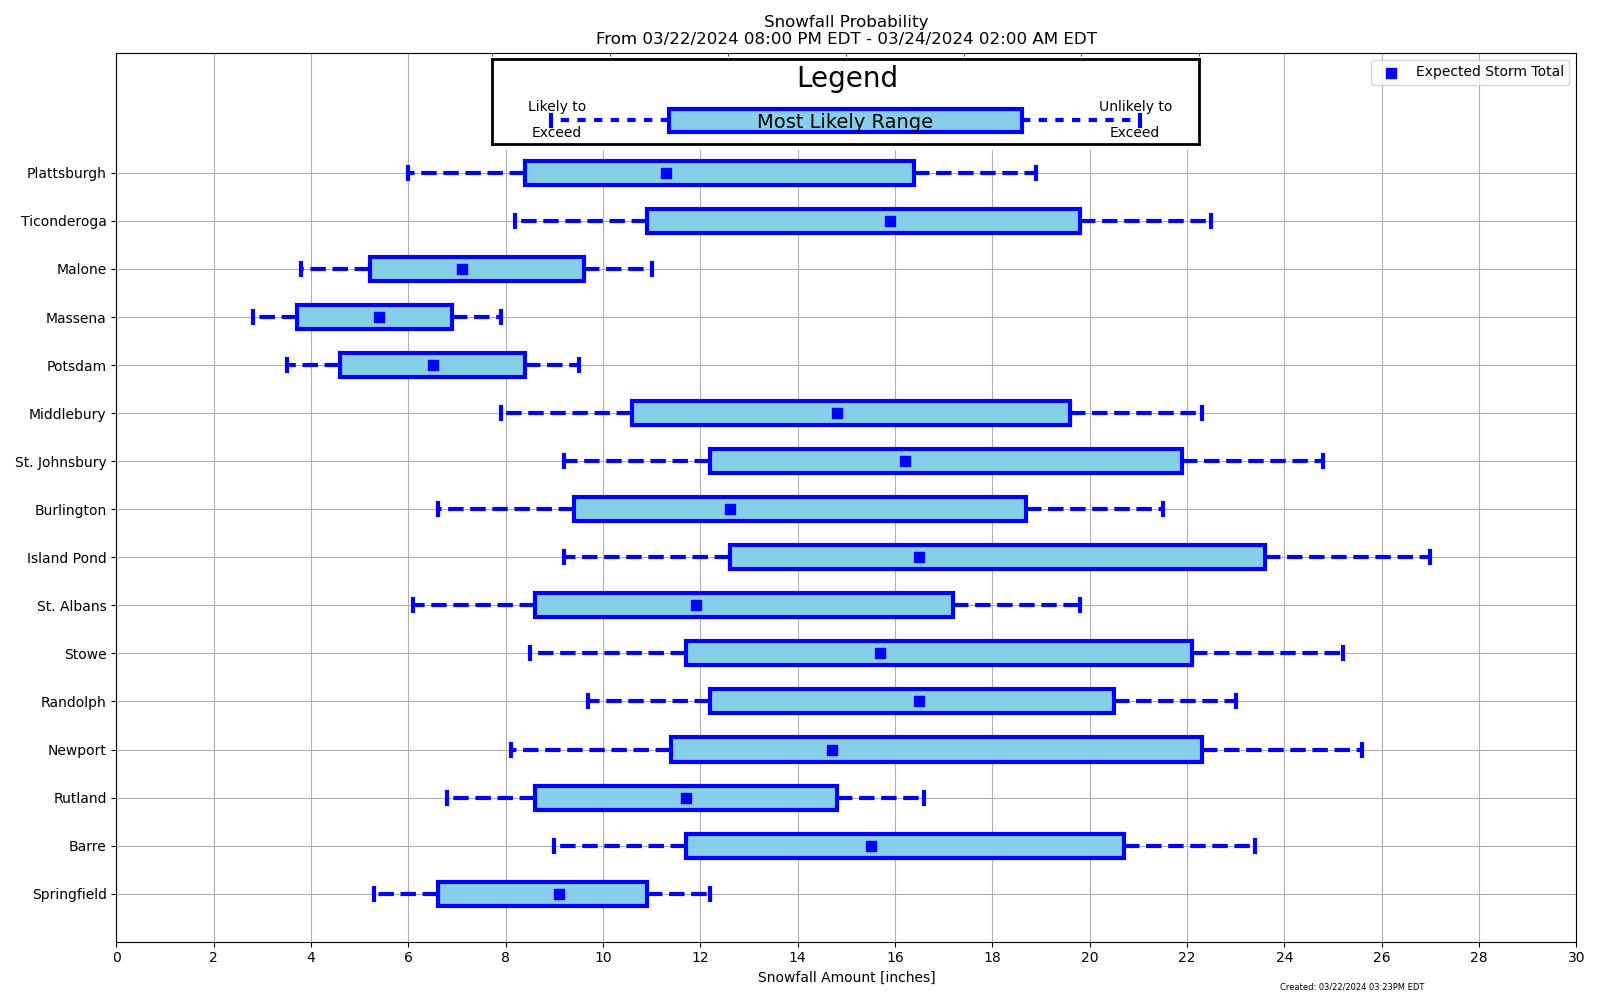
Figure 6: A box and whisker plot for the final forecast issuance. The leftmost whisker indicates the 10th percentile or most likely to exceed value. The box encompasses the 25th and 75th percentile amounts, and the rightmost whisker indicates the 90th percentile. The blue box was the forecast expectation. A box and whisker is generated for several major towns/cities on the y-axis and the snowfall amount in inches is plotted on the x-axis. [click to enlarge]
A large southward shift of heaviest snowfall occurred between the Day 3 & 2 to Day 1 forecast. In Figure 7 below, observe how the National Blend of Models initially forecast an event that would be a common, elevation-dependent event for the season, and then transitioned into a broader snowfall event. It was not until about 12 hours before the first flake fell that it began to trend southwards.
Figure 7: National Blend of Model Forecasts beginning on 19-23 March 2024 at 00z. Then, the 06z, 12z, and 18z NBM total snow accumulations depict the south and eastward shifts that quickly occurred on the last cycles leading into the event.[click to enlarge]
Another source of error was that forecast guidance allowed warm air too far north resulting in warmer forecast profiles than would be observed. With deep south to southwest flow and the lack of an upper level low, any forecaster would be reasonable in deciding a layer of air above freezing would develop as several groups of forecast models indicated. However, features like the coupled jet structure likely preserved cold air in conjunction with surface high pressure west to the mouth of the St. Lawrence. The GFS, in particular, was too amplified for this event. It is not shown here, but even when snow began several ensemble members erroneously depicted freezing rain across south-central Vermont. Figure 8 is the High Resolution Ensemble Forecast available at 00z 23 March 2024, as precipitation was beginning, and the mean indicated the likelihood of a weak warm layer.
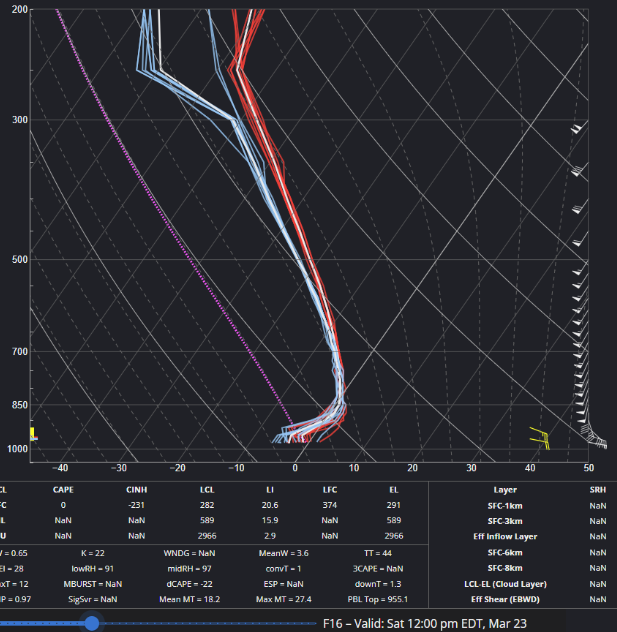
Figure 8: Dynamic Ensemble-based Scenarios for IDSS (DESI) highlights several High Resolution Ensemble Forecast (HREF) soundings at KRUT on 16z 23 March 2024. The 0 °C line is highlighted to emphasize the freezing point. The red lines represent individual member temperature forecasts, and the blue lines represent individual member dewpoint forecasts. The mean for each value is shown in white. Between about 900 and 775 hPa, the mean temperature forecast was above freezing.[click to enlarge]
In Figure 9 below was the 12z ALB (Albany, NY) sounding observed on that day. In addition to the weak warm nose, there was a fairly substantial area of well below freezing air beneath a sharp inversion. Even in the event of sleet or rimed snowflakes, it would be difficult to stick on power lines due to the depth of the cold air. Outside peak heating, temperatures remained well below freezing, and dewpoints remained in the 20s during the event. What was initially anticipated to be a significant or potentially extreme event for utilities due to snowloading became a travel impact (Figure 10).
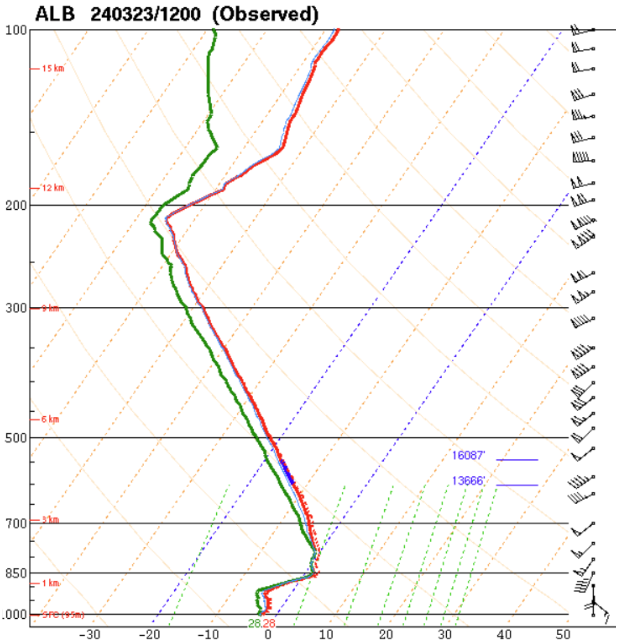
Figure 9: The sounding observed at 12z 23 March 2024. Similar to Figure 8, but with one observed value. It’s very moist with 60 knot 850hPa southwest winds bringing strong warm air advection. However, the warm layer remained weak and shallow, even to our south. There is a relatively small DGZ layer about 2400 ft in depth, which is where the red line is highlighted in blue, located almost 14,000 feet above ground level. [click to enlarge]
Figure 10: The snow loading component of the Winter Storm Severity Index forecast across Vermont and northern New York valid through 25 March 2024. This was issued 00z on March 23 March 2024, which was when precipitation was beginning to fall. This indicates potential winter storm impacts like extensive disruption to infrastructure, such as power lines.[click to enlarge]
The March 23rd heavy snowfall forecast was another difficult forecast event in the Winter 2023-2024 season. The event surprised the region in the best way possible. What was expected to be a wet snow event with significant utility impacts was one that only disrupted power for about 1700 people across Vermont. This was a welcome relief given that south-central Vermont received 1.50-2.50” of liquid equivalent. The region of mesoscale forcing was farther south than forecast expectations with less sleet as well. Travel was difficult during the event. However, snowfall occurred on a Saturday, which minimized school and commuter concerns. This likely yielded net positives considering the poor winter recreation conditions up until this point.
We would also like to say thanks to everyone who provided reports. After quality checking, 240 data points went into the final map. Since we made some comparison to the most impactful March snowstorm in our database, the March 2017 Pi Day Storm, that event had 145 data points in the final map. Your reports are vital to mapping the scope and intensity of our snowfall events. We would also like to thank and encourage our CoCoRaHS and COOP observers. They dedicate time and energy to providing daily reports across the region. The selected ranked events were from COOP observers with periods of record of at least 25 years. Thanks to these volunteer recordkeepers, we can provide historical analysis like Figure 2.

