 Email the authors
Introduction
On Tuesday, October 1st, showers and thunderstorms developed through much of the day across Northern New York and the Northeast Kingdom that resulted in large hail and minor river flooding. One storm produced significant, egg-size hail (approximately 2") at Massena, NY around 1:53 PM EDT: unusual given the time of year. Based on a severe climatology study for our local area from 1955-2016 (LaRocca 2018), the 2-inch hail size would be in the upper echelon of recorded hail reports across the St. Lawrence Valley.
Pre-storm Environment and Storm Initiation
The synoptic weather pattern was favorable for producing moderate to locally heavy showers and thunderstorms. A deep layer ridge was positioned across the Southeastern United States where high temperature records would be recorded. Meanwhile, a low pressure system that caused an early season blizzard across portions of the Intermountain West lifted over the Great Lakes into Ontario Province, Canada. Further south, Tropical Storm Narda moved into the Gulf of California in the Eastern Pacific. The upper jet stream efficiently transported moisture from Narda up to the low pressure system across Canada, setting the stage for a wet day across the Northeast. Precipitable water values increased to roughly 1.5"-1.75" over the North Country - well above normal for the beginning of October.
Showers and thunderstorms developed along a warm frontal boundary that remained stalled near the International Border and along eastern VT (Figure 1). Easterly winds in the northern St. Lawrence River Valley converged with southwest winds advecting a summer-like air mass, with portions of the New York warming into the 80s. Temperatures north of the warm front remained below 60 due to the cool, easterly flow under ample cloud cover. Strong frontogenetical forcing was continually reinforced through the showers and thunderstorms that developed until the low passed east (Figure 2).
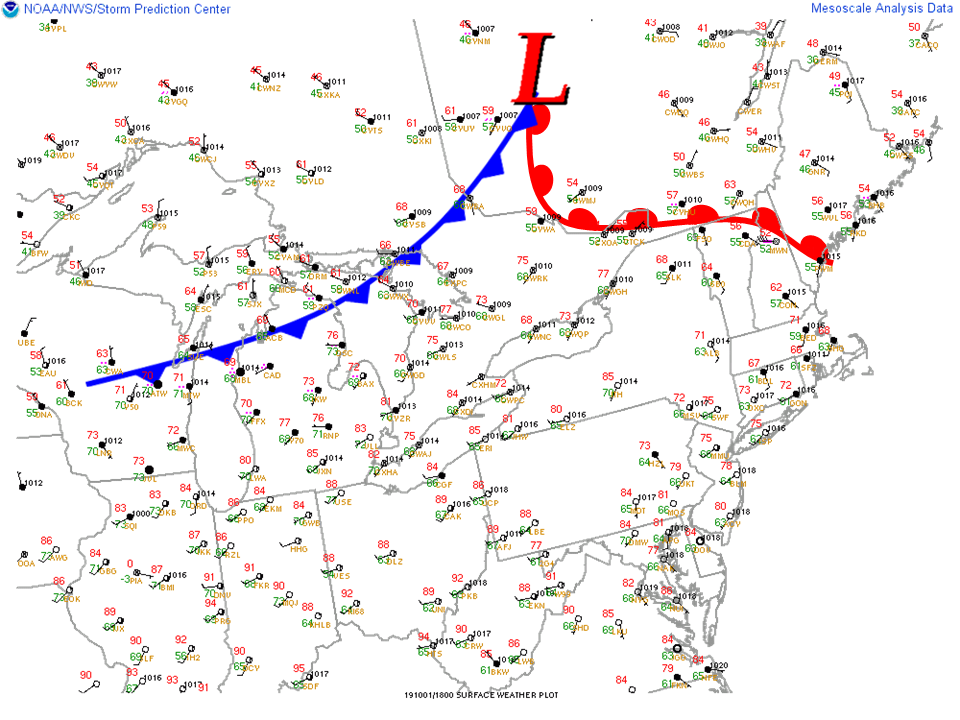
Figure 1: A map of surface observations at 1800Z (2:00 PM) with frontal analysis.[click to enlarge]
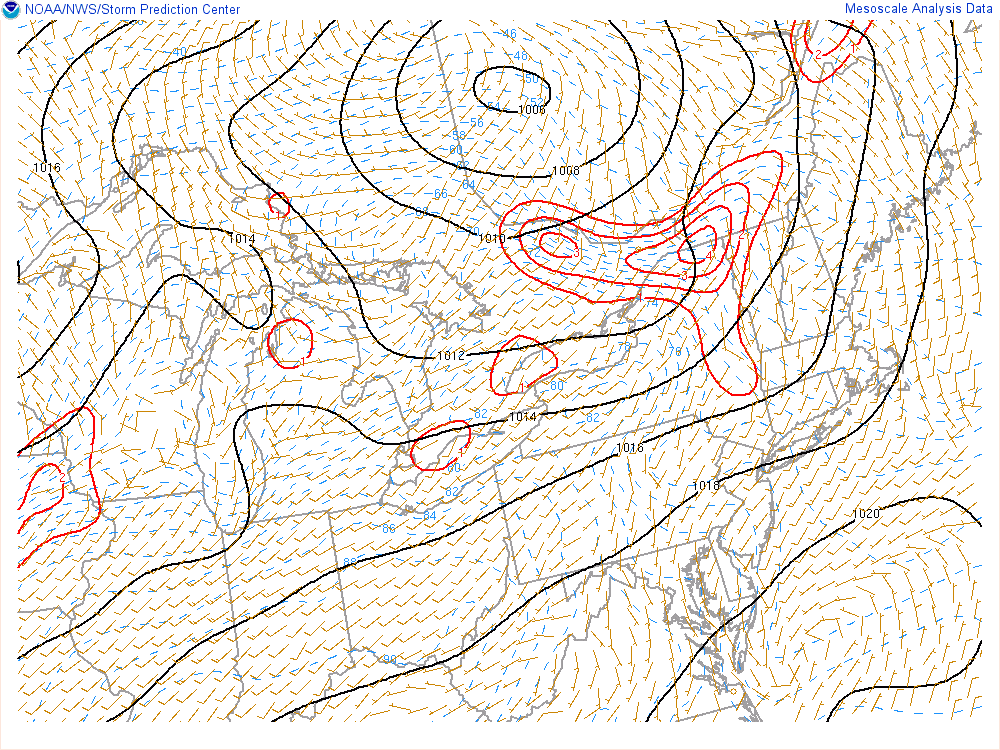
Figure 2: Mesoanalysis map from the Storm Prediction Center of the surface frontogenesis at 2 PM on October 1st. The red contours across Northern New York showing the strengthening temperature gradient.[click to enlarge]
Near Storm Environment
With the summer-like air mass moving into the St. Lawrence Valley, the atmosphere was becoming increasingly unstable, with CAPE (Convective Available Potential Energy) values rising to over 1000 J/kg present in the region. (Figure 3). Convection initiated along the warm front near Ottawa, moving southeast under northwesterly flow aloft. Against the southwest flow near the surface, this indicated good directional shear along the St. Lawrence Valley (not shown). The developing thunderstorms can be seen in satellite imagery at 1746Z (1:46 PM EDT) on the infrared channel (Figure 4). The yellow coloring indicates the taller thunderstorms developing over Massena, New York.
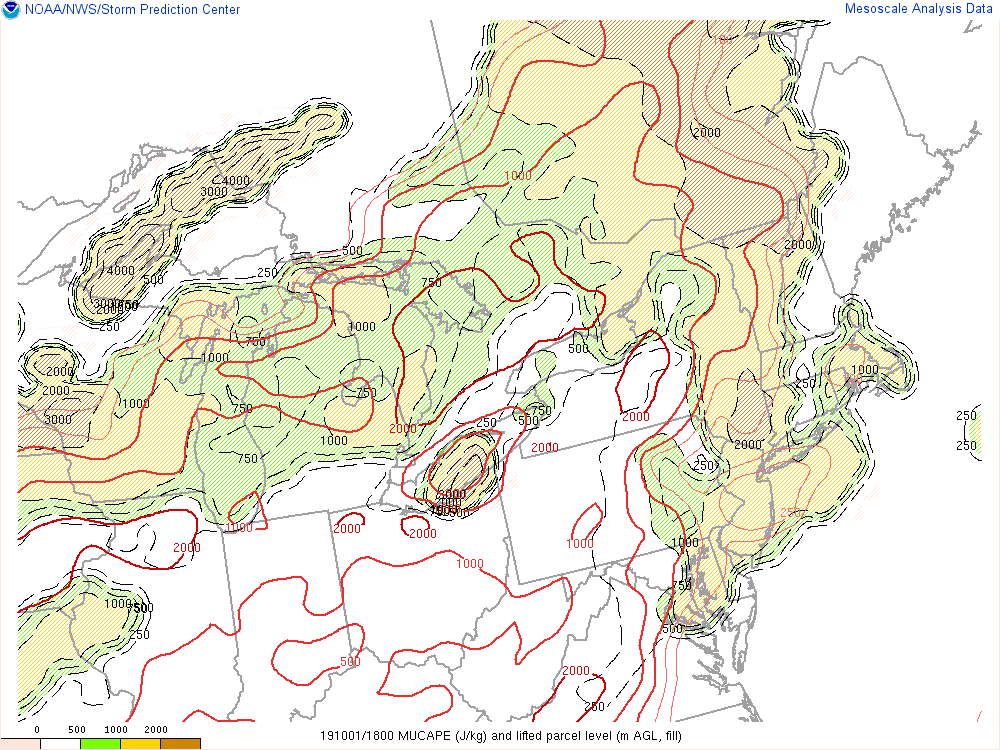
Figure 3: Mesoanalysis map from the Storm Prediction Center of most unstable CAPE at 2 PM on October 1st. The red contours across Northern New York show the strengthening temperature gradient.[click to enlarge]
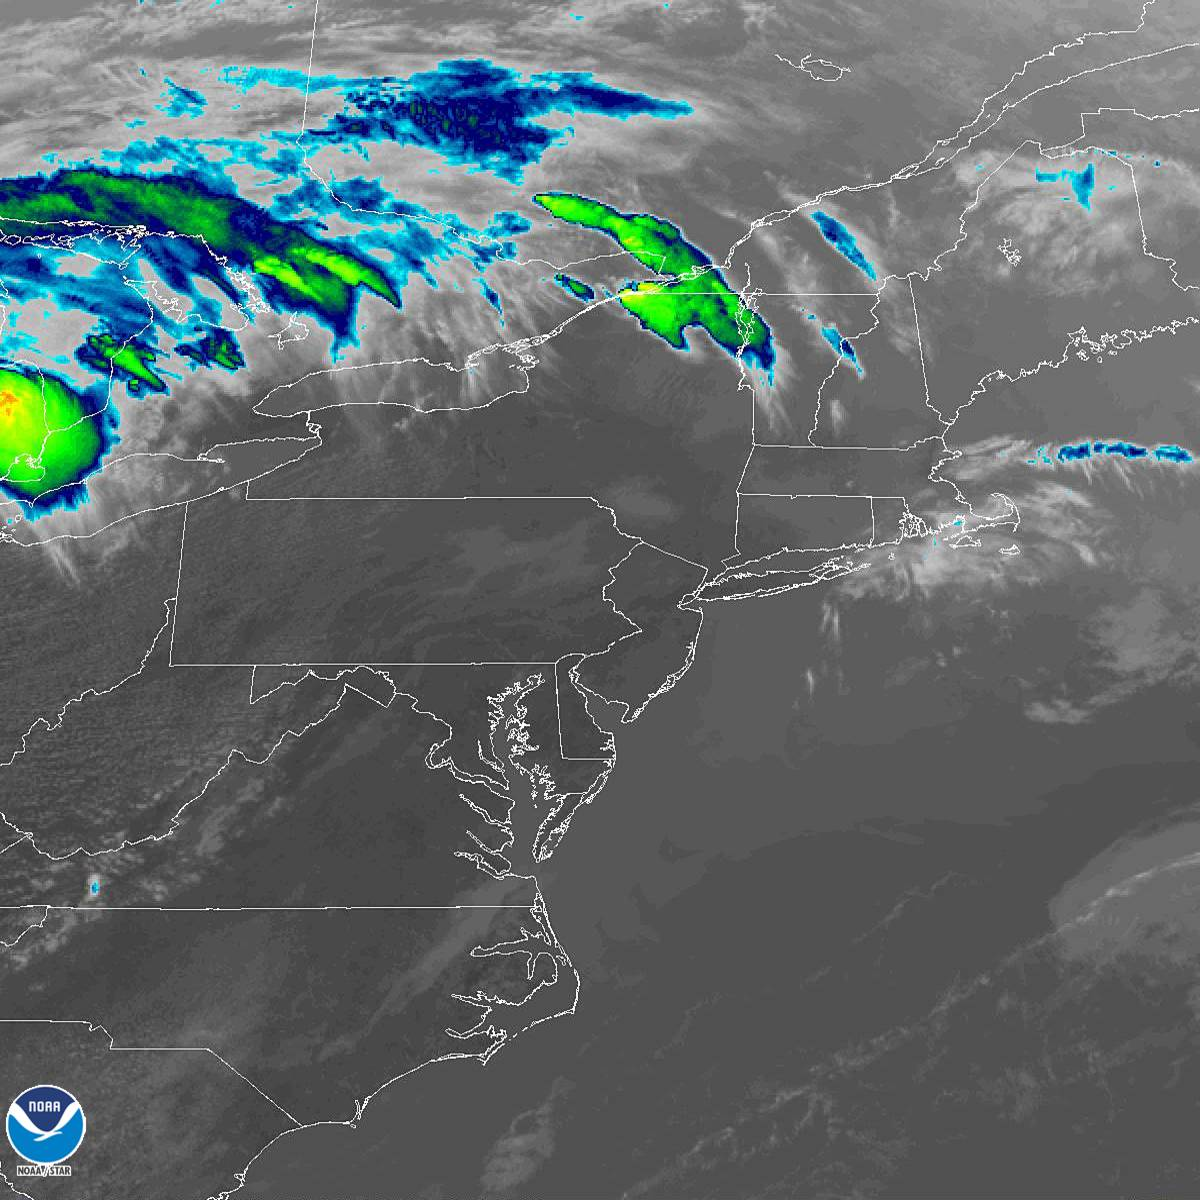
Figure 4: Satellite Imagery from GOES-R on the IR channel at 1746Z (1:46 PM EDT) as thunderstorms began to develop near Massena, New York.[click to enlarge]
When looking at RAP forecast soundings for Massena (KMSS) during the event, several features stand out when evaluating the severe hail potential of the environment. A 45 kt southwesterly low-level jet resulted in a strong low-level temperature inversion during the morning hours that initially limited instability during the event. However, once the surface temperatures warmed to the mid 60s by the early afternoon, instability began to rapidly increase. In addition to surface warming, notable cooling can be observed in the 400 mb to 700 mb layer during the day, and lapse rates increased to over 6.5 C km-1. The steepened mid-level lapse rates are favorable for the development of large hail because it results in large CAPE within the hail growth zone (-10 to -30C).  One factor that limited potential hail size during the event was the relatively deep warm cloud layer (wet bulb zero heights between 11.5 and 12k ft). When falling through deep warm cloud layers, large hail has more time to melt before reaching the surface than within shallower warm cloud layers, so it’s relatively rare to get large hail reported at the surface in these situations.
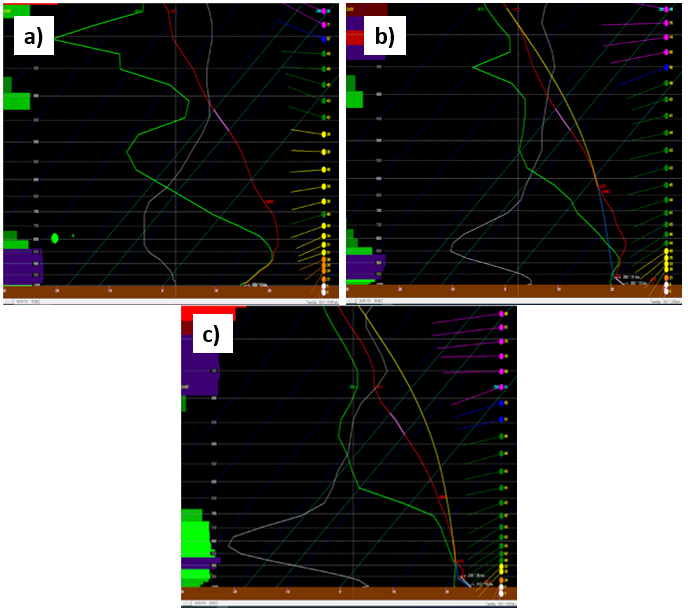
Figure 5: Forecast soundings for Massena, NY (KMSS) using the Rapid Refresh Model (RAP) based on the 1200 UTC run 1 October 2019 valid at a) 1500 UTC (11 AM EDT), b) 1800 UTC (2 PM EDT), and c) 2000 UTC (4 PM EDT).[click to enlarge]
Massena Storm Analysis
Among the storms that were developing near Ottawa and approaching the Saint Lawrence Valley, one particular storm stood out as it approached the International Border. This storm had higher echo tops than the surrounding storms and had signs of a mid-level mesocyclone on radar. Figure 6 shows the core of the storm as it approached Massena from the west. The storm had echo tops to around 50,000 ft, 40 to 50 dBZ heights of around 45,000 ft, and 60+ dBZ heights of 30,000 ft. In addition to the impressive core of the storm, radar imagery showed signs of mid-level rotation (Fig. 7). The mid-level rotation visible indicates that a rotating updraft is present within the storm, which allows for prolonged hail growth within the core of the storm.
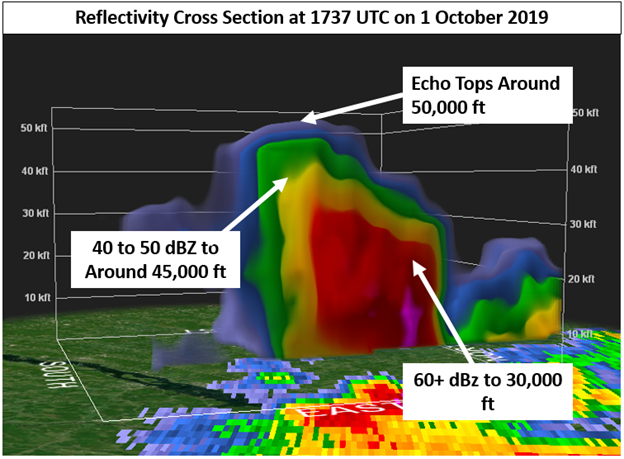
Figure 6: KTYX reflectivity cross section over the Saint Lawrence Valley as the storm approached Massena at 1737 UTC on 1 October 2019.[click to enlarge]
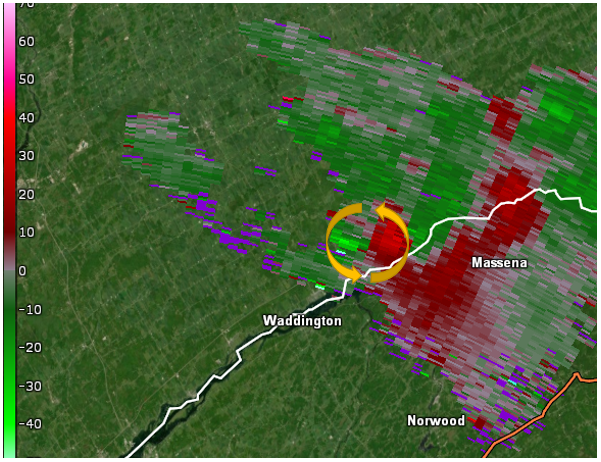
Figure 7: KTYX Storm Relative Velocity image at 1.3 degree tilt at 1737 UTC on 1 October 2019.[click to enlarge]
Between 1:49 and 1:55 PM EDT, two hail reports were received in the Massena area, including a report and pictures of some 2 inch hailstones (Figure 8).

Figure 8: Approximate 2" hailstones that fell in Massena, NY shortly before 2 PM on 1 October 2019. Photo credit to Terry S. [click to enlarge]
River Flooding
As the day progressed, precipitation continued to develop along the stalled warm frontal boundary. Precipitable water values increased closer to 2.0" (Figure 9). This resulted in a swath of steady moderate to occasionally heavy rainfall in the Northeast Kingdom from confluent flow across the warm front. Minor river flooding occurred at the Missisquoi River near North Troy, Vermont and along the East Branch of the Passumpsic (Figure 10). Minor street flooding was reported in Lyndonville, Vermont along Route-122. Rainfall totals across portions of the Northeast Kingdom exceeded 3.0" for the event (Figure 11).
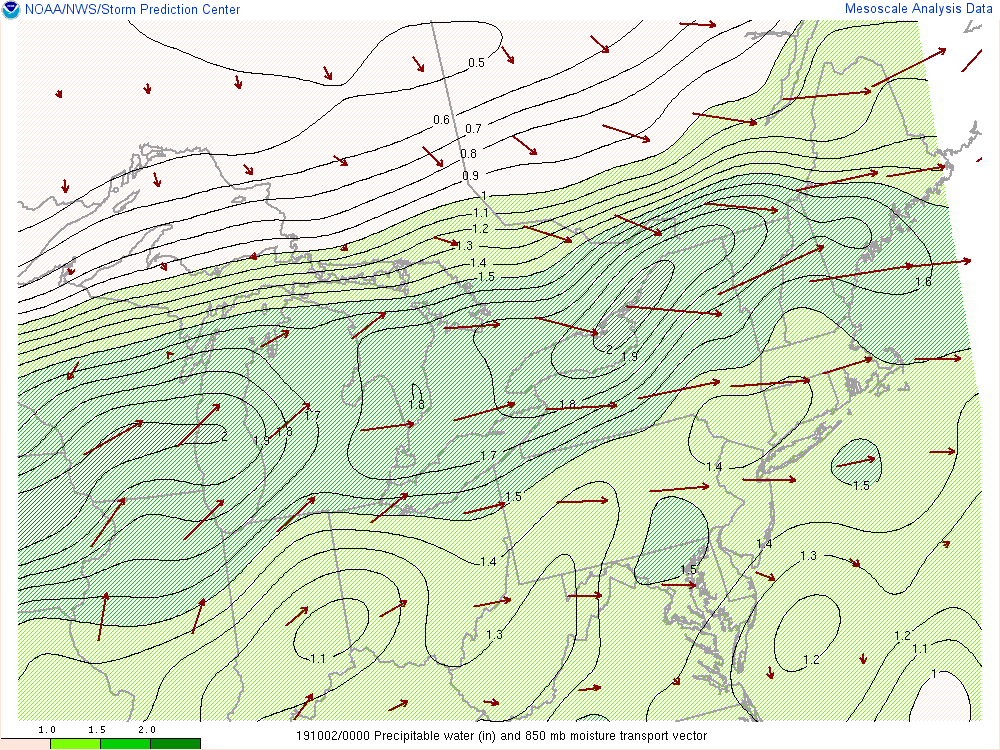
Figure 9: Mesoanalysis map from the Storm Prediction Center of precipitable water values at 8 PM on October 1st. Red arrows indicate the moisture transport, showing the axis of highest moisture flowing across the Great Lakes into the North Country.[click to enlarge]
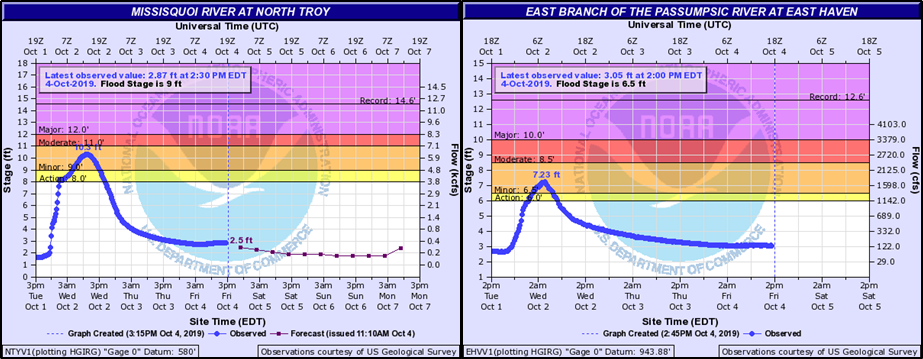
Figure 10: River levels observed at the Missisquoi River gage at North Troy (left) and the East Branch of the Passumpsic River at East Haven (right). The different flood stages are color-coded. Both rivers went into minor flood (orange) overnight.[click to enlarge]
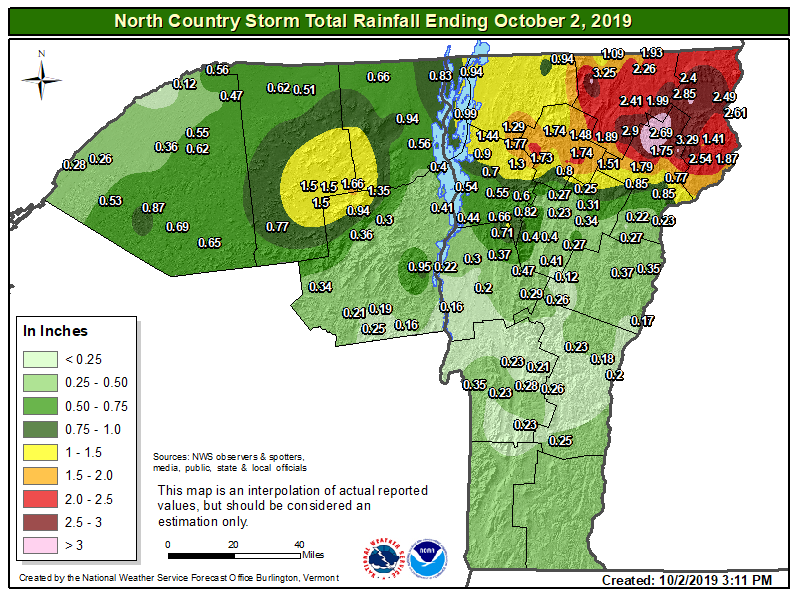
Figure 11: Observed storm total rainfall for the event from October 1st to October 2nd.[click to enlarge]

