
A Winter Storm Watch is in effect for southeastern St. Lawrence County in New York. Lake effect snow is expected to develop, with total snow accumulations between 4 and 10 inches possible. Travel could be very hazardous, especially for anyone traveling for the Thanksgiving holiday. Continue to monitor the latest forecasts for updates. Read More >
 Email the authors
Event Overview:
During the late afternoon and evening hours on Friday, 4 May 2018, a widespread severe weather event affected northern New York and Vermont with damaging winds, large hail, and localized flash flooding. The thunderstorms across the region were driven by relatively low instability, with convective available potential instability (CAPE) values generally < 1000 J kg-1. However, a vigorous mid-level trough approaching from the eastern Great Lakes brought about unusually strong vertical shear profiles and well-defined forcing for ascent. The low CAPE/high vertical shear environment yielded a combination of fast-moving mini-supercells and an intense quasi-linear convective system (QLCS) (or squall line) across the North Country.
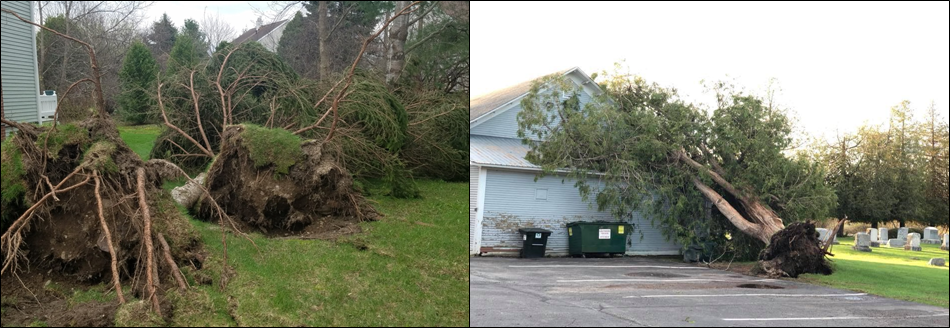
Much of the event damage was caused by intense straight line winds and microbursts, with radar estimated near-surface wind speeds of 60 to 80 mph with the strongest storms. Downed trees and lines caused numerous power outages, including nearly 25,000 customers across Vermont at its height Friday night. Shelburne, Vermont was one of the hardest hit communities, with estimates of hundreds of trees down in the village. Large hail was also observed with some of the supercell storms, with up to golf ball sized hail (1.75†diameter) reported in Richford, Vermont around 7 PM.
Multiple thunderstorms tracking across the same area - also known as “training thunderstorms†- resulted in localized heavy rainfall during the evening hours from southeastern Chittenden county east-northeastward across Washington into Caledonia counties in central and northeast Vermont. With already saturated ground conditions, the 1 to 2 inches of observed rainfall in these areas was sufficient to cause localized flash flooding in Bolton/Nashville, Vermont and a landslide on the south end of Lake Willoughby affecting Route 5A in Westmore, Vermont.
Lastly, saturated soil conditions also enhanced damage in the form of uprooted trees owing to strong westerly gradient winds, which occurred after the thunderstorms and a strong cold front swept through the region during the late evening and into the overnight hours Friday night. Strong low pressure passing north of the St. Lawrence river and steep low-level lapse rates resulted in the widespread high winds, especially across northern New York. Some observed wind gusts included 79 mph at the New York State mesonet site in Malone, and 64 mph at the Massena airport. Post-frontal wind gusts also locally exceeded 50 mph across Vermont during Friday night, but were generally not quite as intense as across northern New York.
This write-up is organized as follows: section 2 will describe the pre-storm environment including synoptic and mesoscale conditions. In section 3, some of the significant radar signatures associated with the severe thunderstorms are described. Section 4 analyzes the flash flooding, while section 5 focuses on the strong post-frontal gradient winds. A concluding summary appears in section 6.
Pre-Storm Environment
In the pre storm environment section we will first start by reviewing the Day 1 Outlook issued by the Storm Prediction Center (SPC) leading up the event. Figure 1 below shows the SPC Day 1 categorical outlook (left image), Day 1 tornado outlook (2nd image from left), Day 1 wind outlook (3rd image from left) and Day 1 hail outlook (right image) on 04 May 2018 at 4:00 PM. All of the BTV northern New York County Warning Area (CWA) was in a “moderate†risk for severe thunderstorms, with an “enhanced†risk in Vermont. From SPC, a moderate risk implies well-organized and widespread severe thunderstorms are expected. This risk is usually reserved for days with several supercells producing intense tornadoes and/or very large hail, or an intense squall line with widespread damaging winds, which was expected for our forecast area. The probabilistic wind forecast from SPC, showed a 45% chance of severe thunderstorm winds (≥ 58 mph) within 25 miles of a given point during the outlook period across northern New York and 30% over central and northern Vermont. The tornado probability was 10% for all of northern New York into northern Vermont. This meant that there was a 10% probability of tornadoes occurring with 25 miles of any point within that probability area.
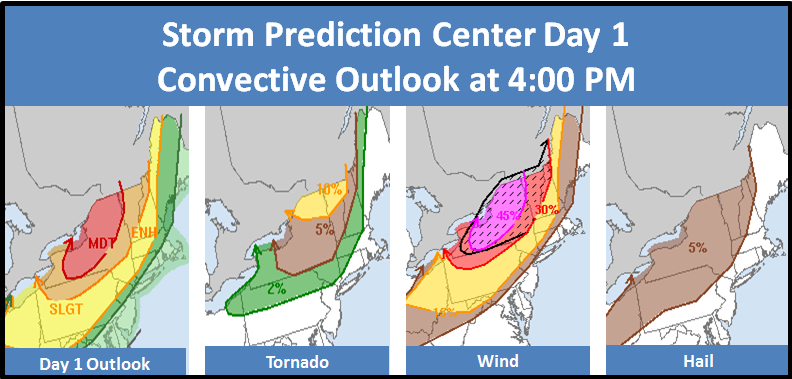
Figure 1: The Storm Prediction Center (SPC) Day 1 categorical outlook (left), SPC Tornado Outlook (2nd from left), SPC Wind Outlook (3rd from left), and SPC Hail Outlook (right) issued at 4:00 PM on 4 May 2018. [click to enlarge]
The Buffalo, New York (BUF) sounding on 4 May 2018 at 2:00 PM (Figure 2) showed moderately favorable thermodynamic environment in place for severe convective storms, with mid afternoon surface based CAPE values approaching 1000 J kg-1. Furthermore, the Buffalo sounding showed surface to 6km shear of 59 knots and extremely fast storm motion vectors of 60 knots from the southwest. This shear was a result of the approaching mid/upper level trough and the embedded low to mid jet streak of 45 to 65 knots. Thunderstorms tend to become more organized and persistent as vertical shear increases. Supercells and organized convection, such as squall lines with bow echoes are commonly associated with vertical shear values of 35-40 knots and greater through this depth. Given the lack of significant CAPE profiles widespread severe hail was not expected. However, the strong vertical shear profiles and potential for supercell storms implied some severe hail could be expected, as is always the case with long-lived rotating updrafts. As temperatures warmed into the 60s and 70s, the mixing improved, helping to create an environment favorable for transporting stronger winds aloft to the surface associated with thunderstorm convection.
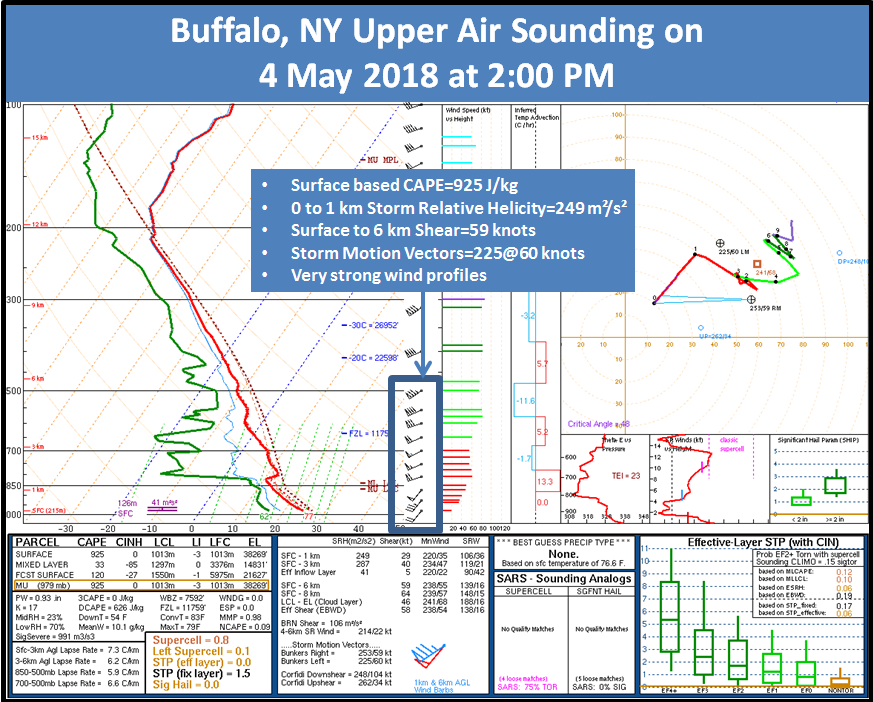
Figure 2: Upper air sounding from Buffalo, NY at 2:00 PM on 4 May 2018. [click to enlarge]
Figure 3 below shows the 300 hPa (lower left) (35,000 feet above ground level) upper air analysis on 4 May 2018 at 8:00 PM. A potent 145 knot jet was lifting northeast across western NY and southern Canada, placing our northern CWA in the left front quadrant of favorable upper level divergence. These winds aloft helped to promote deep-layer ascent across northern New York into Vermont on the evening of May 4th, for the development of tall thunderstorms capable of producing severe weather, especially damaging winds.
The 500 hPa (lower right) (20,000 feet above ground level) showed a potent short wave trough across the western Great Lakes, with a ribbon of enhanced winds greater than 80 knots lifting from the Ohio Valley into the northeast United States, on 4 May 2018 at 8:00 PM. This shortwave trough and classic upper level divergent pattern, helped to produce large-scale lift for thunderstorm development, while the stronger winds aloft aided in the organization of storms and provided the severe wind threat across the WFO BTV CWA.

Figure 3: The 300 hPa (left) and 500 hPa (right) upper air analysis on 4 May 2018 at 8:00 PM., Isotach (dark blue >75 knots, lighter blue >100 knots, and lightest blue >125 knots, streamlines (black), wind barbs, (plotted in blue, 1 pennant=50 knots, 1 barb=10 knots, 1/2 barb=5 knots), 500 hPa heights (black lines), and temperatures (dotted red). [click to enlarge]
Figure 4 below shows a complex warm front bisecting WFO BTV CWA from west to east on the evening of May 4th. The forcing associated with this boundary, along with some elevated instability helped to produce isolated supercells ahead of the approaching cold front over western New York. These discrete, mini supercells featured isolated large hail and scattered damaging winds across northern New York into Vermont. Meanwhile, a broken line of thunderstorms with damaging winds occurred along the surface cold front as it swept quickly eastward across our forecast area. Temperatures ahead of the cold front were mainly in the 70s (high of 79oF at BTV). Dewpoints were in the upper 50s to lower 60s, creating just enough instability when combined with the extremely strong shear and upper level dynamics to produce several rounds of severe convection across the WFO BTV CWA.
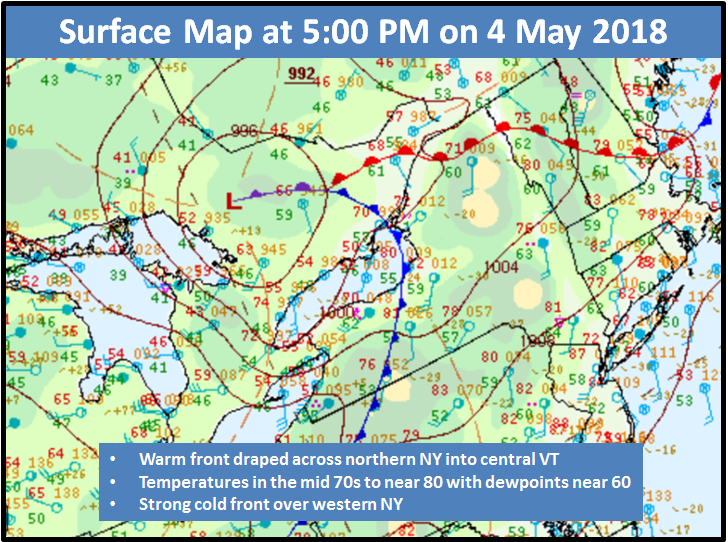
Figure 4: Surface map analysis with surface plots, mean sea level pressure (orange lines), cold front (blue line with triangles), and warm front (red half circles at 5:00 PM on 4 May 2018. [click to enlarge]
By utilizing the 1 minute GOES-16 satellite data forecasters can quickly and easily determine the location of the strongest updrafts and associated vertical development. Figure 5 below shows a visible satellite image at 7:12 PM, highlighting a broken line of towering cumulonimbus clouds stretching from north-central VT into the eastern Adirondacks. The eastern side shadows indicated the vertical development in the clouds, as the sun was setting on the western horizon, which is highlighted by the red circles in the image below. Also, clearing skies earlier in the afternoon across northern NY and parts of central and northern VT helped to destabilize the atmosphere just enough to support organized convection.
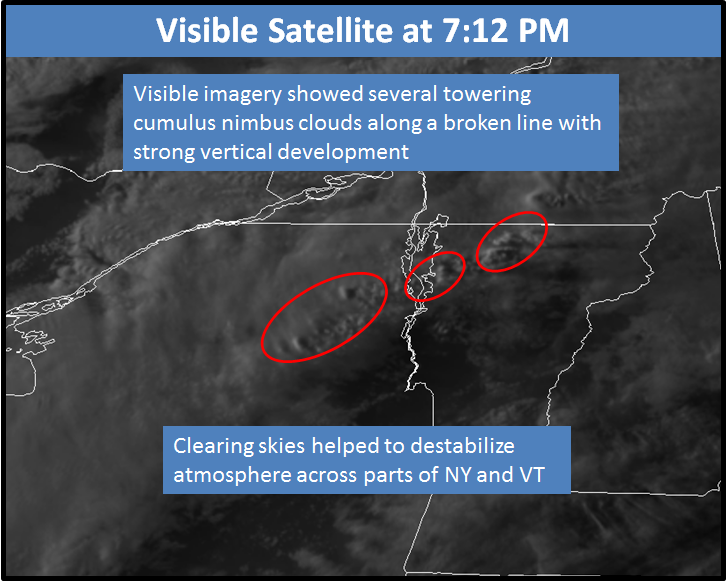
Figure 5: GOES-16 visible satellite image, 7:12 PM on 4 May 2018. [click to enlarge]
The left image in Figure 6 below shows the SPC Supercell Composite Parameter. The Supercell Composite Parameter is a multiple ingredient composite index that includes effective storm-relative helicity, most unstable CAPE, and effective bulk wind difference. Each ingredient is normalized to supercell "threshold" values, and larger values of SCP denote greater "overlap" in the three supercell ingredients. Only positive values of SCP are displayed, which correspond to environments favoring right-moving (cyclonic) supercells. The Supercell Composite Parameter showed extremely high values of 6 to 8 across our region, indicating an environment very favorable for cyclonic supercells.
In addition, figure 6 shows Rapid Refresh (RAP) (lower right) analysis of most unstable CAPE, 0 to 6 km effective shear, and convective inhibition (CIN) from SPC on 4 May 2018 at 5:00 PM. As the low to mid-level jet approached the region the deep layer shear increased to between 50 and 70 knots, while modest CAPE values ranged between 500 and 1000 J kg-1 across northern New York into Vermont. Note, the best combination of deep layer shear and modest instability (CAPE) was located across northern New York, but shifted into central and northern VT as clearing/destabilization occurred and closely matches the region of greatest concentration of wind damage. This very dynamic high shear/modest CAPE pre-storm environment was conducive for organized and persistent convection to develop, capable of producing damaging winds associated with mini supercells and bow echo storm structures.
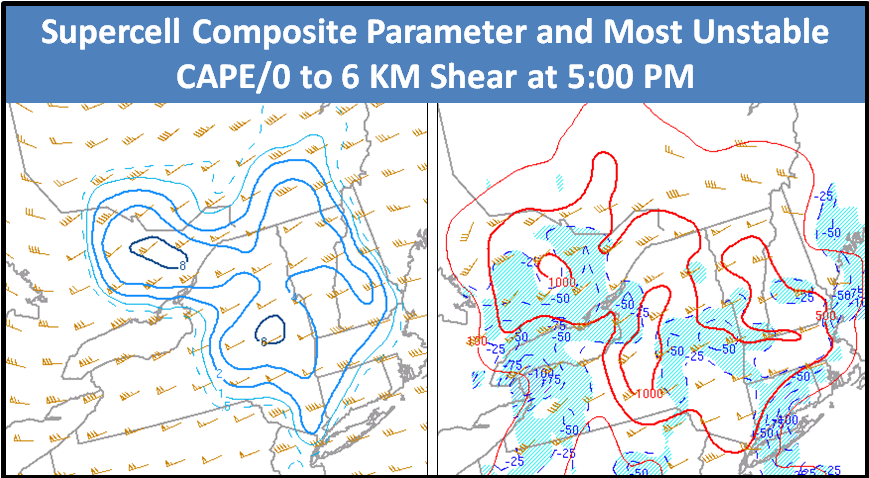
Figure 6: Storm Prediction Center Rapid Refresh (RAP) mesoanalysis of Supercell Composite (left) with Bunker Storm Motions (orange wind barbs) and Most Unstable CAPE (red lines), Convective Inhibition (CIN) (light blue fill), and effect bulk shear > 25 knots (orange wind barbs) at 5:00 PM on 4 May 2018. [click to enlarge]
Radar Interrogation
In this section we will examine the convective evolution and mode of storms that impacted the North Country, while interrogating several severe weather radar signatures. The storms we will explore include the following: large hail near Potsdam, NY, downburst wind signature near Airport Park in Colchester, VT, mini-supercell near Richford, VT, two microbursts in Shelburne, VT, a Quasi-Linear Convective System (QLCS) over central VT, and several bow echo structures near Stowe and over eastern Vermont on the evening of 4 May 2018.
The image below shows a mosaic composite reflectivity loop from 5:00 PM to 9:30 PM
on 4 May 2018. Initially, the reflectivity imagery shows several discrete mini supercells moving from northern New York into sections of northern Vermont between 6:10 and 7:20 PM as a warm front lifted across the region. Meanwhile, an organized line of severe thunderstorm wind gusts developed with multiple bowing line segments, along a surface cold front later in the evening. These convective modes produced widespread damaging winds and isolated large hail.
Figure 7: Mosaic composite reflectivity loop from 5:00 PM to 9:30 PM on 4 May 2018. [click to enlarge]
The first storm we will explore is a mini supercell near Potsdam, New York. The image below shows the KTYX reflectivity cross section at 4:37 PM on 4 May 2018. This storm produced over 1 inch diameter hail near Potsdam, along with some tree and powerline damage across central Saint Lawrence County. The cross section indicates a storm top of 40,000 feet, with 60 dBZ to 21,000 feet, supporting strong updrafts and the potential for large hail. In addition, the west to east tilt of the 50 to 60 dBZ core suggests very strong mid level westerly winds were impacting this storm, with the potential for damaging wind gusts with any convective downdraft.
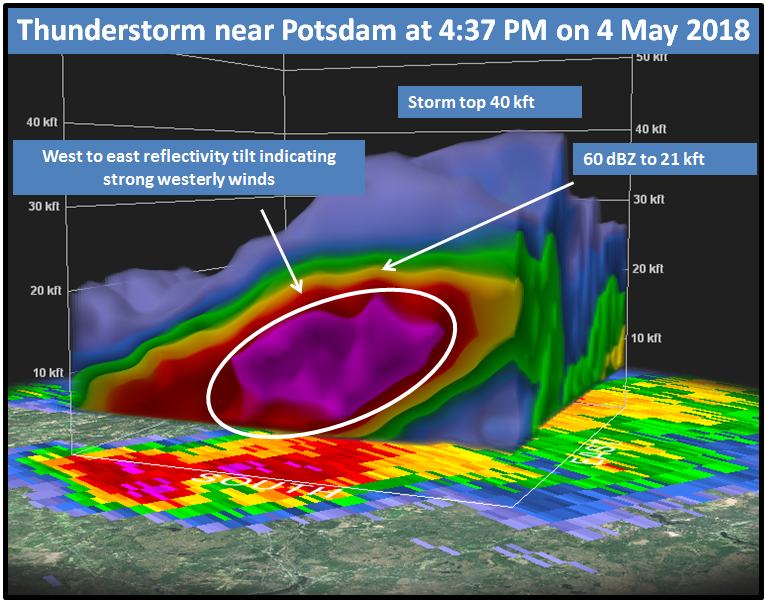
Figure 8: KTYX reflectivity cross section near Potsdam, NY at 4:37 PM on 4 May 2018. [click to enlarge]
This storm had a max VIL of 72 kg/m² and storm top of 40,000 feet near Potsdam. VIL is an estimate of the total mass of precipitation in the clouds. The measurement is obtained by observing the reflectivity of the vertical column as obtained by radar. This measurement is usually used in determining the size of hail, the potential amount of rain under a thunderstorm, and the potential downdraft strength when combined with the height of the echo tops. When VIL values quickly fall, it may mean that a downburst is occurring, a result of a weakening of the storm's updraft and the storms inability to hold the copious amounts of moisture/hail within the storm's structure. This means greater potential for the storm to produce damaging winds as the downburst descends to the surface. Figure 9 shows VIL (pink/purple and white color) values between 65 and 75 kg/m² south of Potsdam, New York. This indicates a very well developed updraft, which produced 1.25†diameter hail near Potsdam. This mini-supercell storm continued to track northeast and produced 1.75†diameter hail in Richford, VT later in the evening.
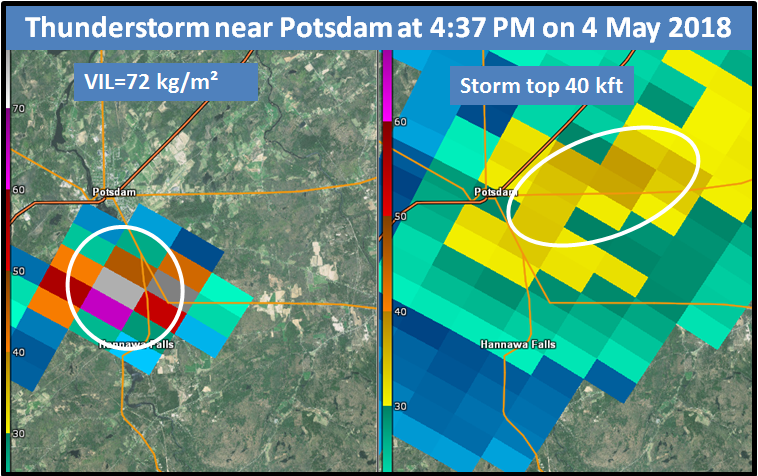
Figure 9: KTYX VIL (left) and Storm Top (right) near Potsdam, NY at 4:37 PM on 4 May 2018. [click to enlarge]
Figure 10 below shows KCXX 0.5° reflectivity (left) and 0.5° velocity (right) at 6:47 PM of a collapsing thunderstorm near Airport Park in Colchester, Vermont. The velocity shows inbound winds of 60 to 70 knots (blue/purple color) coming toward the KCXX radar only 300 feet above the ground, co-located with a very strong reflectivity core of 55 to 65 dBZ (red/pink color). This radar velocity signature supported damaging wind gusts over Colchester Point. Trees and powerlines were reported down, as strong winds aloft were transported to the surface in the collapsing reflectivity core.
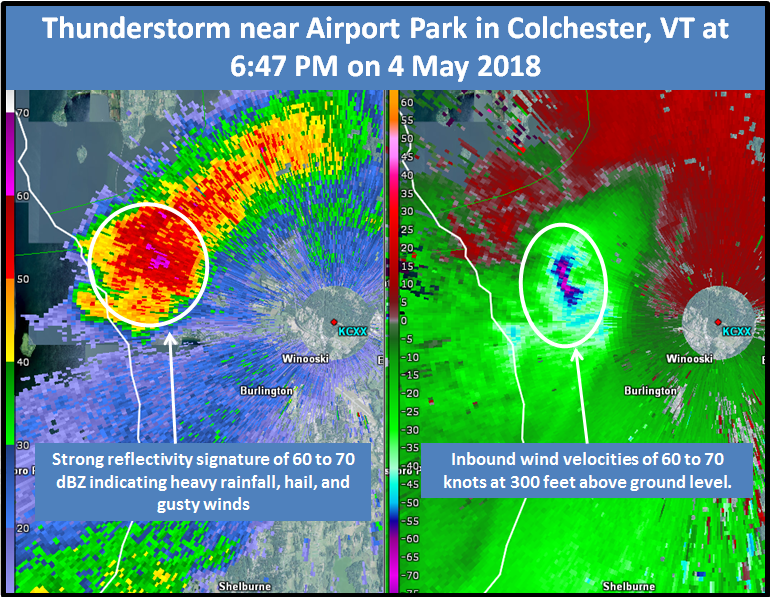
Figure 10: KCXX 0.5° reflectivity (left) and velocity (right) near Airport Park in Colchester, VT at 6:47 PM on 4 May 2018. [click to enlarge]
The mini supercell thunderstorm that impacted Potsdam earlier in the evening continued to track along a warm front and produced additional large hail in Richford, VT. Figure 11 below shows the KCXX reflectivity cross section at 6:55 PM and associated storm structure. A well defined Bounded Weak Echo Region (BWER) is present and the Echo Top (ET) of this particular storm was around 38,000 ft. The storm’s updraft remained strong, with 55 to 65 dBZ reflectivity core extending upward to 27,000 ft. In Figure 11, note how the strongest reflectivity core is elevated above an area where radar echoes are weak to non-existent. It is this region that is referred to as a BWER. Meteorologists can infer that the updraft is so strong that it is able to suspend rain and/or hail aloft, and not fall to the ground (hence, the lack of echo returns below the strong reflectivity core). Storms that have this particular signature are capable of producing severe weather. The reflectivity structure of this mini supercell featured forward flank and rear flank descending reflectivity core, which featured heavy rainfall, high winds, and large hail. The updraft/downdraft interaction on the southwest flank of the storm would be the favorable location of a potential tornado if shear and instability parameters and terrain were favorable.
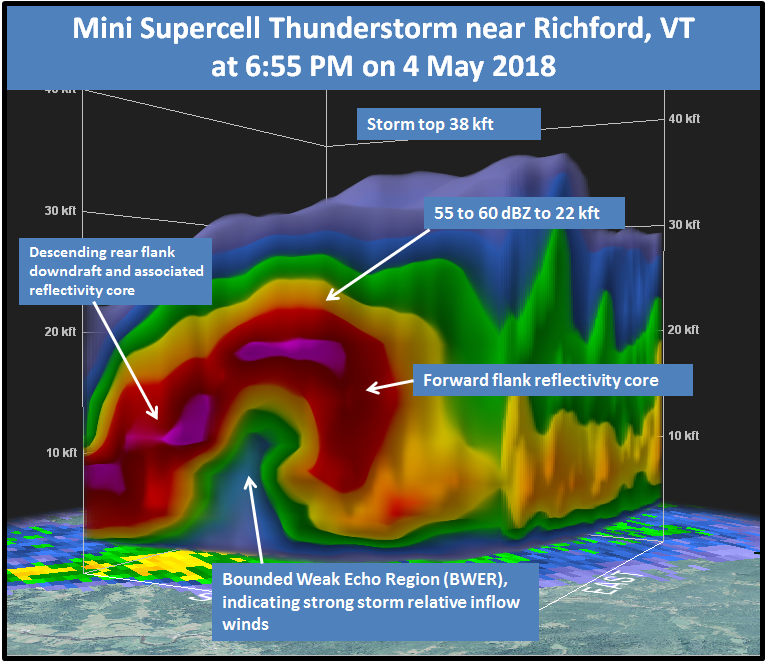
Figure 11: KCXX reflectivity cross section near Richford, VT at 6:55 PM on 4 May 2018. [click to enlarge]
This mini supercell thunderstorm did exhibit a hook like feature near Richford, VT with a tight mid level cyclonic rotational couplet. Figure 12 shows KCXX 1.8° base reflectivity (left) and storm relative velocity (right) image below. The east-west orientation of the Missisquoi River Valley helped to enhance the low level storm relative inflow and created an environment favorable for some rotation and the potential for a brief spin up. However, as this inbound/outbound couplet quickly tracked east and interacted with the Green Mountains near Jay Peak, the low level rotation was disrupted, along with any potential threat of a tornado.
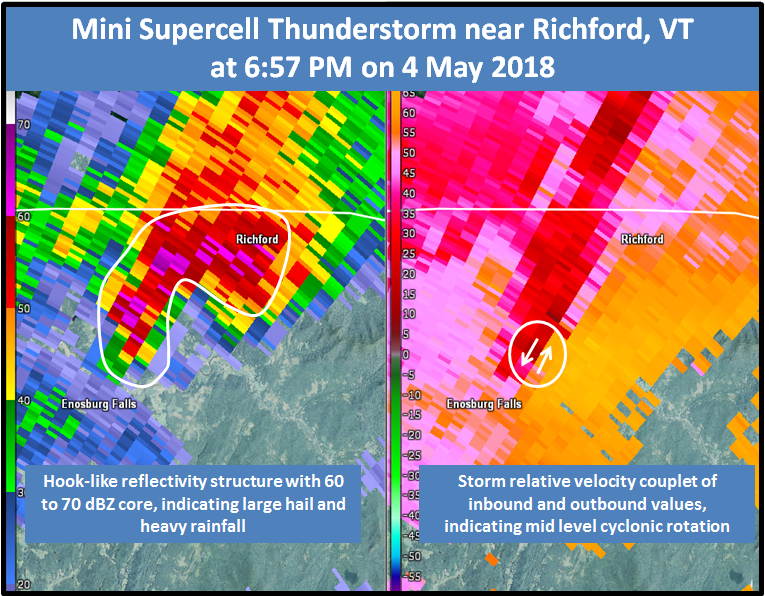
Figure 12: KCXX 1.8° reflectivity (left) and storm relative velocity (right) near Richford, VT at 6:57 PM on 4 May 2018. [click to enlarge]
During the evening of May 4th, Shelburne, VT received two powerful thunderstorms that produced scattered trees and power outages throughout the town, along with 1.50†diameter hail. The first thunderstorm impacted the area around 7:06 PM with several interesting radar signatures. Figure 13 shows KCXX 0.5° reflectivity (left) and storm relative velocity (right). This included a pure divergence wind signature on the forward flank, with another enhanced area of inbound winds of 55 to 65 knots (blue/purple color) associated with a descending reflectivity core of 60 to 65 dBZ (red/purple color). In addition, figure 13 shows a tightening south flank reflectivity gradient, along with a board cyclonic rotational couplet of inbound and outbound velocities.
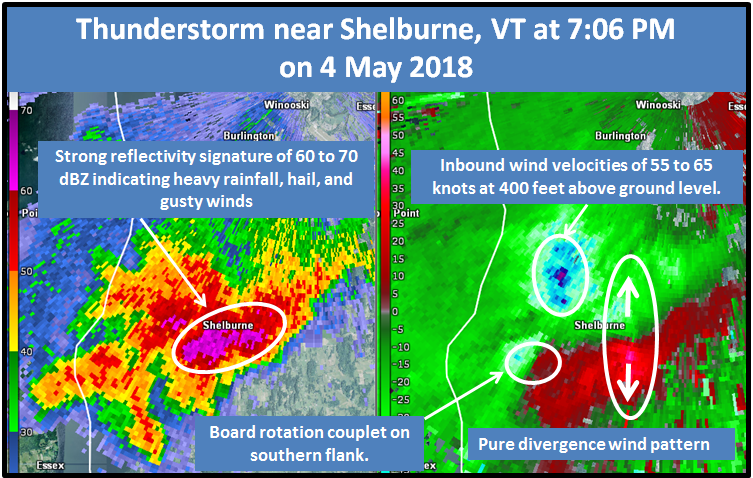
Figure 13: KCXX 0.5° reflectivity (left) and velocity (right) near Shelburne, VT at 7:06 PM on 4 May 2018. [click to enlarge]
The 2nd severe thunderstorm impacted the Shelburne area around 7:25 PM on 4 May 2018. Figure 14 below shows the KCXX 0.5° reflectivity (right) and velocity (left) at 7:25 PM. Similar to the previous storm this cell included a very strong reflectivity core of 50 to 60 dBZ (red/purple colors), along with a pure divergence wind pattern about 400 feet above the surface. This suggested a collapsing microburst with large hail and damaging winds, which occurred in the town of Shelburne, especially southern sections. Inbound wind velocities were 55 to 60 knots with outbound values around 25 to 30 knots.
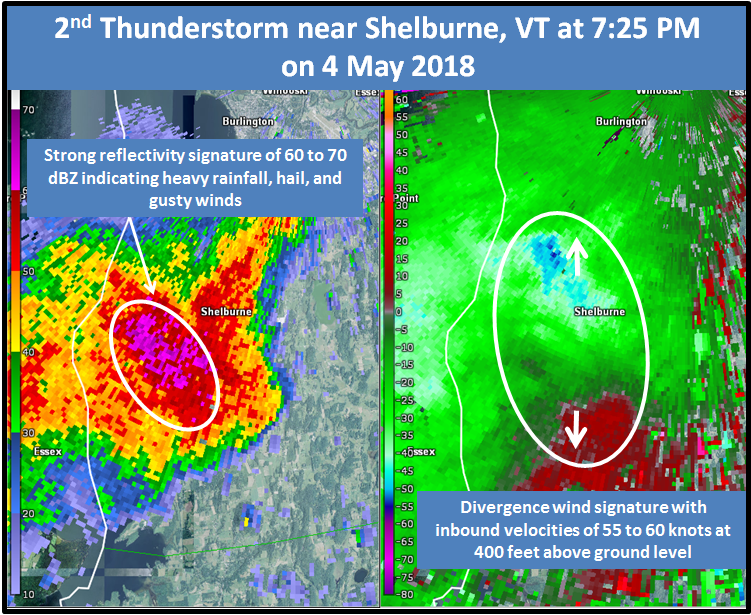
Figure 14: KCXX 0.5° reflectivity (left) and velocity (right) near Shelburne, VT at 7:25 PM on 4 May 2018. [click to enlarge]
As is common with lines of convection in high shear and moderately unstable environments, evaporatively cooled air stemming from heavy rainfall creates a mesoscale cold pool, which induces strong pressure gradients and accelerates the convective line. The convective cells across the Champlain Valley evolved into a line with several embedded bow echo segments across central and eastern Vermont.
Figure 15 shows the KCXX 1.4° reflectivity (left) and velocity (right) near Stowe, VT at 7:40 PM. The direction of the highest winds occur perpendicular to the convective line, or from the west, in this case below. The average forward speed of the bow echo was near 45 knots (55 mph) across central VT, with the apex of the bow moving up to 55 knots across that region. The forward speed of linear convective structures typically provide a rough estimate of the associated surface winds, and the forward motion met NWS severe criteria of 50 knots in this case. Of course, Doppler velocity data is also utilized to remotely sense wind speeds within convective storms. Since the Doppler radar measures the speed of reflectors (e.g., raindrops) toward or away from the radar, the best velocity estimates occur when the line motion is perpendicular to the radar beam. In this event, the line moved down the radial of the KCXX radar, located in Colchester, VT and provided excellent sampling of the velocity data above the beam blockage issues associated with Mount Mansfield. The KCXX radar, observed Doppler velocities were near 60 knots at 5000 feet AGL near Stowe (See Figure 15 below). This bow echo structure produced numerous areas of trees and power lines down in the Stowe area on the evening of May 4th.
Other structures that prompted forecasters to the severity of this bow echo included: (1) a sharp reflectivity gradient on the leading edge of the bow echo, and (2) weak echo channels on the upstream side of the bow, an indication of a descending rear inflow jet that is resulting in locally enhanced winds along the line (See figure 15 below).
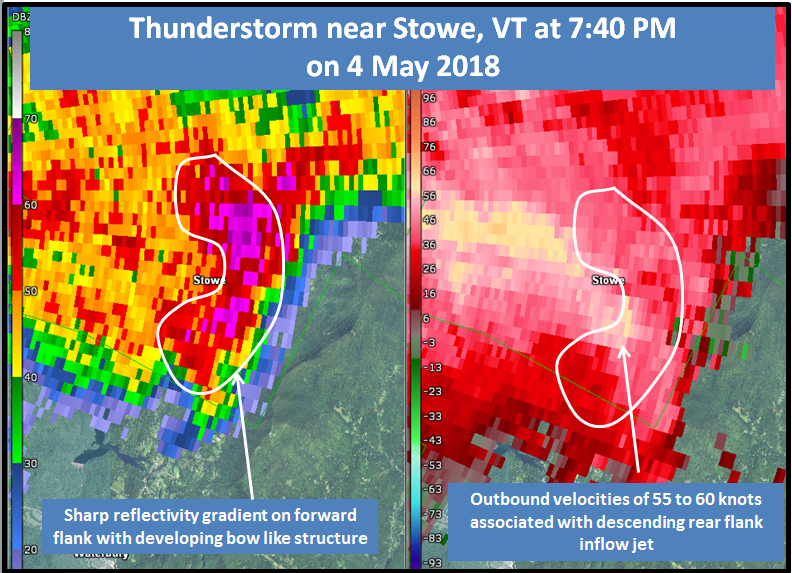
Figure 15: KCXX 1.4° reflectivity (left) and velocity (right) near Stowe, VT at 7:40 PM on 4 May 2018. [click to enlarge]
The next interesting radar signature observed during the evening of May 4th occurred within a Quasi-Linear Convective System (QLCS) reflectivity structure over central VT at 8:24 PM. This QLCS featured several embedded reflectivity notches, co-located with a rotational couplet. The image below shows KCXX 0.9° reflectivity (left) and storm relative velocity (right) at 8:24 PM. The cyclonic rotational couplet developed as the linear line interacted with the higher terrain of the Green Mountains over eastern Addison County, indicating the potential for several brief spin ups along the developing bowing segment. This line was moving at 50 to 60 mph and produced scattered trees and power lines down throughout central VT. This larger scale bow had a sharp reflectivity gradient on forward flank, along with several embedded weak echo channels on the upstream side of the bow, suggesting a descending rear inflow jet resulting in locally severe winds along the line.
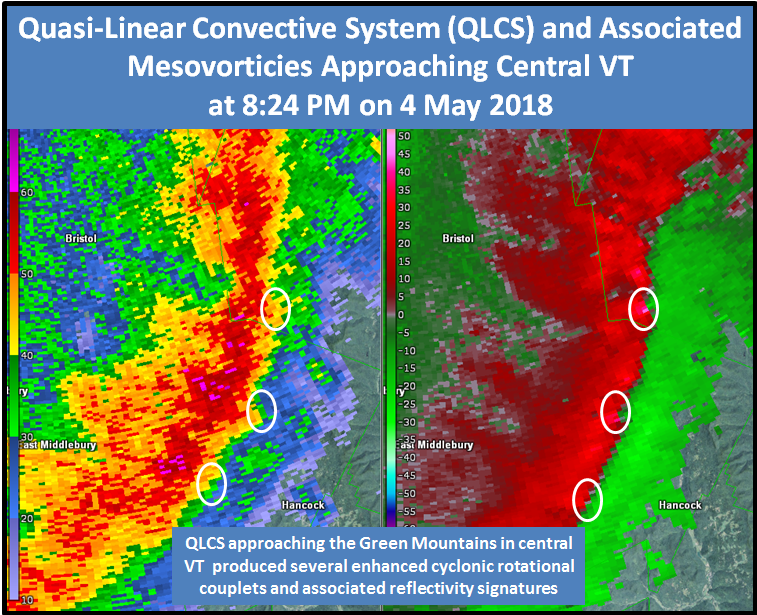
Figure 16: KCXX 0.9° reflectivity (left) and storm relative velocity (right) across central, VT at 8:24 PM on 4 May 2018. [click to enlarge]
The QLCS continued to feature several enhanced bow like reflectivity structures over eastern Vermont as embedded individual cells moved at 50 to 60 mph. Similar to the previous couple of images, the radar imagery below shows several weak echo channels on the back side of the bow, indicating the potential for a strong descending rear inflow jet and associated wind damage. In addition, the sharp leading edge reflectivity gradient, combined with very fast storm motions, suggested a high potential for damaging winds across this area. Figure 17 below shows the 1.9° reflectivity (left) and velocity (right) from KCXX radar at 8:56 PM on 4 May 2018.
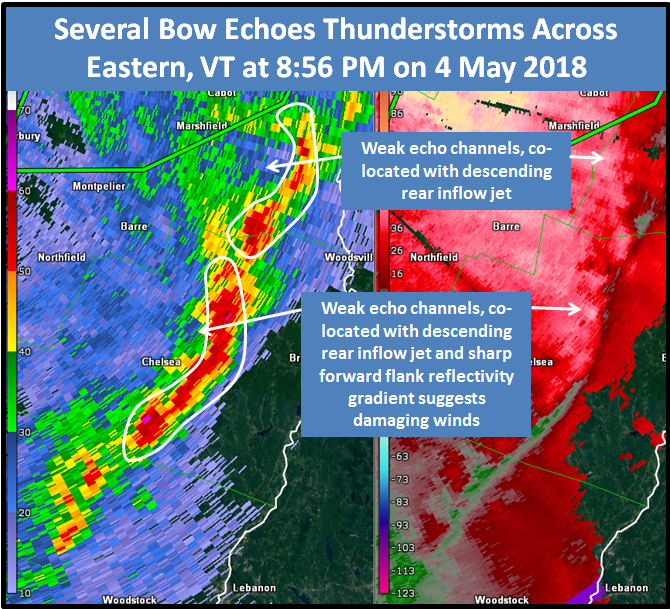
Figure 17: KCXX 1.9° reflectivity (left) and velocity (right) across eastern, VT at 8:56 PM on 4 May 2018. [click to enlarge]
Hydro Review
The image below shows the RAP 13 precipitable water analysis (left image) and 850 hPa moisture transport and associate theta-e analysis (right image) on 4 May 2018 at 5:00 PM. The analysis showed precipitable water value of 1.40 inches, suggesting the potential for thunderstorms to produce localized very heavy rainfall. Precipitable water is the depth of the amount of water in a column of the atmosphere if all the water in that column were precipitated as rain. Values greater than 1.2 inches, suggests a greater potential for heavy rainfall, especially during the summertime.
From SPC, the 850 mb moisture transport is the product of the wind speed (m/s-1) and the mixing ratio (g g-1) at 850 mb. Values are scaled by factor of 100, such that a 40 kt (~20 m/s-1) wind speed and a 12 g kg-1 mixing ratio (0.012 g g-1) results in a moisture transport of 24 m/s-1 (the first pink shade in the color fill). High values of moisture transport have been related to heavy rainfall potential with convective systems, which was observed across our CWA on the evening of May 4th. This product did well highlighting two areas of heavy rainfall potential, first associated with warm front lifting across central VT, followed by the second associated with approaching cold front over western NY. Both boundaries featured thunderstorms with localized very heavy rainfall rates, which caused minor flash flooding.
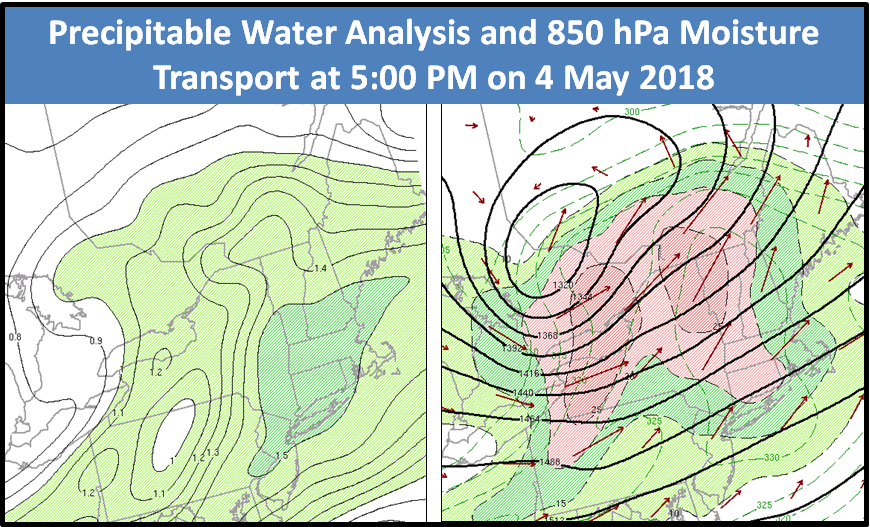
Figure 18: Precipitable water analysis (left) and 850 hPA moisture transport (color fill and vectors), height analysis (black lines), and theta-e (dashed green lines) at 5:00 PM on 4 May 2018. [click to enlarge]
Figure 19 shows the mesoscale precipitation discussion across the Northeast United States, highlighting localized hourly rainfall rates up to 1 inch - which combined with snowmelt and saturated soil - could pose a flash flood threat through the evening hours on May 4th. The discussion mentioned elevated convection was forming along a surface warm front from northern New York into Vermont and was tapping precipitable water values of 1.25 inches and 500 to 1000 J kg-1 of CAPE to produce thunderstorms with localized very heavy rainfall rates. This environmental setup, combined with snowmelt over the higher elevations and saturated soils from previous rainfall produced 1 hour flash flood guidance values near 1 inch across parts of our region. This means if any river basin received up to 1 inch in a hour or less, flash flooding would be possible.
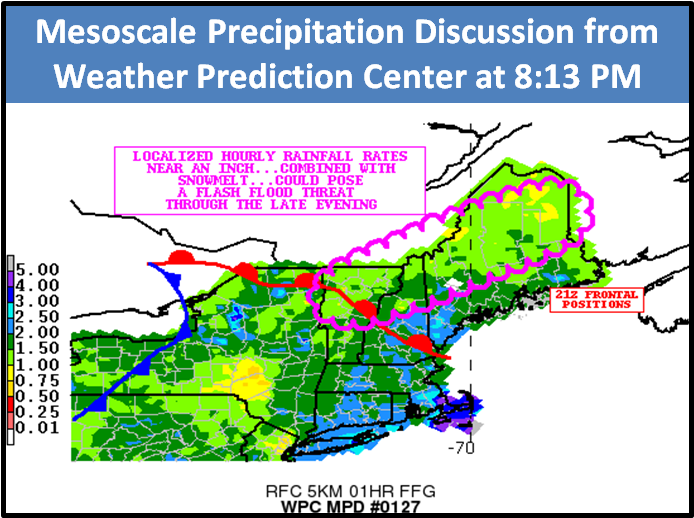
Figure 19: Mesoscale precipitation discussion from the Weather Prediction Center (WPC) with River Forecast Center (RFC) 5km 1 hour flash flood guidance (colorized image) at 8:13 PM on 4 May 2018. [click to enlarge]
Figure 20 below shows the 24 hour precipitation totals ending at 7:00 AM on 5 May 2018. Multiple rounds of thunderstorm with localized heavy rainfall produced observed storm total precipitation amounts across central VT of 0.75 to 1.5 inches. While these amounts are not “off the chart†high, it was just enough combined with saturated soils, snow melt, and very high rainfall rates to produce some minor flash flooding near Nashville, VT and a landslide along Route 5A on the south side of Lake Willoughby, VT.
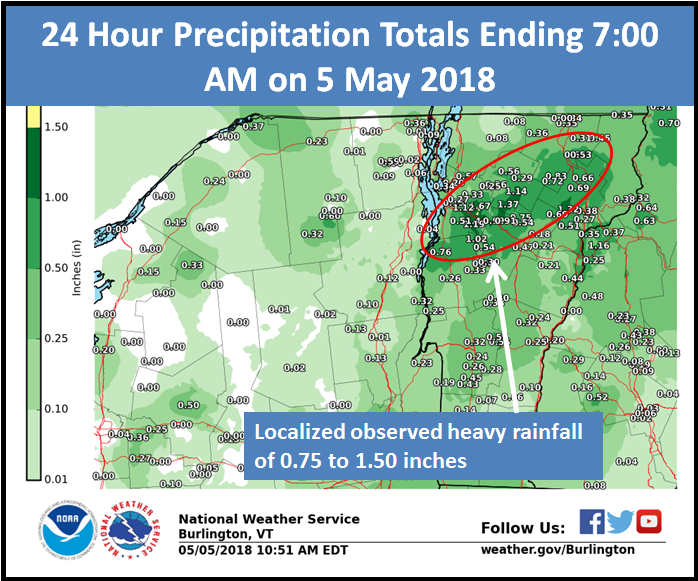
Figure 20: 24 hour precipitation totals ending 7:00 AM on 5 May 2018. [click to enlarge]
High Wind Review
After several rounds of severe thunderstorms with large hail, damaging thunderstorm wind gusts, heavy rainfall, and frequent lightning, very strong post-frontal gradient winds developed across the North Country. Winds gusted to 64 mph at Massena, 68 mph at Plattsburgh, 79 mph at Malone, and 105 mph atop Whiteface Mountain. These winds caused widespread trees and powerlines to come down across Saint Lawrence, Franklin, Clinton, and Essex Counties in northern New York during the late evening hours of May 4th. Winds were generally between 35 and 45 mph with a few higher gusts in Vermont, as the core of strongest winds passed just to the north and west. Figure 21 shows the maximum observed wind gusts across the North Country during this event.

Figure 21: North Country observed maximum wind gusts on 4-5 May 2018. [click to enlarge]
The 8 PM upper air sounding from Buffalo NY showed a very strong low-level jet of 45 to 65 knots behind the cold front along with favorable mixing to about 4000 feet above ground level. These very strong wind profiles, combined with favorable atmospheric mixing under moderate low level cold air advection, produced widespread wind gusts between 50 and 70 mph across northern New York during the late evening hours on May 4th. These winds and saturated soils from previous rainfall created widespread wind damage with numerous uprooted trees and downed powerlines.
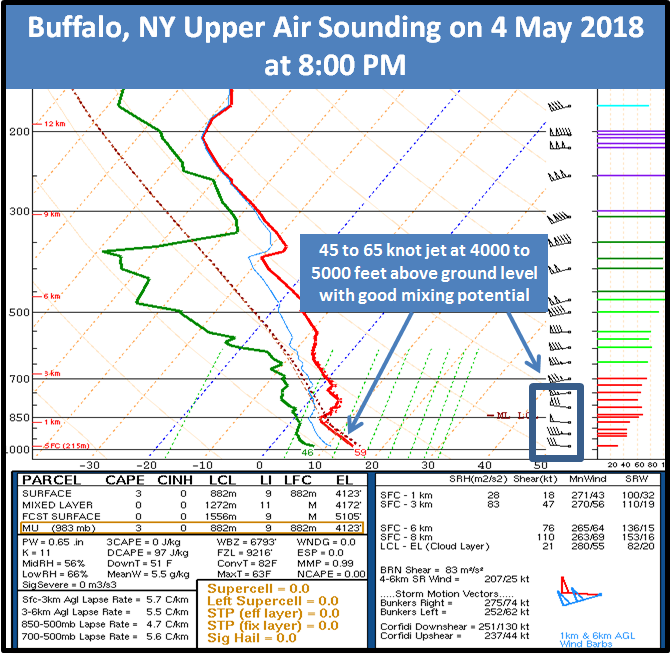
Figure 22: Buffalo, NY upper air sounding on 4 May 2018 at 8:00 PM. [click to enlarge]
The image below shows the RAP 850 hPa height and wind analysis valid at 8:00 PM on 4 May 2018. The different shades of purple in the image below indicates progged winds of 70 to 80 knots lifting across northern New York associated with potent shortwave energy north of the Great Lakes. These very strong winds mainly impacted northern New York and parts of Vermont and caused significant wind damage.
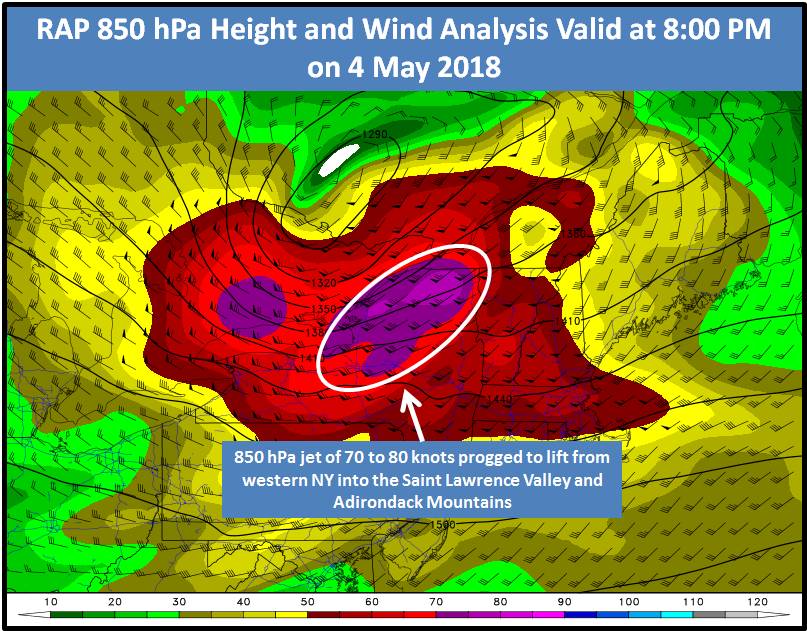
Figure 23: The RAP 850 hPa (4,500 feet above ground level) upper air analysis on 5 May 2018 at 8:00 PM. Wind barbs, (plotted in black, 1 arrow=50 knots, 1 barb=10 knots, 1/2 barb=5 knots), 850 hPa heights (black lines), and wind speeds (colored contours). [click to enlarge]
Conclusion
In summary, this was a multifaceted event resulting in several types of storm damage. First, a modest CAPE/high shear environment across northern New York and Vermont produced an unusually widespread severe thunderstorm event across the WFO BTV CWA during the late afternoon and evening hours on 4 May 2018. Storm structures ranged from mini-supercells to a well-defined QLCS with multiple bowing segments. While some large hail was reported (up to 1.75†in diameter), damage was caused primarily by microbursts and straight line winds. Though low-level shear was strong, the combination of modest CAPE (generally ≤ 1000 J kg-1) and the convective evolution precluded any tornadoes. The WFO BTV issued 15 severe thunderstorm warnings and subsequently received 41 reports of severe weather; a particularly active convective day for the region especially so early in the warm season.
The intensity of the shortwave trough that approached from the eastern Great Lakes region late in the afternoon helped initiate and sustain convective storms during the early evening hours. Combined with a strong cold front, this trough and a strong low-level jet also contributed to damaging gradient winds in the post-frontal air mass during the late evening hours after thunderstorms had moved out of the region. Some of these wind gusts exceeded 70 mph across northern New York. Combined with saturated soil conditions, many trees were uprooted and resulted in additional power outages during the overnight hours into Saturday morning (5 May 2018). The WFO BTV issued High Wind Warnings across northern New York and Wind Advisories in Vermont for these unusually intense post-frontal gradient winds.
Flooding on 4 May 2018 was less significant and more localized. However, several training thunderstorms yielded rainfall of 1†to 1.5†and resulted in a few reports of flash flooding from southeastern Chittenden county east-northeastward to the Northeast Kingdom. This localized flooding was contributed to by favorably moist antecedent soil conditions from prior rain and higher elevation snowmelt. The WFO BTV issued 2 Flash Flood Warnings during the event, subsequently capturing three reports of flash flooding.
References:
Radar imagery provided by GR2Analyst, Gibson Ridge Software Company
Figure 23 provided by College of Dupage Website: http://weather.cod.edu/forecast/?load=prun&prunType=2017121218-GFS-SGP-prec-ptype-312
Figures 1, 2, 3, 6, 18, and 22 provided by Storm Prediction Center Website:
http://www.spc.noaa.gov/exper/mesoanalysis/new/viewsector.php?sector=16

