 Email the authors
Overview
A major winter storm blanketed Vermont and northern New York with 10-20” of snow on 20-21 January 2019, with isolated totals near 21” across the eastern slopes of the Adirondacks in Essex County, New York (Fig. 1). The bulk of the snow fell on Sunday, January 20th. Aside from a brief mix of sleet and freezing rain across the southern half of Vermont (8am until noon EST on 20 January), precipitation fell as all snow across the region. The event crossed 3 calendar days at the Burlington International Airport (BTV), totaling 18.6” of snow, the 18th greatest storm on record, and 5th largest in January. Of that, 15.6” of snow fell on Sunday, January 20th, setting a new record for the date. Snowfall rates peaked at 2.4”/hr during the mid-morning hours on January 20.
The main impacts of the storm were travel related. Even at that, travel impacts were mitigated by the majority of the snowfall occurring late on a Saturday night into a Sunday morning, when overall traffic volume tends to be light. Snow ratios early in the storm were near 10:1, despite arctic air in place with below zero (Fahrenheit) surface temperatures. In fact, this was the “coldest” significant snowstorm in recent memory, with temperatures in the northern Champlain Valley below zero throughout much of the snowfall, and wind chill values near 20 below. A previous benchmark storm accompanied by cold temperatures, the Valentine’s Day Blizzard of 2007, had temperatures generally in the single digits above zero during that event. Despite the small snow-to-liquid ratios, the dry nature of the snow was not conducive to snow clinging on trees and powerlines. Thus, power outages were not a significant issue for this event.
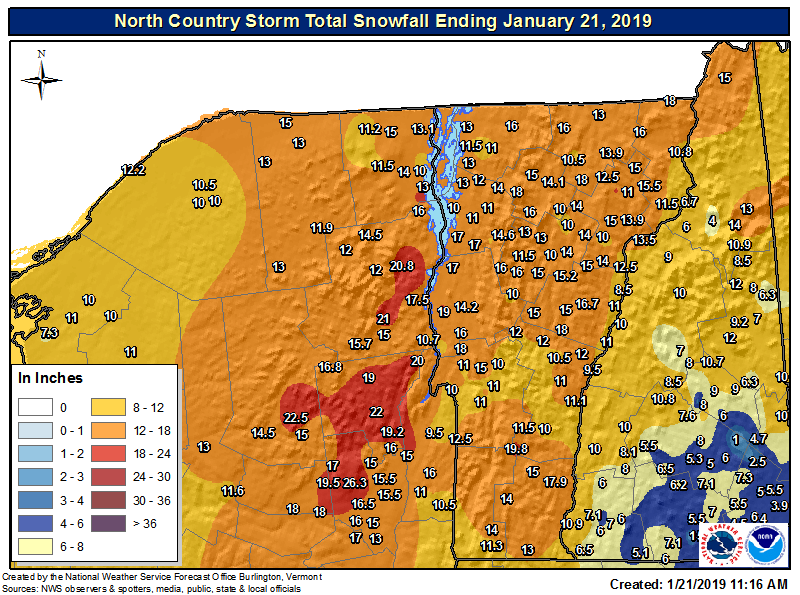
Figure 1: Storm total snowfall amounts 20-21 January 2019. [click to enlarge]
Synoptic Setup
The large-scale synoptic setup featured a 1034 millibar (mb) arctic high pressure anchored over eastern Canada, with temperatures -20⁰F to -30⁰F advecting toward northern New England on brisk north winds of 10 to 20 mph. Meanwhile, a 998 hPa low pressure was developing over the Ohio River Valley with very warm moist air moving north toward the Mid Atlantic states on the evening of 20 January 2019. Temperatures across the North Country ranged from the -5°F across the Saint Lawrence and northern Champlain Valleys to +10⁰F near Springfield, Vermont in the Connecticut River Valley. Figure 2 below shows the 00 UTC surface analysis on 20 January 2019.
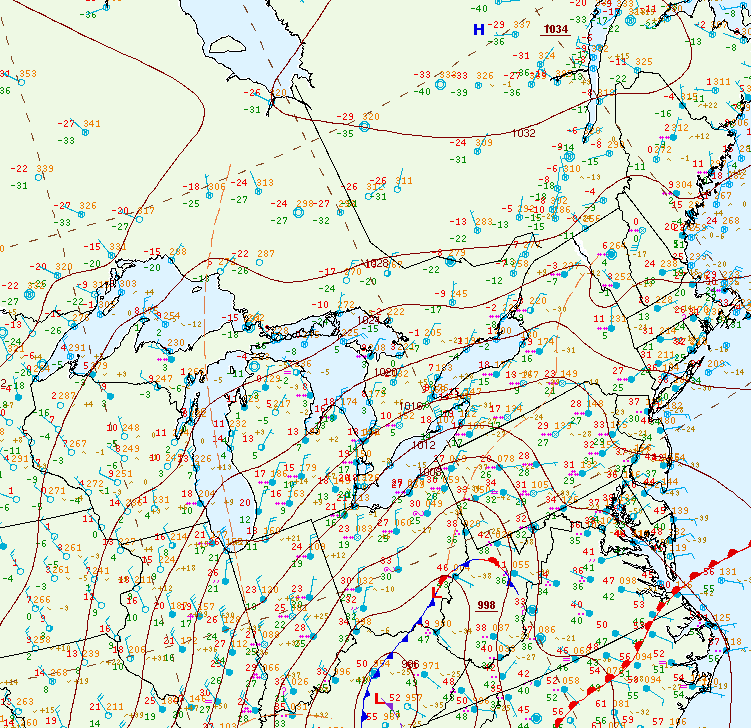
Figure 2: Surface analysis 00 UTC on 20 January 2019. [click to enlarge]
During the pre-dawn hours on January 20th, bands of light to moderate snow were lifting from south to north across most of central and northern New England, including the entire North Country with surface visibilities below 1 mile. The 12 UTC surface analysis placed 991 hPa low pressure northwest of Philadelphia, PA with a sharp coastal front extending into extreme southern New England. Meanwhile, the air mass was still extremely cold across the Saint Lawrence Valley into northern Vermont with temperatures only in the single digits, while readings warm into the mid-teens across portions of Rutland and Windsor counties. This extremely sharp thermal gradient, helped to enhance areas of moderate snowfall across the eastern Adirondacks into most of Vermont during the daytime hours on January 20th. Figure 3 below shows the 12 UTC surface analysis on 20 January 2019.
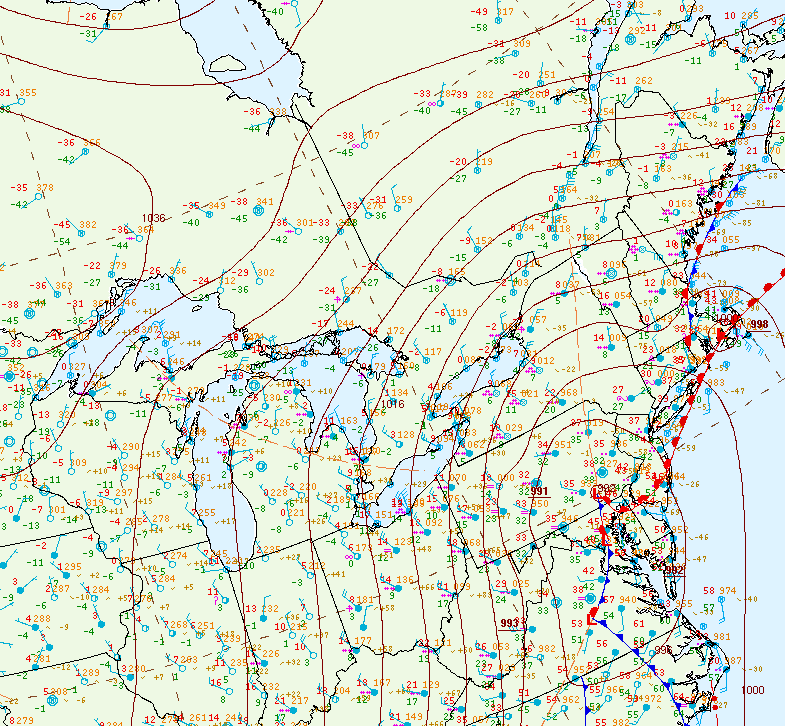
Figure 3: Surface analysis 12 UTC on 20 January 2019. [click to enlarge]
Figure 4 below is the 1200 UTC 20 January 2019 upper air sounding from Albany, New York, which was representative of the air mass advecting into northern New York and Vermont during this winter storm. Initially, the very cold air mass in place created snow ratio’s around 10:1, as the favorable dendrite growth zone was near the surface. However, favorable microphysical conditions developed as warming occurred between 850-700 hPa layer associated with southwest jet of 30 to 40 knots. This enhanced deep layer moisture, while expanding the favorable dendrite growth zone (-12C to -18C), resulting in enhanced snowfall rates and overall better “fluff factor”. Snow-to-liquid ratios early in the storm were around 10:1, and increased closed to 15-20:1 toward the later part of the storm. The warm nose around 800 hPa did push temperatures above 0C aloft, which caused some sleet to mix with the snow across southern Vermont on the morning of January 20th.
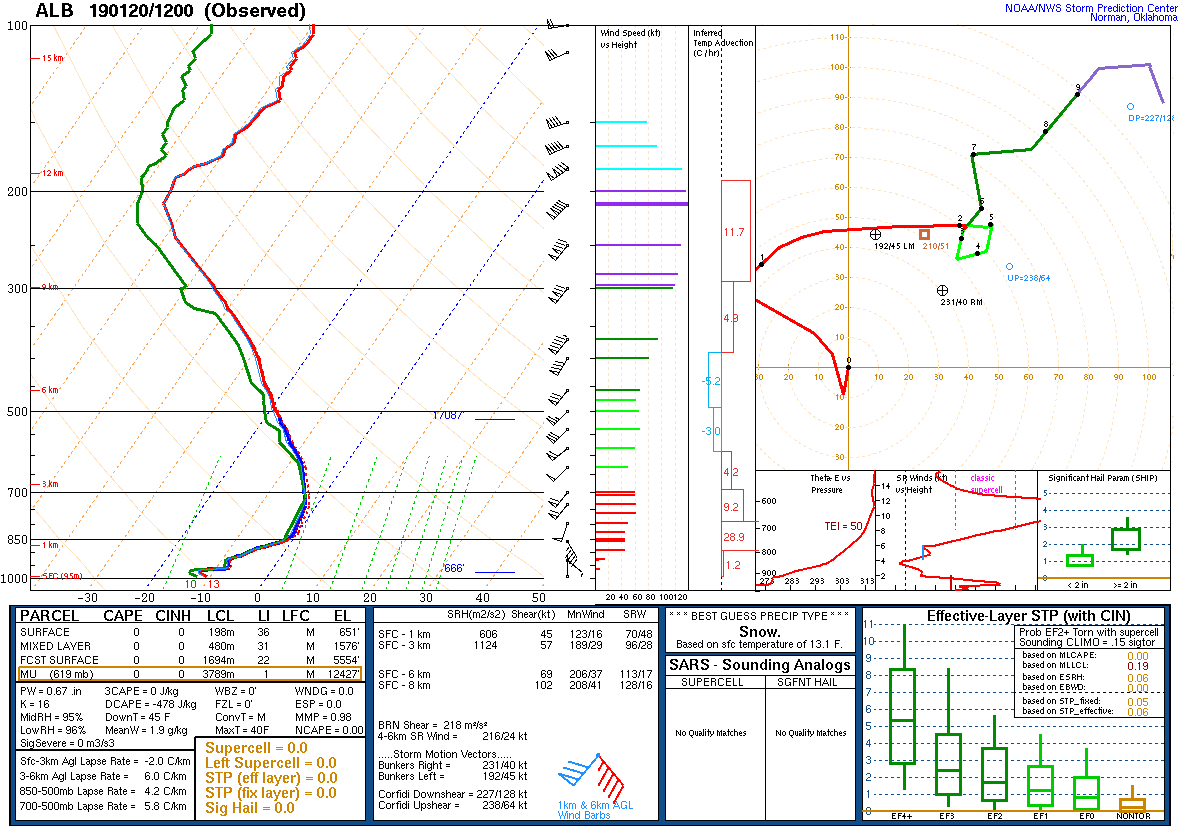
Figure 4: The 12 UTC 20 January 2019 sounding and associated analysis from Albany, NY. [click to enlarge]
At 250 hPa, a robust anticyclonic curved jet >175 knots was lifting across the Saint Lawrence Valley into eastern Canada, placing the North Country under the right rear quadrant, which created a well defined upper-level divergence signature with strong synoptic lift. Furthermore, the north-to-south orientation of the upper-level jet associated with a digging mid/upper-level trough across the Ohio Valley helped to advect deep sub-tropical moisture north into a very cold arctic air mass in place over northern New England. Figure 5 below highlights the potent 250 hPa jet over eastern Canada, along with the deep full latitude trough across the Ohio Valley during this significant winter storm.
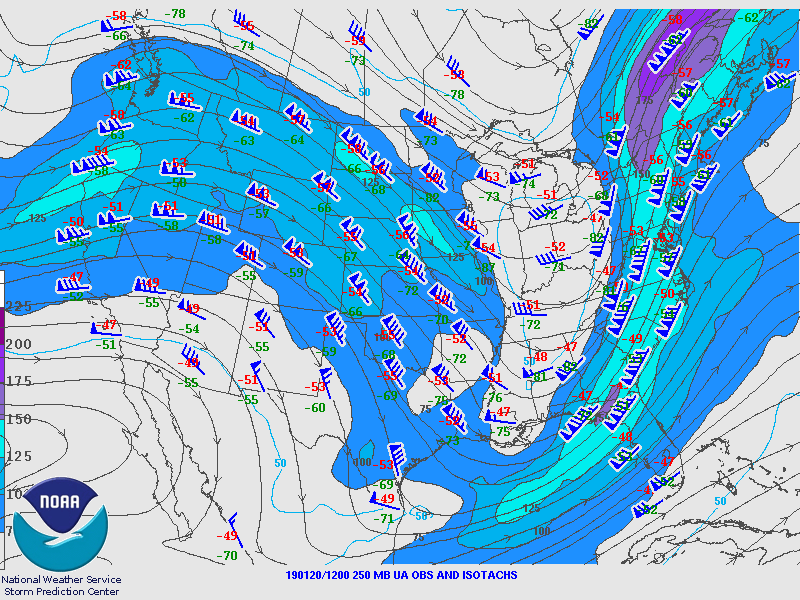
Figure 5: 250 hPa analysis from 20 January 2019 at 12 UTC. Isotach (dark blue >75 knots, lighter blue >100 knots, lightest blue > 125 knots, purple >150 knots, and darker purple > 175 knots, streamlines (black), winds barbs (plotted in blue), and temperature in red and dewpoint in green. [click to enlarge]
Mesoscale Conditions
Several favorable mesoscale ingredients contributed to the moderate to locally heavy snow event on 20 January 2019. These features included strong low-to-mid level frontogenetic forcing, deep and rich moisture advection, and favorable thermodynamics profiles, including a saturated dendritic snow growth layer (-12C to -18C). This long duration winter storm featured multiple bands of moderate to heavy snowfall lifting from south to north across our forecast area associated with frontogenetic forcing at different levels of the atmosphere. The initial burst of moderate snowfall was associated with strong 700 hPa frontogenetic forcing, as southerly winds at 10,000 feet of 50 to 70 knots were advecting warm, moist air into a very cold low-level air mass. The broad isentropic ascent or “overrunning” enhanced the synoptic scale forcing to produce a widespread 2 to 6 inch snowfall early on January 20th. Snowfall rates were generally 0.5 to 1.0 inch with snow-to-liquid ratios in the 10 to 1 range during this initial 700 hPa frontogenetic forcing, and surface visibilities around 1 mile. Figure 6 below shows a loop of the 700 hPa Petterssen Frontogenesis forcing, from the RAP-based NCEP/SPC Mesoanalysis from 0100 to 0800 UTC on 20 January 2019.
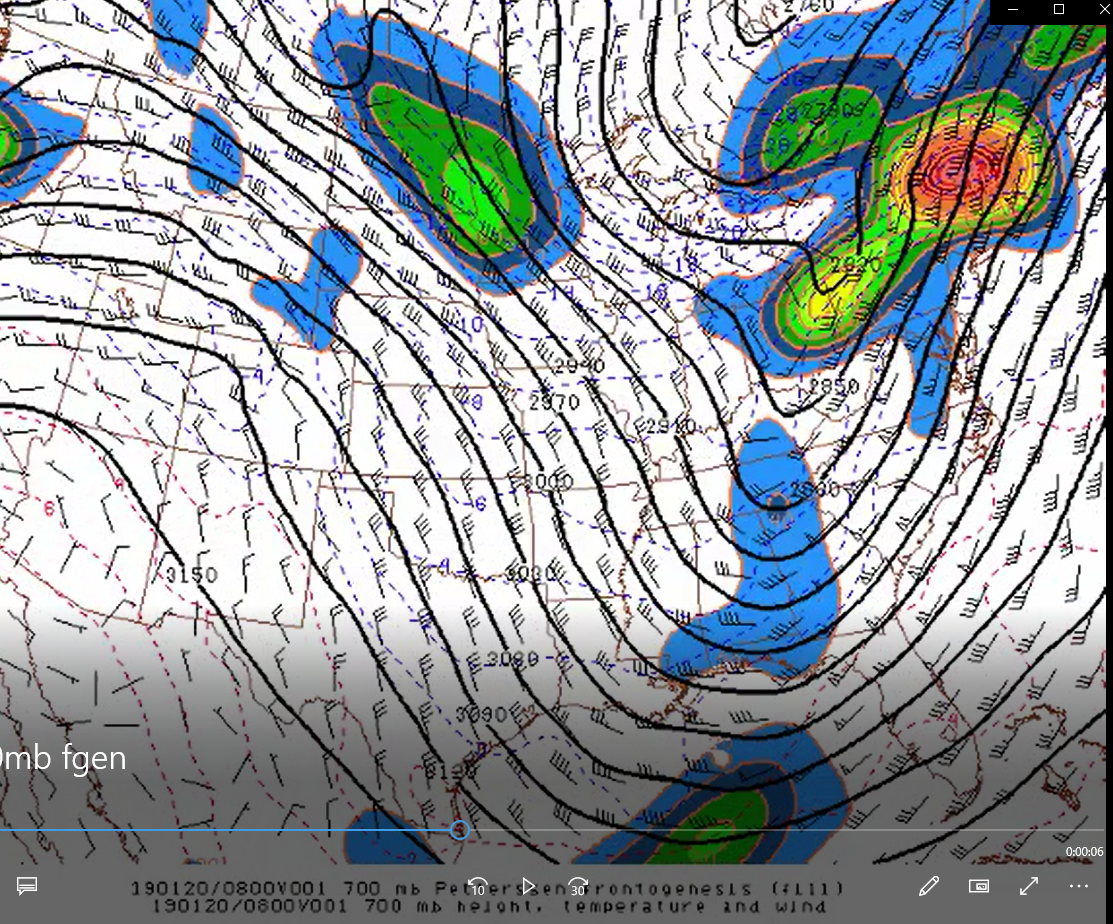
Figure 6: The 700 hPa Petterssen Frontogenesis (color filled), 700 hPa heights (black lines), temperatures (blue dotted lines), and winds (black barbs) from 0100 to 0800 UTC on 20 January 2019. [click to enlarge]
After a brief break in the heavier snowfall rates early on January 20th, additional bands of moderate to locally heavy snowfall impacted the eastern Adirondacks into most of Vermont between 1000 to 1900 UTC on January 20th. These bands of snowfall produced rates of 1 to 2 inches per hour with surface visibilities below ½ mile at times. The RAP 850 hPa Petterssen Frontogenesis showed impressive forcing associated with strong low-level warm air advection occurring just north of the closed 850 hPa low. The tight northwest to southeast surface to 850 hPa thermal gradient, helped to enhance lift, while creating favorable saturation within the dendritic snow growth region. Figure 7 below shows a loop of the 850 hPa Petterssen Frontogenesis forcing, from the RAP-based NCEP/SPC Mesoanalysis from 0100 to 1400 UTC on 20 January 2019.
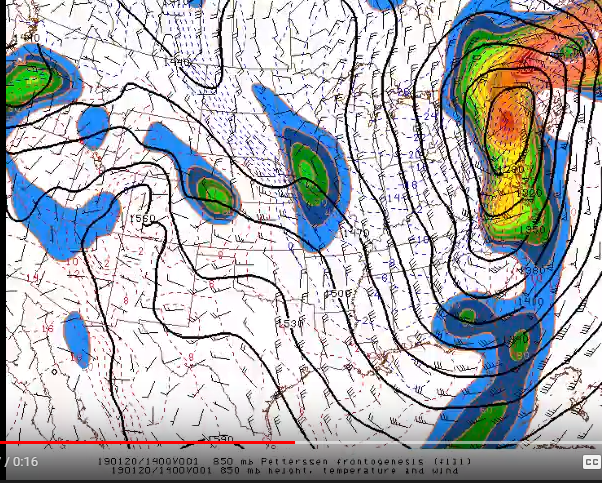
Figure 7: The 850 hPa Petterssen Frontogenesis (color filled), 850 hPa heights (black lines), temperatures (blue dotted lines), and winds (black barbs) from 0100 to 1400 UTC on 20 January 2019. [click to enlarge]
When examining the hourly visibility vs. time profiles at Burlington, Vermont you can clearly recognize when the heaviest snowfall rates occurred, which coincided closely with bands of 700 hPa and 850 hPa frontogenesis. A general rule of thumb is when visibility lowers below 1 mile, snowfall rate is typical near 1 inch per hour. This was definitely true during the height of the snowstorm between 09 UTC and 17 UTC, when visibility ranged between a tenth and half of a mile at the Burlington International Airport and observed snowfall rates were at least an inch per hour.
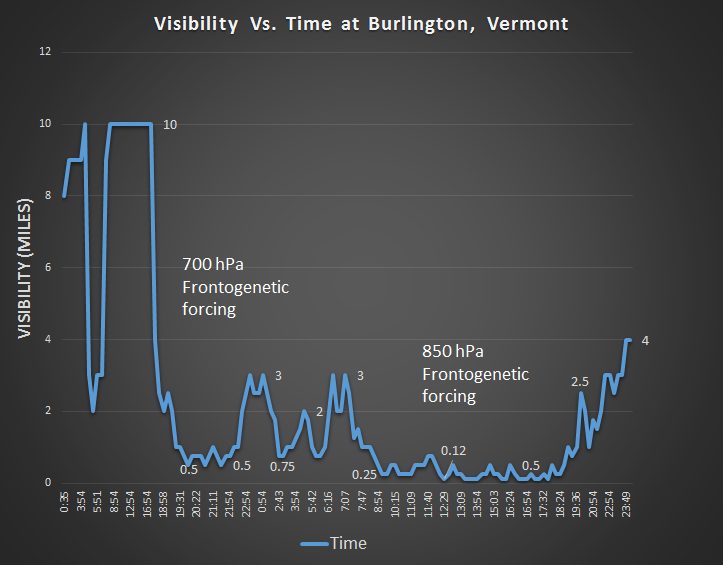
Figure 8: Visibility Vs. Time at Burlington, Vermont from 0035 UTC on 19 January to 2349 UTC on 21 January 2019. [click to enlarge]
This major winter storm occurred during bitterly cold temperatures and wind chills across a majority of our forecast area. Figure 9 below shows the temperature versus time chart at Burlington, Vermont from 0035 UTC on 19 January to 2338 UTC on 21 January 2019. Temperatures prior to the storm started in the mid to upper 20s, but an arctic cold front produced sharp 20 to 30 degree temperature drops by the morning of January 19th, with values across the northern New York into the Champlain Valley of 5⁰F to -5⁰F. This temperature chart below highlights the extremely cold temperatures during the event at Burlington International Airport.
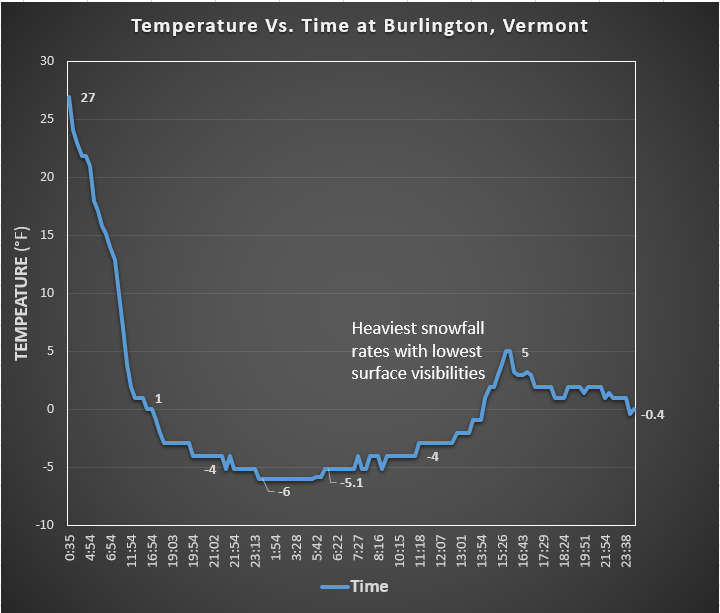
Figure 9: Temperature Vs. Time at Burlington, Vermont from 0035 UTC on 19 January to 2338 UTC on 21 January 2019. [click to enlarge]
Figure 10 below shows a mosaic composite reflectivity loop from 1200 UTC on 19 January to 00 UTC on 21 January 2019. This radar imagery highlights the long 18 to 24 hour duration of the storm, along with several bands of moderate to heavy snowfall lifting from south to north across portions of northern New York and Vermont. In addition, this loop highlights the rain/snow line generally from near Boston, MA to Scranton, PA, while a wintry mix of snow/sleet and freezing rain occurred north of transition zone. The event featured all snow across a majority of our forecast area, with an exception of snow briefly mixing with some sleet across Rutland and Windsor counties on the morning of January 20th. The darker blue colors indicate very heavy snowfall >1 inch per hour, with surface visibilities generally <½ mile.
Figure 10: Mosaic composite reflectivity from 1200 UTC on 19 January to 00 UTC on 21 January 2019. [click to enlarge]
Concluding Summary
The 20-21 January 2019 snowstorm will be remembered for producing 10-20 inch snowfall amounts during a period of arctic temperatures. The storm sets a benchmark for below 0oF surface temperatures during much of the event, in association with arctic high pressure anchored across Quebec. Combined with very low wind chill values down to 20 below, such a situation was potentially dangerous in the event any travelers became stranded in their vehicles. The accumulating snow occurred mostly during a Saturday night/Sunday morning, and fortunately, overall known travel impacts during the storm were limited. A positive impact from this major snowstorm was the significant boost to winter sports enthusiasts and the businesses that benefit from winter activities. The storm occurred during a major “ski weekend” associated with the Martin Luther King Jr. holiday, and resulted in deep powder for alpine skiers on Sunday (1/20) and Monday (1/21). The final three figures below show pictures during and after this major winter storm at the Burlington International Airport.
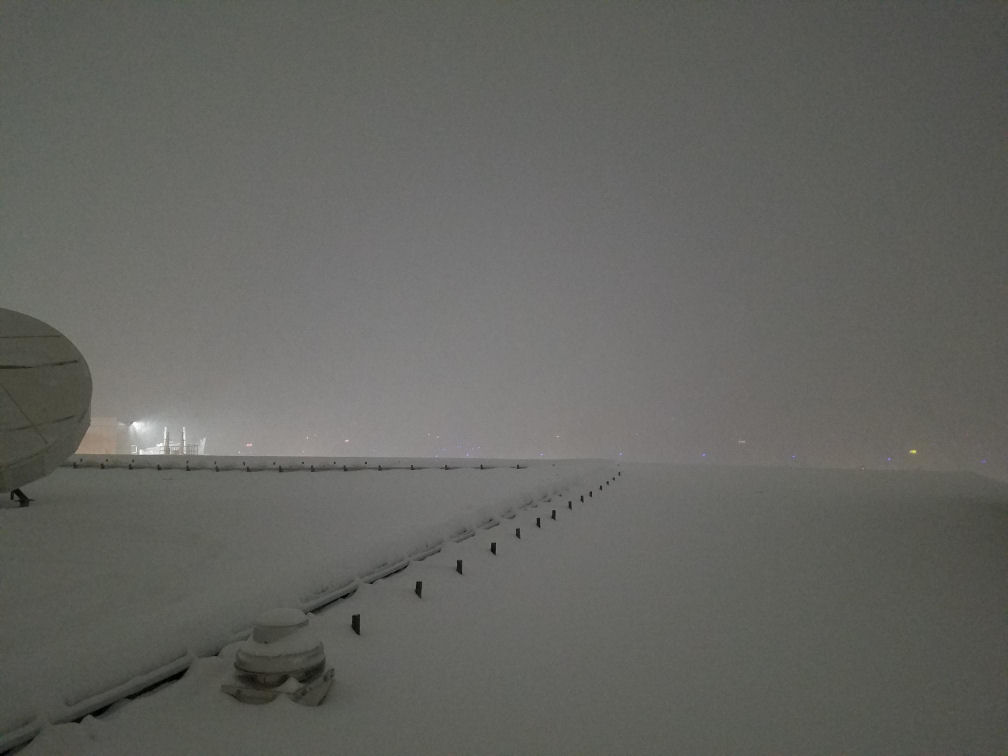
Figure 11: Photo taken on roof of Burlington International Airport looking east across the runaway toward Vermont Air National Guard around 1100 UTC on 20 January 2019. [click to enlarge]
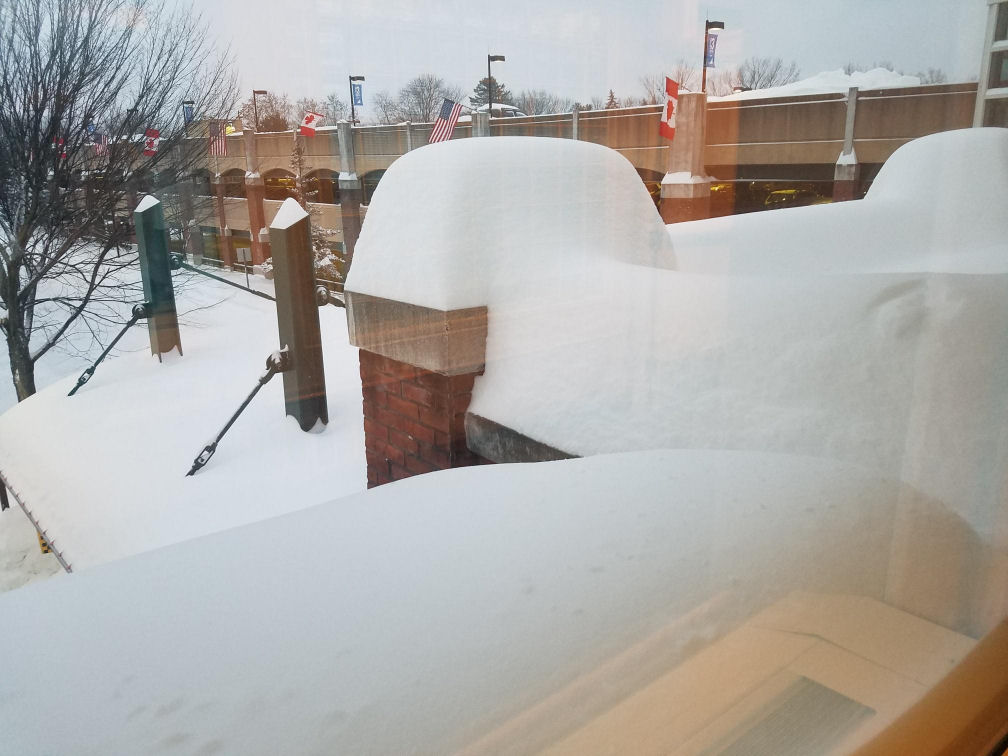
Figure 12: Photo taken at Burlington International Airport on 21 January 2019, showing the deep snowfall which occurred with the major winter storm. [click to enlarge]
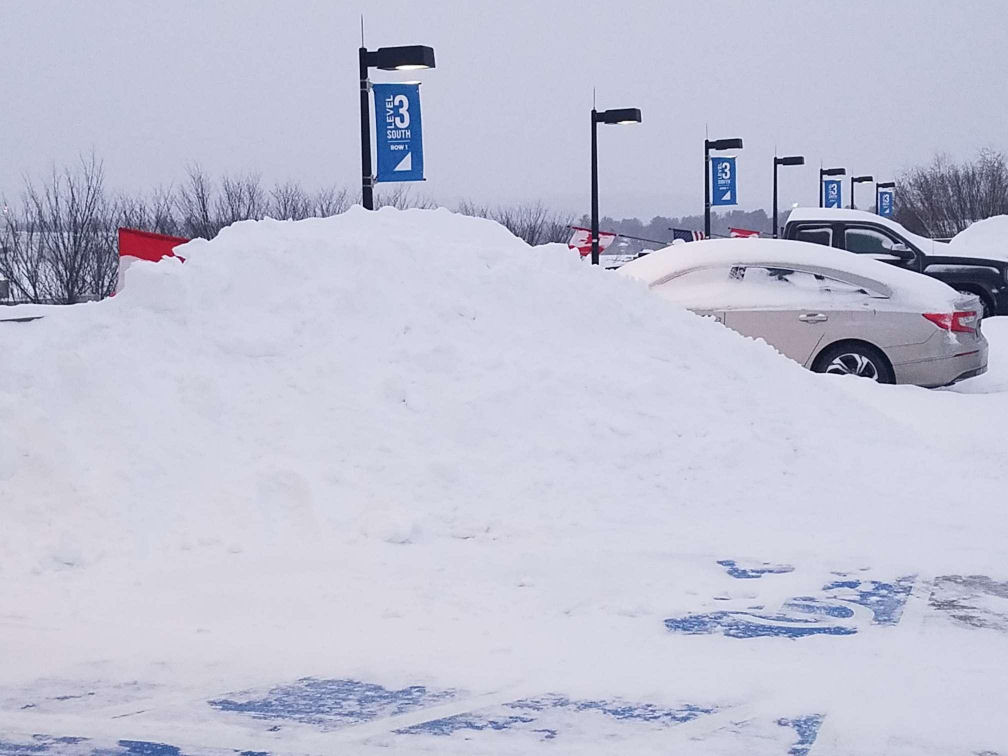
Figure 13: Photo taken of outside parking garage on 21 January 2019, showing snow piles larger than cars. [click to enlarge]

