
A heat wave over the Southwest will intensify this week, peaking and expanding into the Intermountain West and northern High Plains this weekend. Critical to extremely critical fire weather conditions are forecast from the Northwest and the northern Great Basin this weekend. Particularly Dangerous Situation Red Flag Warnings have been issued. Read More >
|
Select Variable: Snowfall | Snow Days | Snow Depth Yearly 4 inch or greater snowfalls (NY | VT); Yearly 6 inch or greater snowfalls (NY | VT) |
|---|
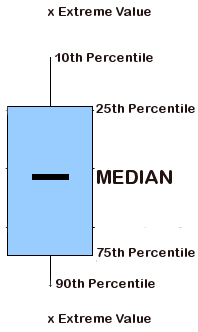 |
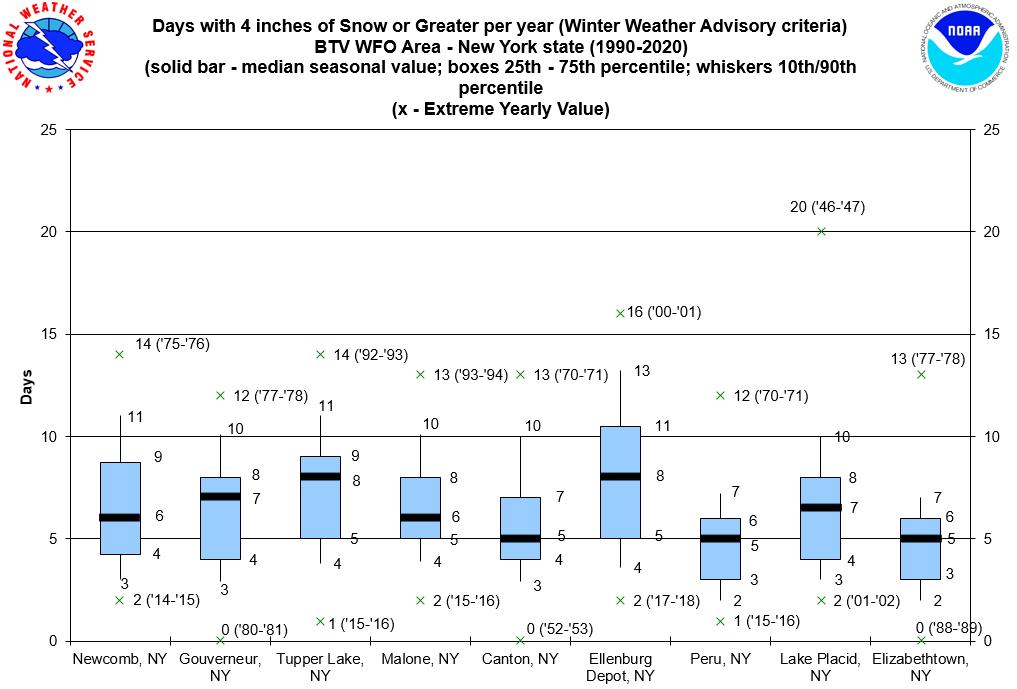
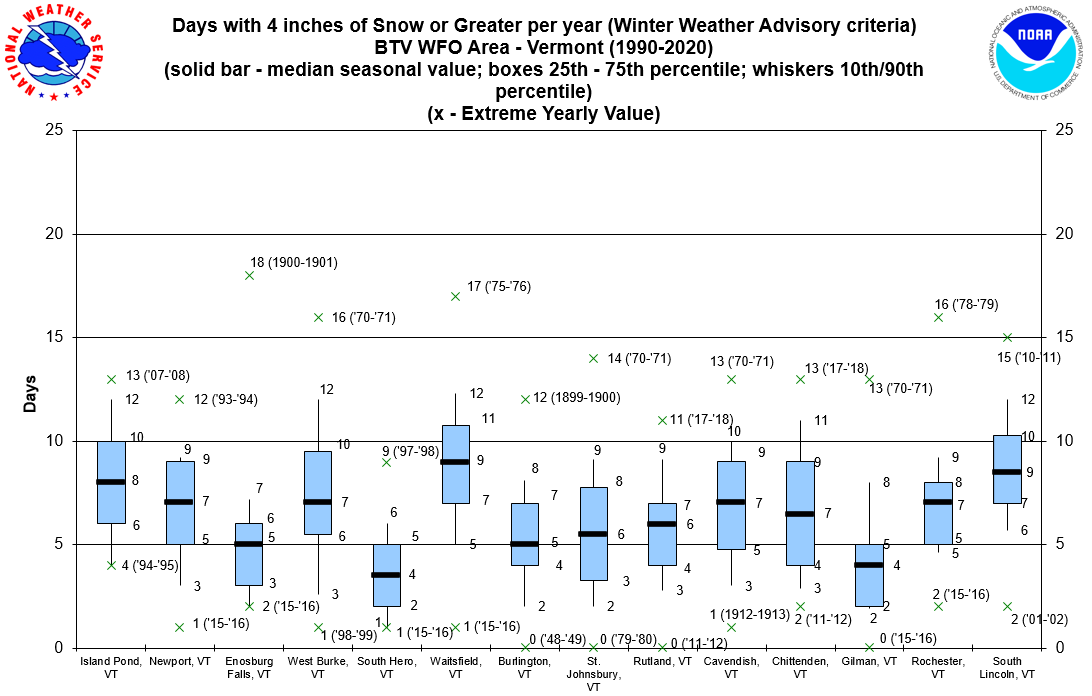
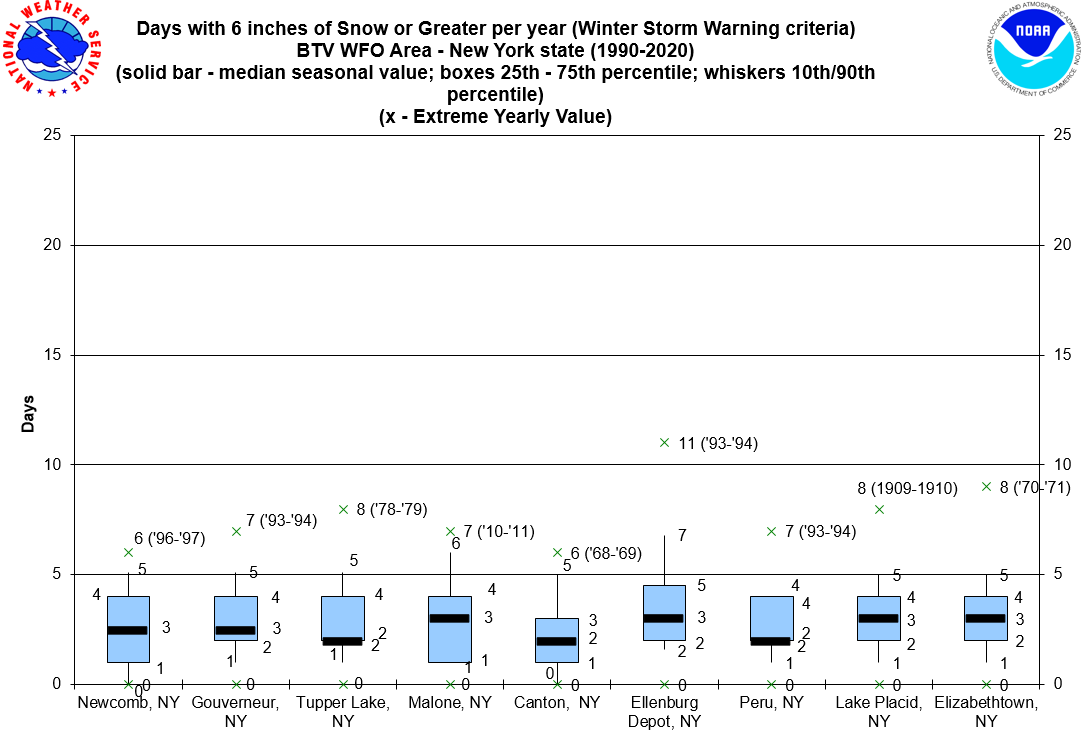
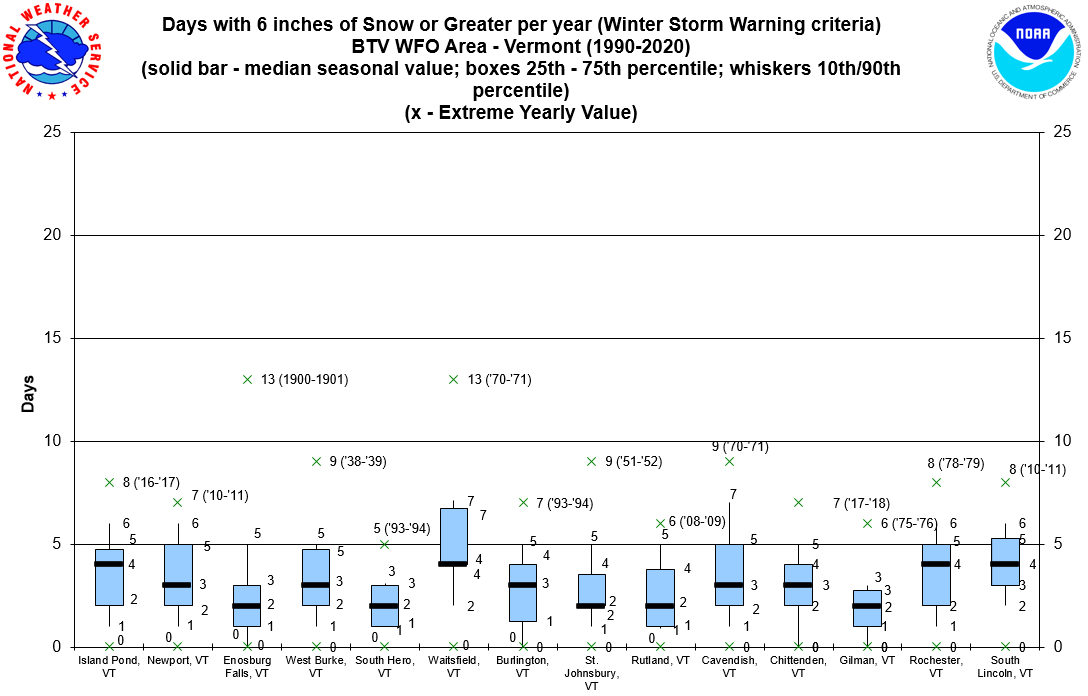
A number of snowfall statistics are measured over a 30-year period through percentile rank analysis across 22 surface observing sites. This includes the monthly snowfall accumulations, the number of days with snowfall greater than 0.1â€, 4.0â€, and 6.0†in a calendar month, and the monthly mean snow depth. Additional comparisons are made to seasonal snowfall amounts across observing sites for periods of record extending back to at least June 1980. Snowfall and snow depth are important to regional recreation, clearing or salting roadways, and anticipating snowmelt contributions into rivers late in the season. The number of days with snowfall greater than 4.0†and 6.0†corresponds to the 12-hour threshold for winter weather advisories and winter storm warnings. How to read the box and whisker graphs: Box and whisker diagrams are employed to view the data distribution. An example of the box and whisker diagram format is shown at left. The shaded region of each graph (i.e., "the box") shows the middle 50% of the range of first/last freeze dates. The top of the box is the 75th percentile and the bottom is the 25th percentile. The solid line within the box shows the median (or 50th percentile) first/last freeze date for that location. The lines extending upward and downward from the box (i.e., "the whiskers") reach to the 10th and 90th percentile of the data distribution. That is, only 10% of the data lies above and below the ends of the whiskers. Lastly, the "x" indicates the extreme (record) freeze dates back to 1970, or for the period of record if the station record is shorter. The intent of the box and whisker format is to give a comprehensive view of the range of first and last freeze dates at individual sites, and facilitate comparison between different locations around WFO Burlington's forecast area (see Banacos 2011 for more info). For additional freeze climatology discussion, see text accompanying each freeze region below. |
 |
|
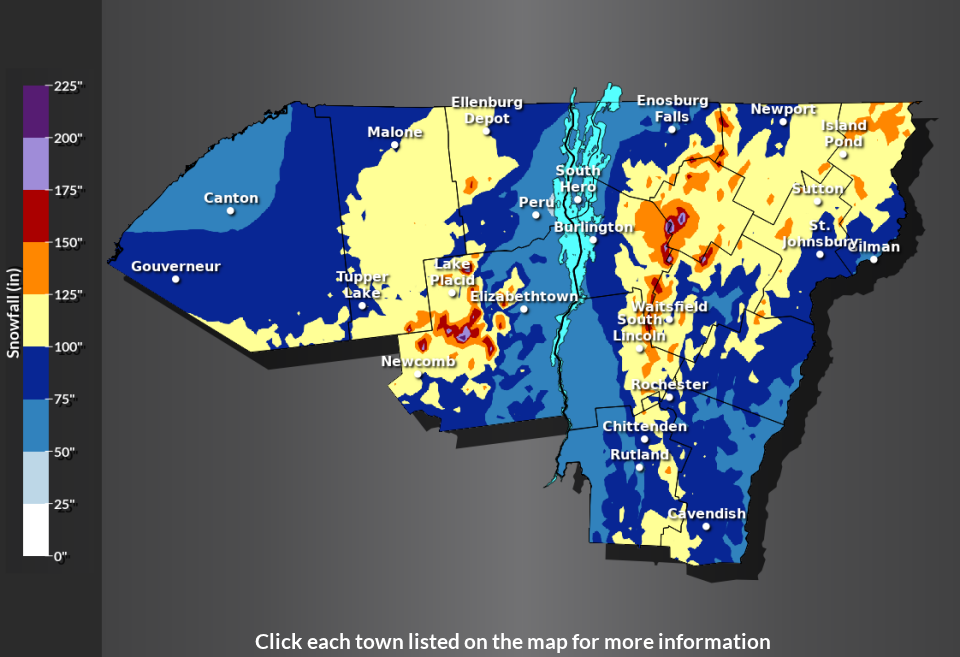
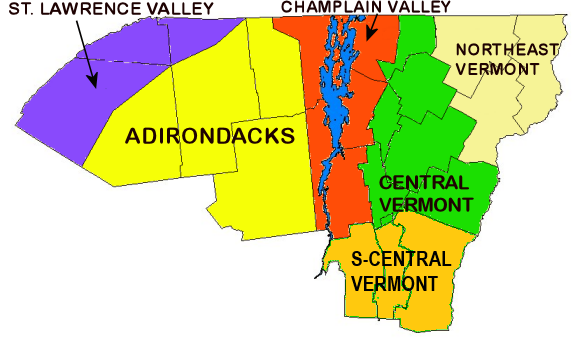
The varied topography of the North Country includes two major mountainous areas (the Adirondacks and Green Mountains), Lake Champlain, river basins both wide and narrow, and smaller, sheltered valleys of varying elevation. Similar to the freeze climatology, topographic effects contribute to variability in the number of snow days, snowfall accumulations, and snow depth, evident in the box and whisker graphs. Higher elevations typically experience more snow days and greater snowfall accumulations. Depending on the wind direction, wind speed, and slope of terrain, orographic forcing allows snowfall to persist after synoptic scale forcing departs. As a result, sites across higher elevations develop a deeper snowpack that extends into spring. At high elevation, there is variability in snow depth depending on whether the slope orientation faces north, which would augment the longevity of the snowpack, or whether the slope orientation faces south, which is more exposed to sunlight melting the snowpack. Lower elevations typically experience fewer snow days and lesser snowfall accumulations due to warmer surface and boundary layer temperatures at the tails of the winter season and terrain induced subsidence. As a result, the monthly mean snow depth will often be lower climatologically at lower elevations.
The St. Lawrence Valley is a relatively wide and flat region (at elevations generally between 200 - 450 feet). The St. Lawrence Valley is the most distant from coastal Nor’easters in the North Country and experiences terrain shadowing in south or southeasterly flow regimes. In southwesterly flow regimes, lake effect snow bands across the Great Lakes can extend across the lower St. Lawrence valley, but the greatest amounts will be along the longest fetch of Lake Ontario (wind direction of 250°) and closest to Lake Ontario. This difference can be noted when comparing Gouverneur to Canton. The southwest to northeast orientation of the St. Lawrence Valley results in a persistent northeasterly wind as low pressure systems approach the region from the west. Cool, northeasterly drainage winds in the St. Lawrence valley can result in lift supported by convergence against incoming frontal boundaries from the west or southwest. However, sometimes above-freezing temperatures aloft in southwesterly flow will produce freezing rain rather than snow.
A region of complex terrain consisting of high peaks (many in excess of 4000 ft., with Mt. Marcy at 5344 ft.) and narrow, steep valleys. Valley floors in the region are of relatively high elevation, above 1000 ft. Most of the highest peaks are in the southeastern areas of the Adirondacks. This results in some terrain shadowing for most of the northern Adirondacks in south or southeast flow, except at Newcomb. Orographic enhancement in northwest flow, common after a frontal passage, produces persistent light snowfall across the region, and the Adirondacks receive lake effect snow in west or southwesterly flow. Though the complex terrain often disrupts lake effect snow bands, the orographic enhancement results in higher snowfall totals across sites like Wanakena and Tupper Lake. This region receives near to above 100 inches of snowfall on average each winter season with persistent snow packs.
The Champlain Valley is a narrow north-south valley situated between two mountain ranges with steep inclines; the Adirondacks to the west, and the Green Mountains to the east. Lake Champlain is situated between the mountains and provides a moderating influence while unfrozen. Outside of north to northwesterly winds, most wind directions result in terrain shadowing. Channeled southerly winds will quickly advect warm air into the Champlain Valley. The combination of lower elevation, terrain shadowing, and a wind direction that brings in warm air from the south results in less snow compared to surrounding regions, as well as reduces the longevity of the snowpack. However, the Champlain Valley is closer to Nor’easters than the St. Lawrence Valley or the Adirondacks and receives plenty of snow from Alberta Clippers that traverse the Mohawk Valley. Peru, New York and South Hero, VT receive the least seasonal snowfall (about 50 inches on average) and fewest number of snow days (about 15 to 20 days per winter season) compared to much of the North Country.
Terrain in central Vermont is highly variable, with several mountain ranges, steep river valleys, and a few sheltered valleys. The highly variable snowfall climatology in this region reflects that. Aside from an easterly or northeasterly wind direction, most wind directions result in orographic lift, and central Vermont is also closer in proximity to coastal systems. Westerly and northwesterly winds result in the most frequent orographic snowfall, but generally yields downsloping east of the Green Mountains. The Waitsfield site has shifted over the years, but consistently remains high with seasonal average snowfall accumulations greater than 100 inches and a persistent snow pack. Rochester, Vermont represents the lower valleys with roughly 75 inches of snow over the season, about 25 snow days per season, and about 2 to 3 inches less of mean snow depth per month.
Northeast Vermont has varied terrain, sheltered valleys, and the broader Passumpsic and Connecticut River Valleys on its eastern edge. The White Mountains of northern New Hampshire have a significant influence in terms of orographic shadowing, especially for lower elevation sites near to the New Hampshire border. Snowfall climatology is varied in a similar manner to Central Vermont, but the distinctions are somewhat sharper due to the height and orientation of the Whites and influence of the Connecticut River Valley. Their close proximity to coastal systems that track inland into Maine results in more snowfall for much of the region. West Burke is located in the southern foothills of Bald Mountain where southerly winds converge in the Passumpsic Valley, which results in high seasonal snowfall totals over 100 inches. Meanwhile, lower valley sites, like St. Johsnbury receives just under 90 inches, and receives shadowing and downsloping effects on southeasterly flow owing to the White Mountains of New Hampshire. Newport, Vermont behaves a bit differently, nestled between mountains and with the moderating influence of Lake Memphremagog. Northerly winds result in some convergence, especially in blocked flow regimes, but terrain to the north is about 100 to 200 ft. more elevated. Newport sees similar seasonal snowfall totals to St. Johnsbury, but has mean snow depths 2 to 4 inches greater from January through March due to it being in a sheltered basin.
The southern Greens bisect the Champlain Valley and Connecticut River Valley, with several additional mountain peaks, like Mt. Ascutney, in south-central Vermont. Being the southernmost region of our forecast area, warm air is more likely to intrude. However, south-central Vermont is also closest to the favorable storm track of moisture-laden coastal systems, which often produce the largest snowfall accumulations. Warm fronts can have difficulty crossing the eastern Greens, and southeasterly flow is favorable for upslope regions, which allows the eastern slopes of the southern Greens to experience a bit more snow on average. Rutland sees somewhat less snowfall with less terrain driven snowfall events, but still receives around 75 inches of snowfall annually. Rutland climatologically has a less resilient snowpack than Cavendish or Rochester. The region experiences roughly 75 to 100 inches of snow each winter season.
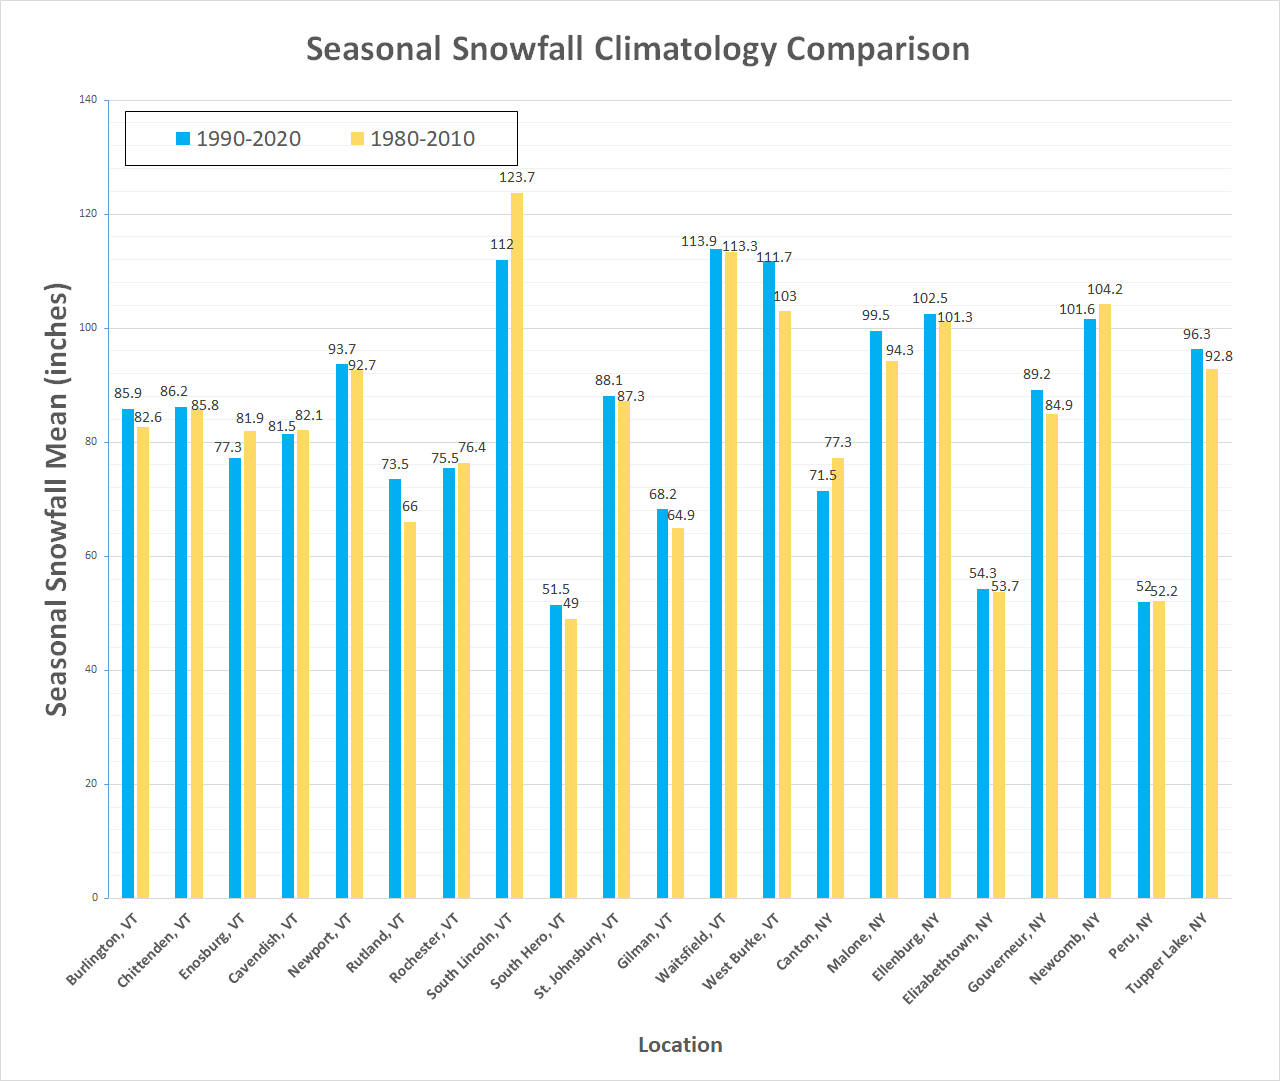
The mean snowfall for each month was compared across sites for which a period of record covers at least the 1980-1981 winter season through the 2019-2020 winter season; each contains a set of thirty winter seasons. With that, a comparison between the winter seasons from 1990-2020 and 1980-2010 can be made to observe running changes over the last 10 years. This was also done seasonally to answer whether we have received more or less snowfall in recent winter seasons. See the images below with the bar charts. To summarize, some sites have experienced more snow and others have experienced less, while a few experienced little change. Some of the interesting ones to note are the average increase of 7.5†at Rutland compared to Cavendish*, which saw little change with a 0.6†reduction seasonally. Sites that have seen an increase in seasonal snowfall accumulations greater than 2†with the updated climatology include Burlington, Rutland, South Hero, and West Burke/Sutton* in Vermont, and Gouverneur and Tupper Lake in New York. Sites that have seen a decrease in seasonal snowfall accumulations greater than 2†are Enosburg in Vermont and Canton and Newcomb in New York. Among the monthly seasonal snowfall amounts, the notable change has been the little change or decrease in snowfall from November through January and the increase in snowfall during February and March, which is present at most of the sites assessed. It should be noted that the climatological comparisons of Enosburg and Cavendish Vermont, and Ellenberg, Gouverneur, and Tupper Lake, New York have been degraded by a small number of missing reports.
November Snowfall Climatology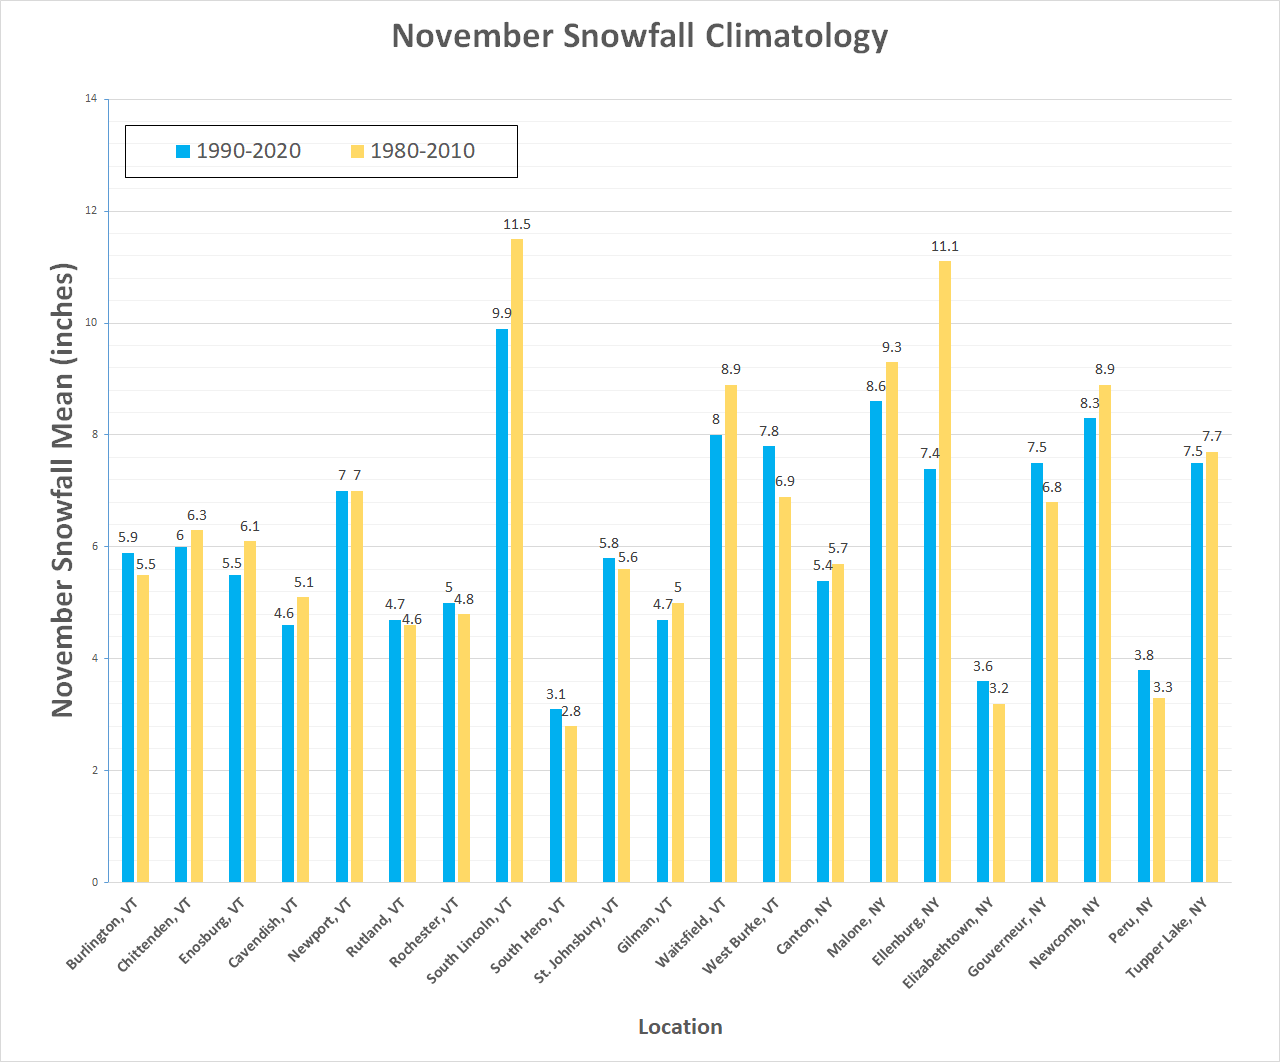 |
December Snowfall Climatology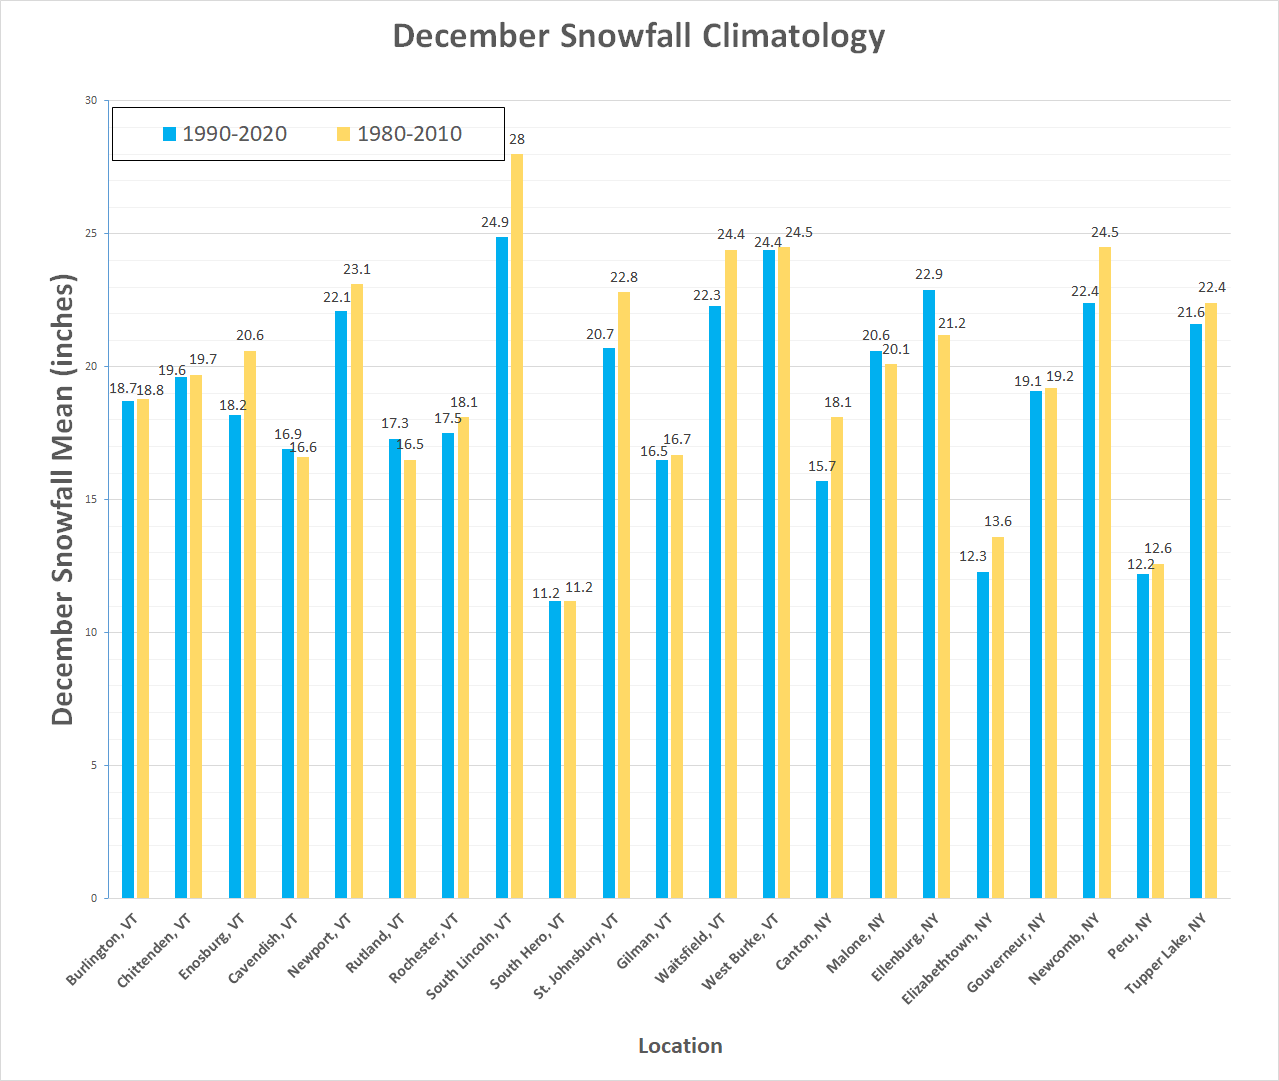 |
January Snowfall Climatology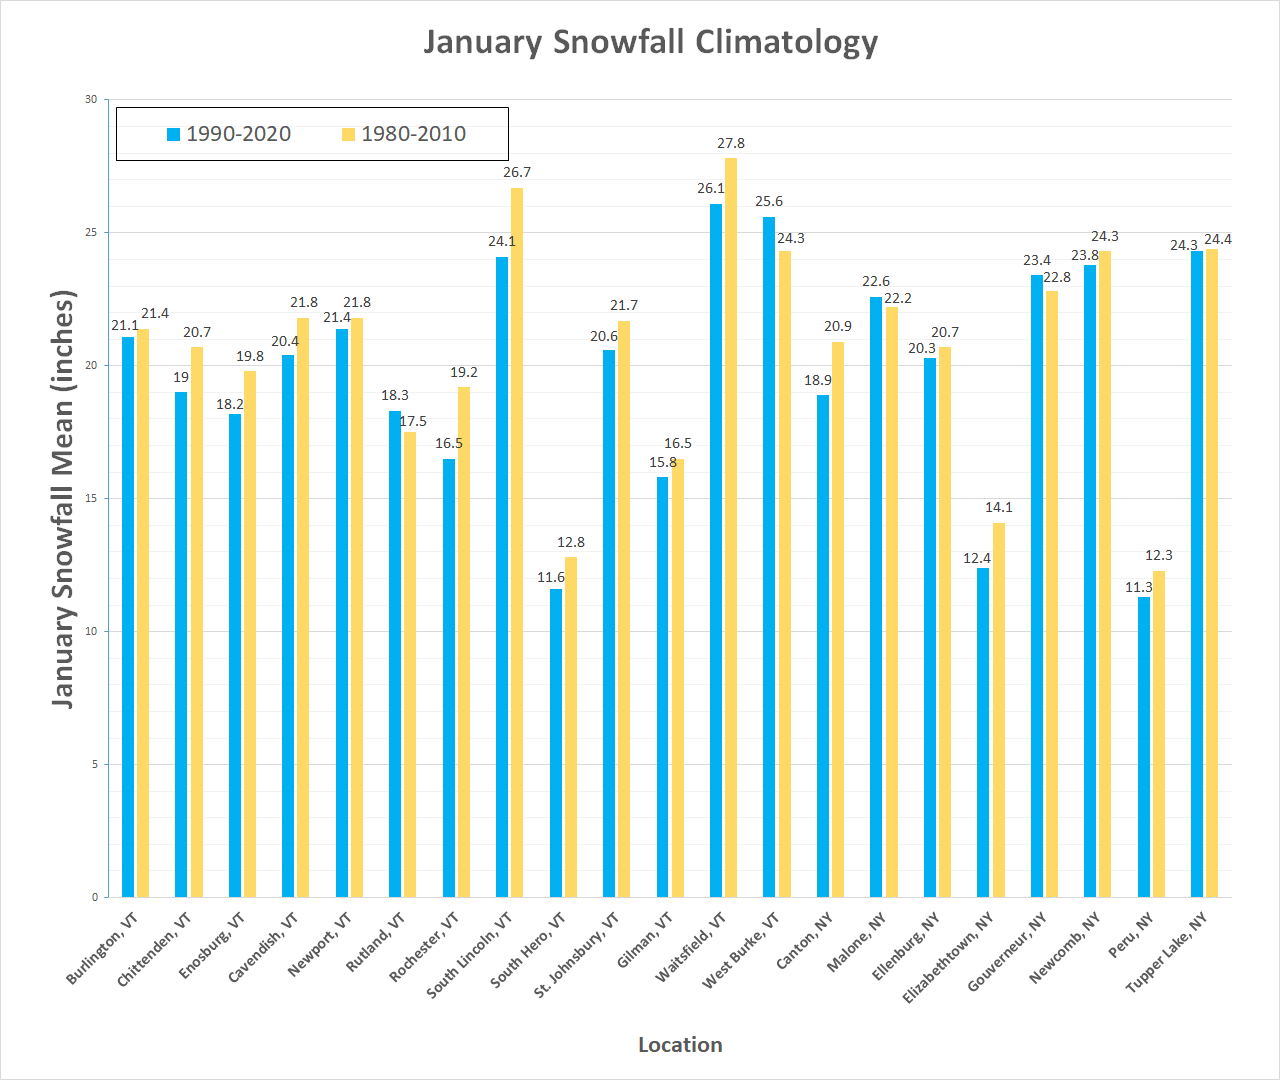 |
February Snowfall Climatology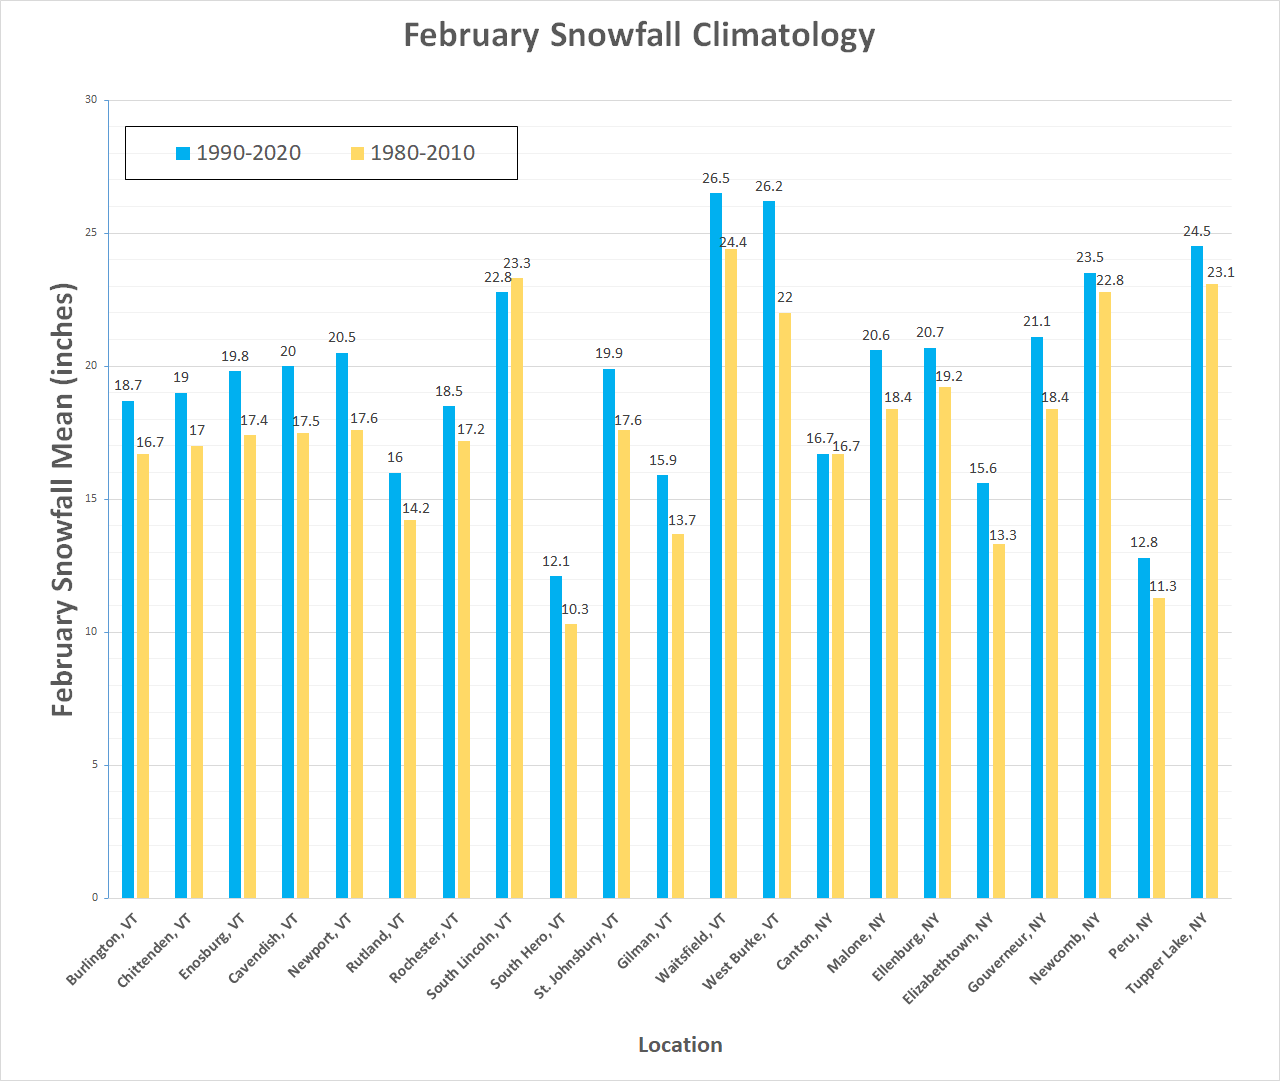 |
March Snowfall Climatology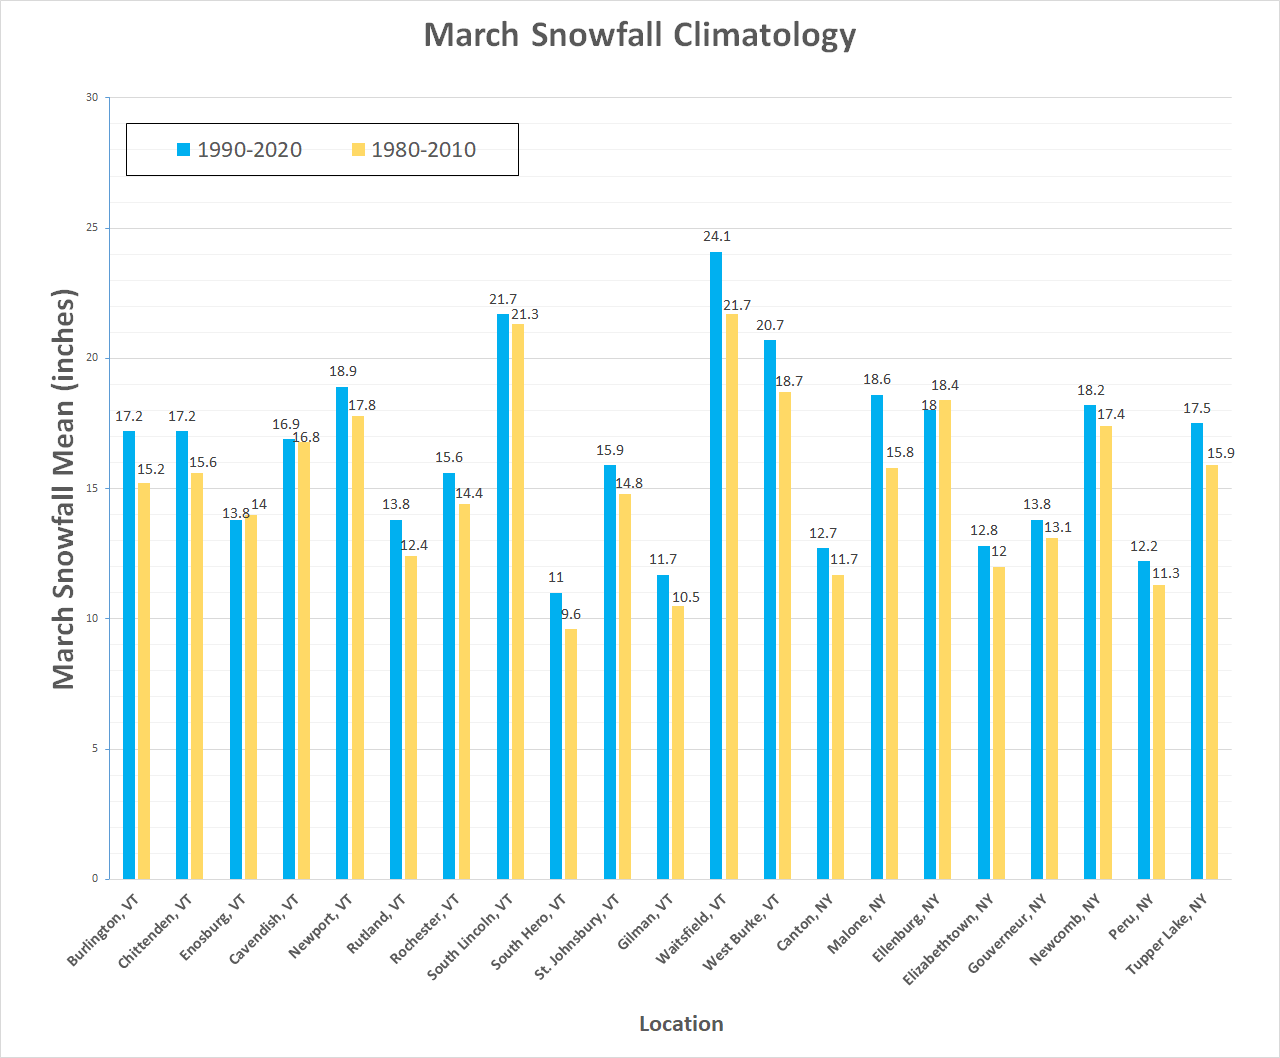 |
April Snowfall Climatology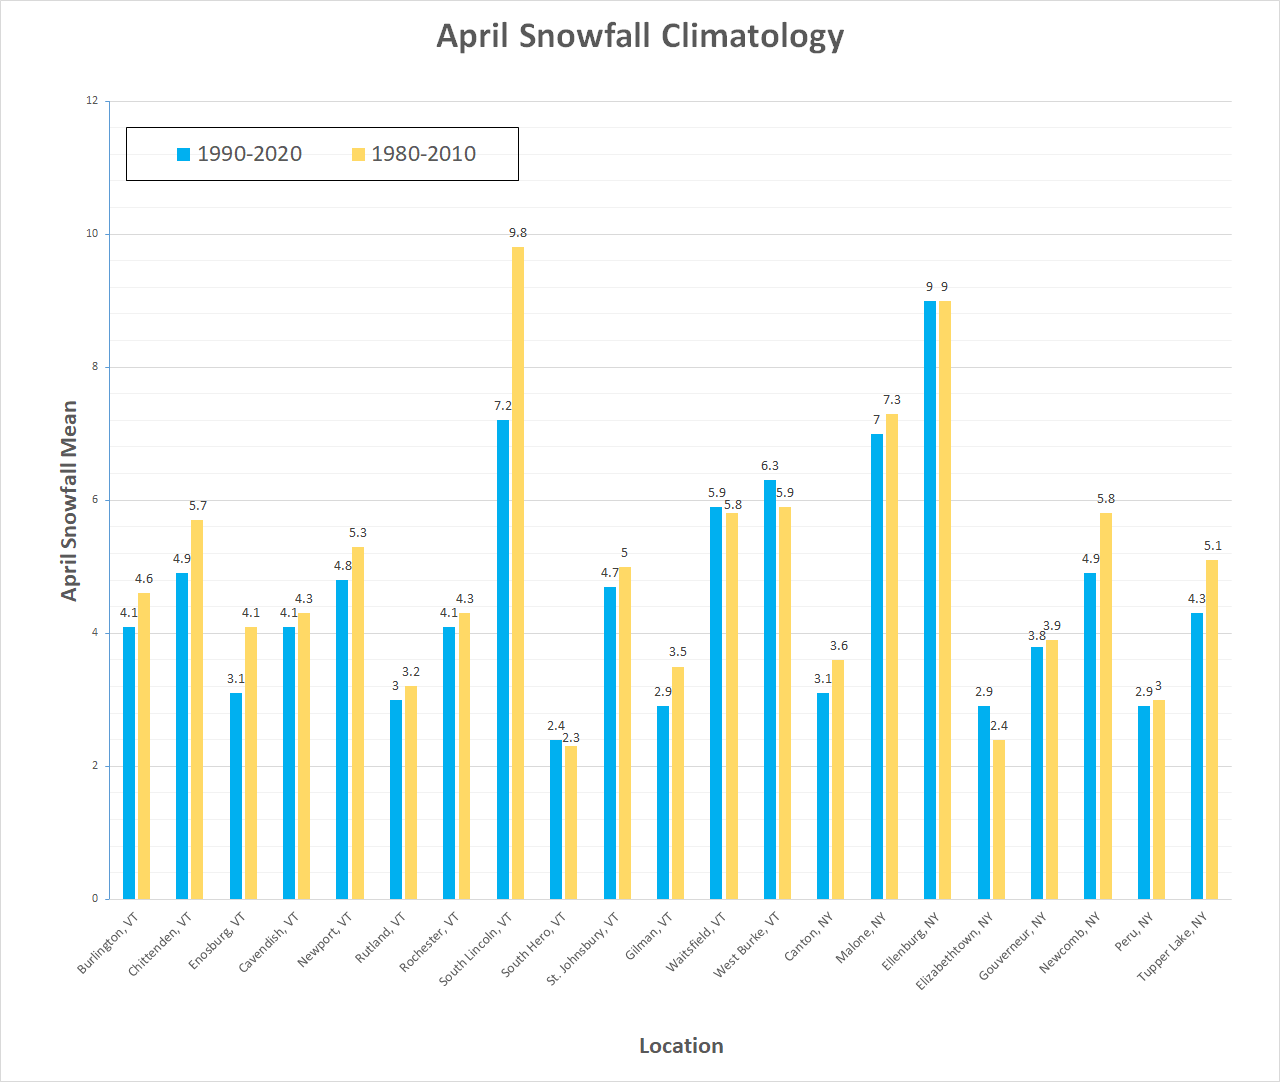 |
Banacos, P. C., 2011: Box and whisker plots for local climate datasets: Interpretation and creation using Excel 2007/2010. NWS Eastern Region Technical Attachment No. 2011-01, National Weather Service, Eastern Region Headquarters, Bohemia, NY, 20 pp.

