Severe thunderstorms capable of damaging winds will be possible from the Ozark Plateau east into the Tennessee Valley Saturday. Rounds of heavy thunderstorms ahead of a slow moving front will continue locally heavy rainfall and scattered flash flooding potential from the Ozarks to the Ohio and Tennessee Valleys Saturday. Extreme heat will continue for the Intermountain West and Plains. Read More >
| Climate/Almanac Data - Nov Normals - Nov Records | ||||||||||||||||||||||||||||||||||||||||||||||||||||||||||||||||||||||||||||||||||
| November | ||||||||||||||||||||||||||||||||||||||||||||||||||||||||||||||||||||||||||||||||||
|
|
||||||||||||||||||||||||||||||||||||||||||||||||||||||||||||||||||||||||||||||||||
|
|
||||||||||||||||||||||||||||||||||||||||||||||||||||||||||||||||||||||||||||||||||
| The ranking is listed in parentheses (__) when within the "Top 10". | ||||||||||||||||||||||||||||||||||||||||||||||||||||||||||||||||||||||||||||||||||
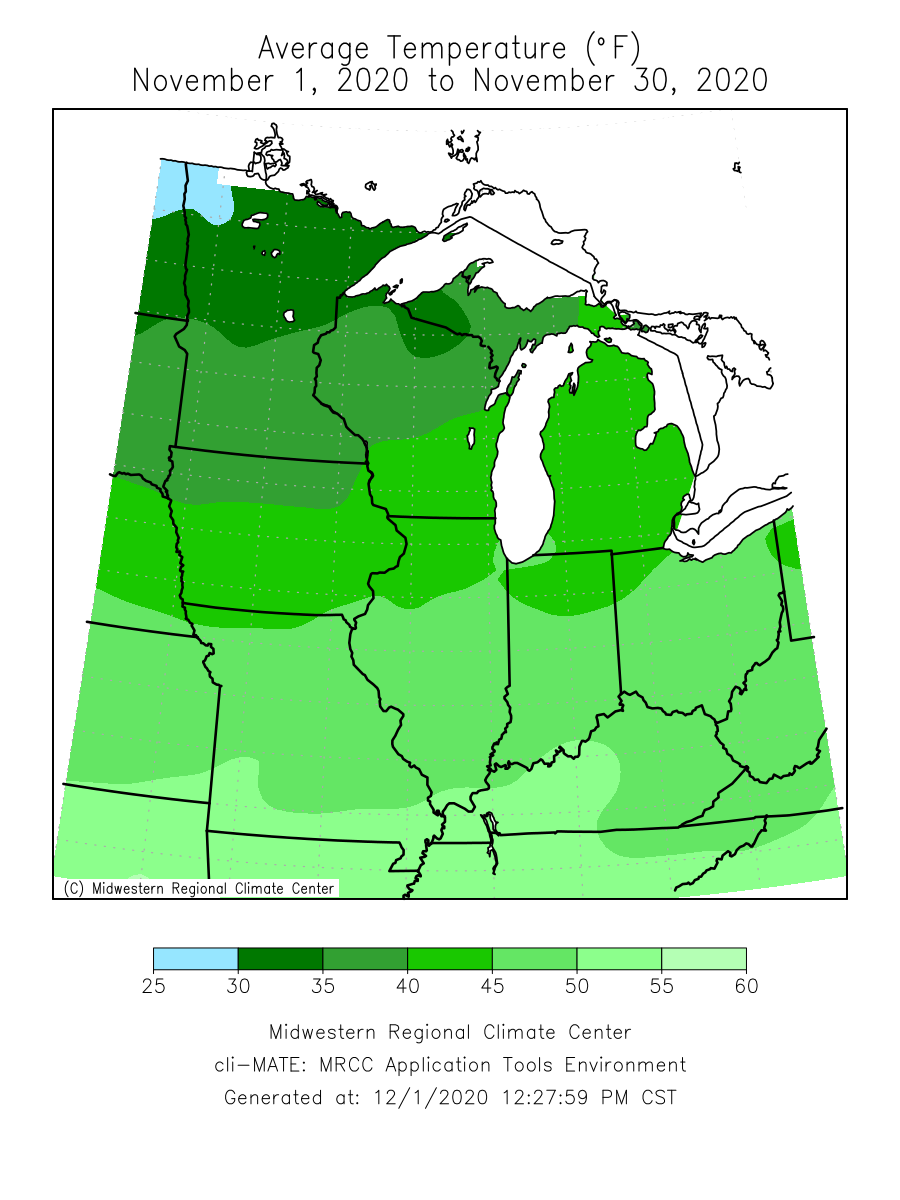
| November 2020 was around 3 to 6 degrees above normal. | ||||||||||||||||||||||||||||||||||||||||||||||||||||||||||||||||||||||||||||||||||
| Precipitation totals for November 2020 were near normal to 1" below normal at Davenport, IA. | ||||||||||||||||||||||||||||||||||||||||||||||||||||||||||||||||||||||||||||||||||
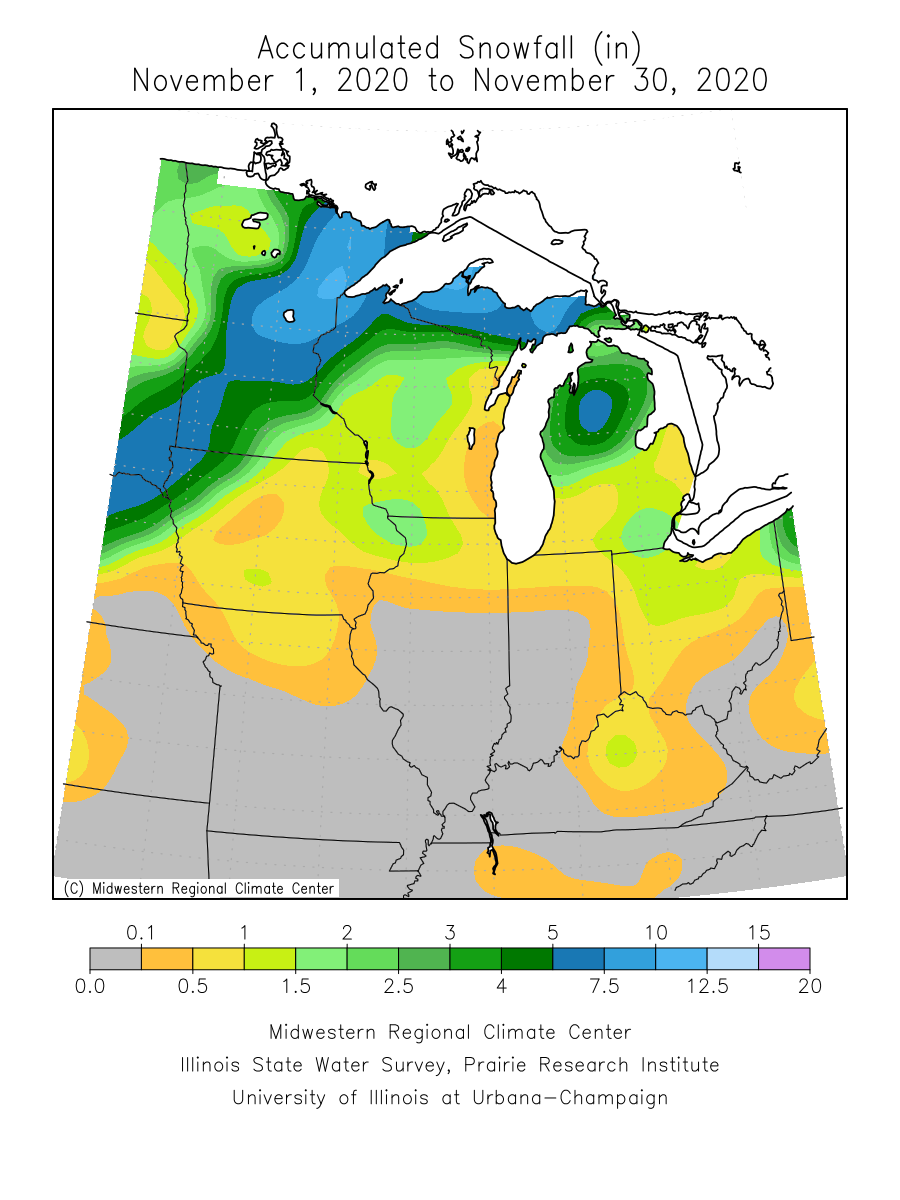
| Snowfall totals for November 2020 were 0.5" to 1" below normal. | ||||||||||||||||||||||||||||||||||||||||||||||||||||||||||||||||||||||||||||||||||
| Please see Nov Records for monthly record information. | ||||||||||||||||||||||||||||||||||||||||||||||||||||||||||||||||||||||||||||||||||
| The climate maps below are courtesy of the Midwest Regional Climate Center. | ||||||||||||||||||||||||||||||||||||||||||||||||||||||||||||||||||||||||||||||||||
| These maps become available or updated around 10am on the first of the month. | ||||||||||||||||||||||||||||||||||||||||||||||||||||||||||||||||||||||||||||||||||
|
||||||||||||||||||||||||||||||||||||||||||||||||||||||||||||||||||||||||||||||||||
| Climate/Almanac Data - Autumn Normals - Autumn Records | ||||||||||||||||||||||||||||||||||||||||||||||||||||||||||||||||||||||||||||||||||
| AUTUMN (SEP-NOV) |
||||||||||||||||||||||||||||||||||||||||||||||||||||||||||||||||||||||||||||||||||
|
||||||||||||||||||||||||||||||||||||||||||||||||||||||||||||||||||||||||||||||||||
| The ranking is listed in parentheses (__) when within the "Top 10". | ||||||||||||||||||||||||||||||||||||||||||||||||||||||||||||||||||||||||||||||||||
| Autumn 2020 was about 1 degree below normal at Burlington to 1 degree above normal at Davenport. | ||||||||||||||||||||||||||||||||||||||||||||||||||||||||||||||||||||||||||||||||||
| Precipitation totals for Autumn 2020 were about 2 to 6 inches above normal, with the exception of Burlington which was almost 2" below normal. | ||||||||||||||||||||||||||||||||||||||||||||||||||||||||||||||||||||||||||||||||||
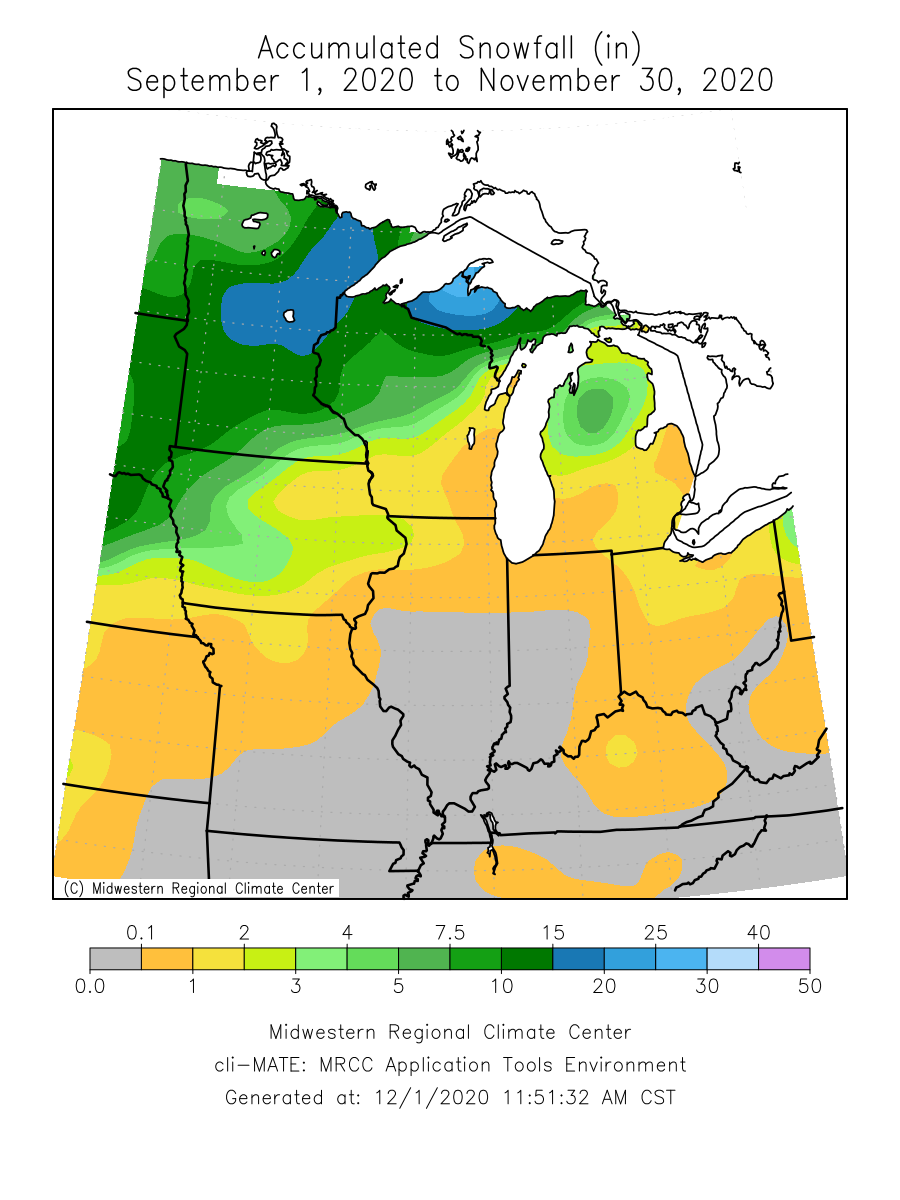
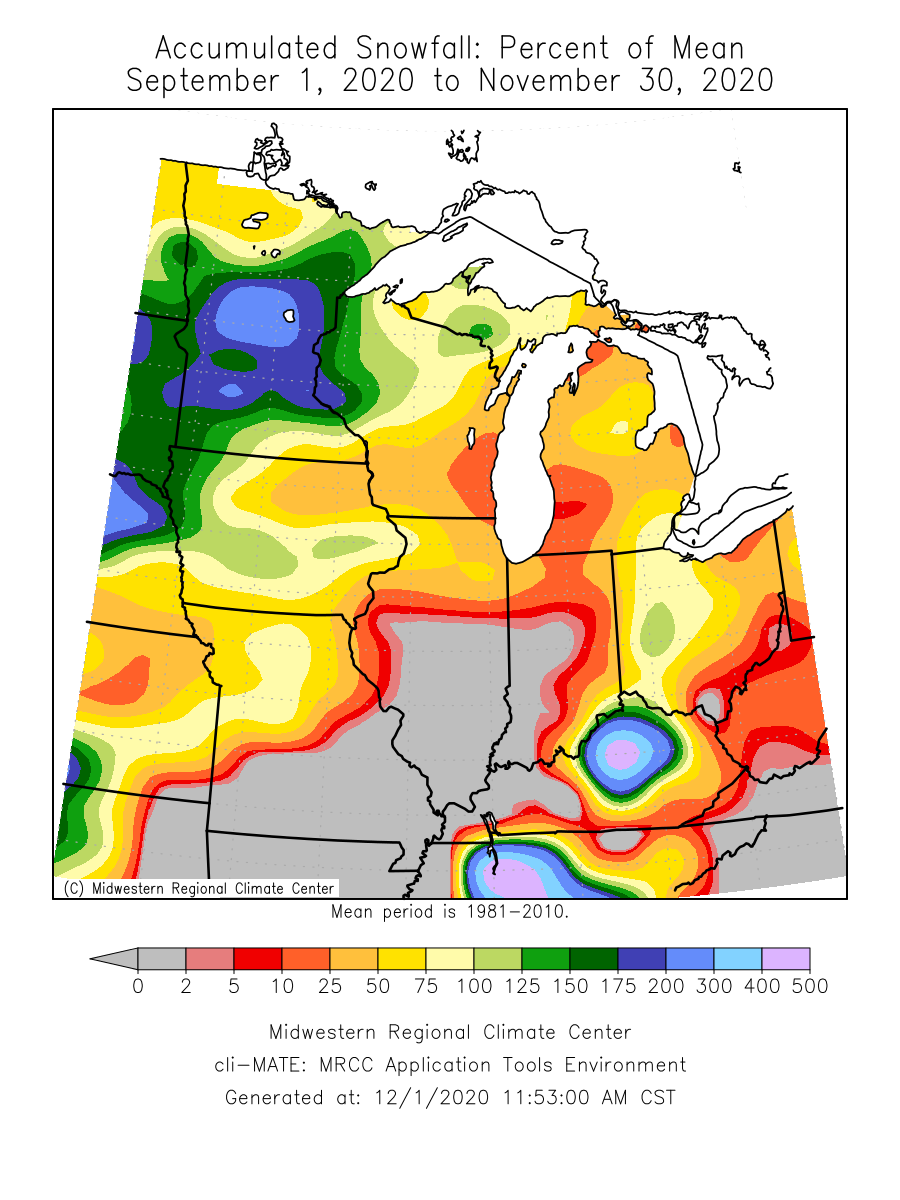
| Snowfall totals for Autumn 2020 were near normal. | ||||||||||||||||||||||||||||||||||||||||||||||||||||||||||||||||||||||||||||||||||
| Please see Autumn Records for seasonal record information. | ||||||||||||||||||||||||||||||||||||||||||||||||||||||||||||||||||||||||||||||||||
| The climate maps below are courtesy of the Midwest Regional Climate Center. | ||||||||||||||||||||||||||||||||||||||||||||||||||||||||||||||||||||||||||||||||||
| These maps become available or updated a few days after December 1st. | ||||||||||||||||||||||||||||||||||||||||||||||||||||||||||||||||||||||||||||||||||
|
||||||||||||||||||||||||||||||||||||||||||||||||||||||||||||||||||||||||||||||||||
| A LOOK AHEAD | ||||||||||||||||||||||||||||||||||||||||||||||||||||||||||||||||||||||||||||||||||
|
||||||||||||||||||||||||||||||||||||||||||||||||||||||||||||||||||||||||||||||||||