| Climate/Almanac Data - Nov Normals - Nov Records |
| |
| November |
| |
|
Site
(Click site name for report)
|
Avg
Temp |
Normal
1991-2020 |
Dept
From
Norm |
Precip
Total |
Normal
1991-2020 |
Dept
From
Norm |
Snowfall
Total |
Normal
1991-2020 |
Dept
From
Norm |
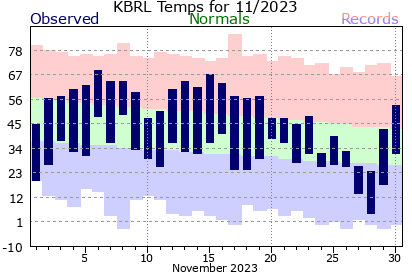
| Burlington |
41.6° |
41.0° |
+0.6° |
0.55" |
2.29" |
-1.74" |
NA |
NA |
NA |
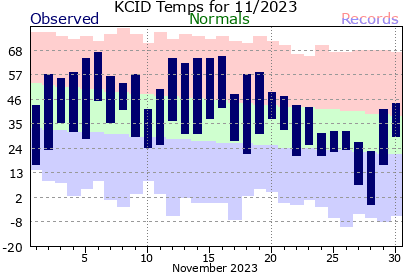
| Cedar Rapids |
39.4° |
37.0° |
+2.4° |
0.54" |
2.00" |
-1.46" |
NA |
NA |
NA |
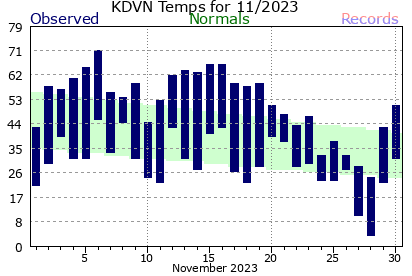
| Davenport |
41.2° |
39.2° |
+2.0° |
0.62" |
2.25" |
-1.63" |
3.3" |
NA |
NA |
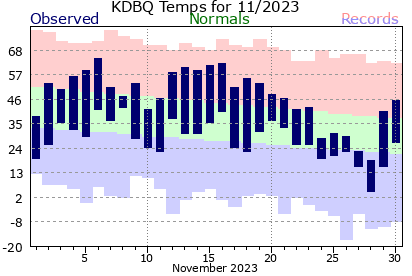
| Dubuque |
38.1° |
36.4° |
+1.7° |
0.53" |
2.21" |
-1.68" |
2.5" |
2.8" |
-0.3" |
| Iowa City |
40.4° |
39.8° |
+0.6° |
0.43" |
2.17" |
-1.74" |
NA |
NA |
NA |
| Moline |
41.4° |
40.4° |
+1.0° |
0.71" |
2.30" |
-1.59" |
2.6" |
2.1" |
+0.5" |
|
| The ranking is listed in parentheses (__) when within the "Top 10". |
| |
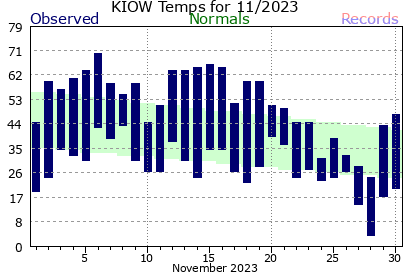
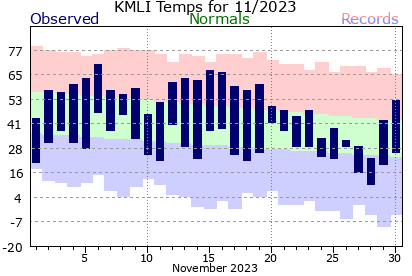
| November 2023 was about 0.5 to 2.5 degrees above normal. |
| Precipitation totals were about 1.4 to 1.7 inches below normal. |
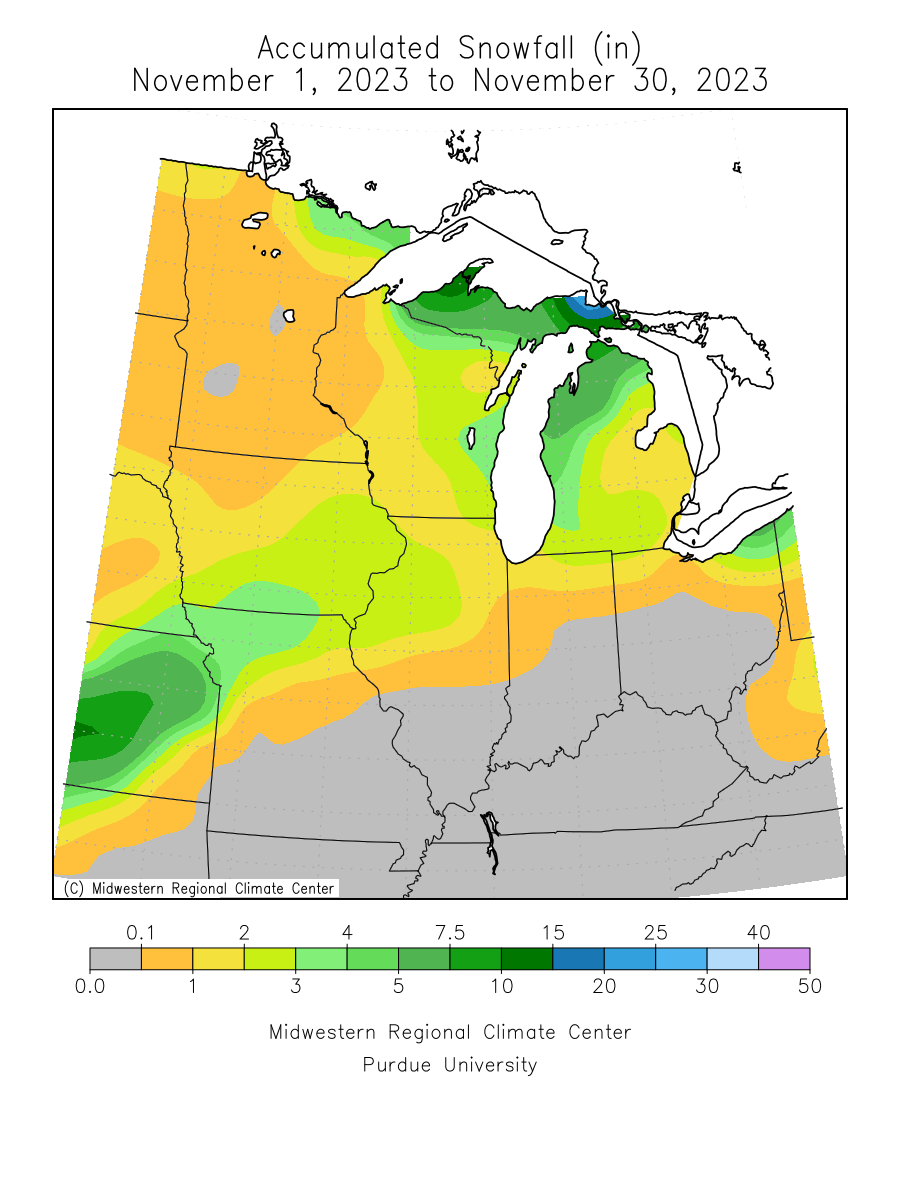
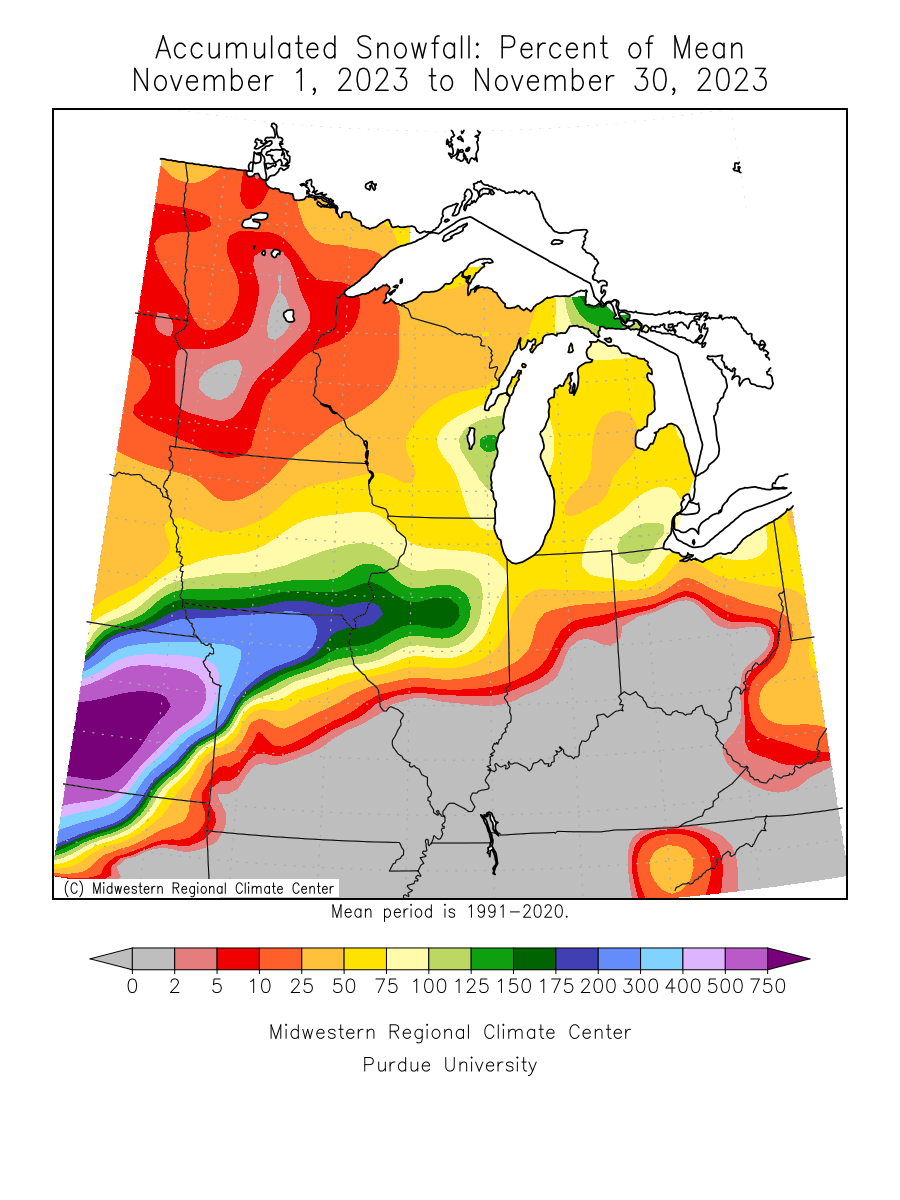
| Snowfall totals were about normal. |
| Please see Nov Records for monthly record information. |
| |
|
|
| |
| The climate maps below are courtesy of the Northeast Regional Climate Center and Midwest Regional Climate Center. |
| These maps should update to the most recent "last month" on the first of the month. |
| |
|
|
|
|
|
Average
Temperature |
Temperature
Departure from Normal |
Precipitation |
Precipitation
Percent of Normal |
Accumulated
Snowfall |
Accumulated
Snowfall
Percent of Mean |
 |
 |
 |
 |
 |
 |
|
| |
| |
| |
| |
| Climate/Almanac Data - Autumn Normals - Autumn Records |
| |
AUTUMN
(SEP-NOV) |
| |
|
Site
(Click site name for report courtesy of the
Iowa Environmental Mesonet.)
|
Avg
Temp |
Normal|
1991-2020 |
Dept
From
Norm |
Precip
Total |
Normal |
Dept
From
Norm |
Snowfall
Total |
Normal |
Dept
From
Norm |
| Burlington |
55.2° |
54.0° |
+1.2° |
4.82" |
8.91" |
-4.09" |
NA |
NA |
NA |
| Cedar Rapids |
53.8° |
50.3° |
+3.5° |
4.57" |
8.31" |
-3.74" |
NA |
NA |
NA |
| Davenport |
54.8° |
52.1° |
+2.7° |
6.81" |
8.42" |
-1.61" |
3.3" |
NA |
NA |
| Dubuque |
52.2° |
49.6° |
+2.6° |
8.37" |
8.96" |
-0.59" |
2.6" |
3.3" |
-0.7" |
| Iowa City |
54.9° |
52.9° |
+2.0° |
5.35" |
8.39" |
-3.04" |
NA |
NA |
NA |
| Moline |
55.2° |
53.4° |
+1.8° |
8.65" |
8.43" |
+0.22" |
2.6" |
2.4" |
+0.2" |
|
| The ranking is listed in parentheses (__) when within the "Top 10". |
| |
| Autumn 2023 was about 1 to 3.5 degrees above normal. |
| Rainfall totals were close to normal at Moline and Dubuque while elsewhere it was near 1.5 to 4 inches below normal. |
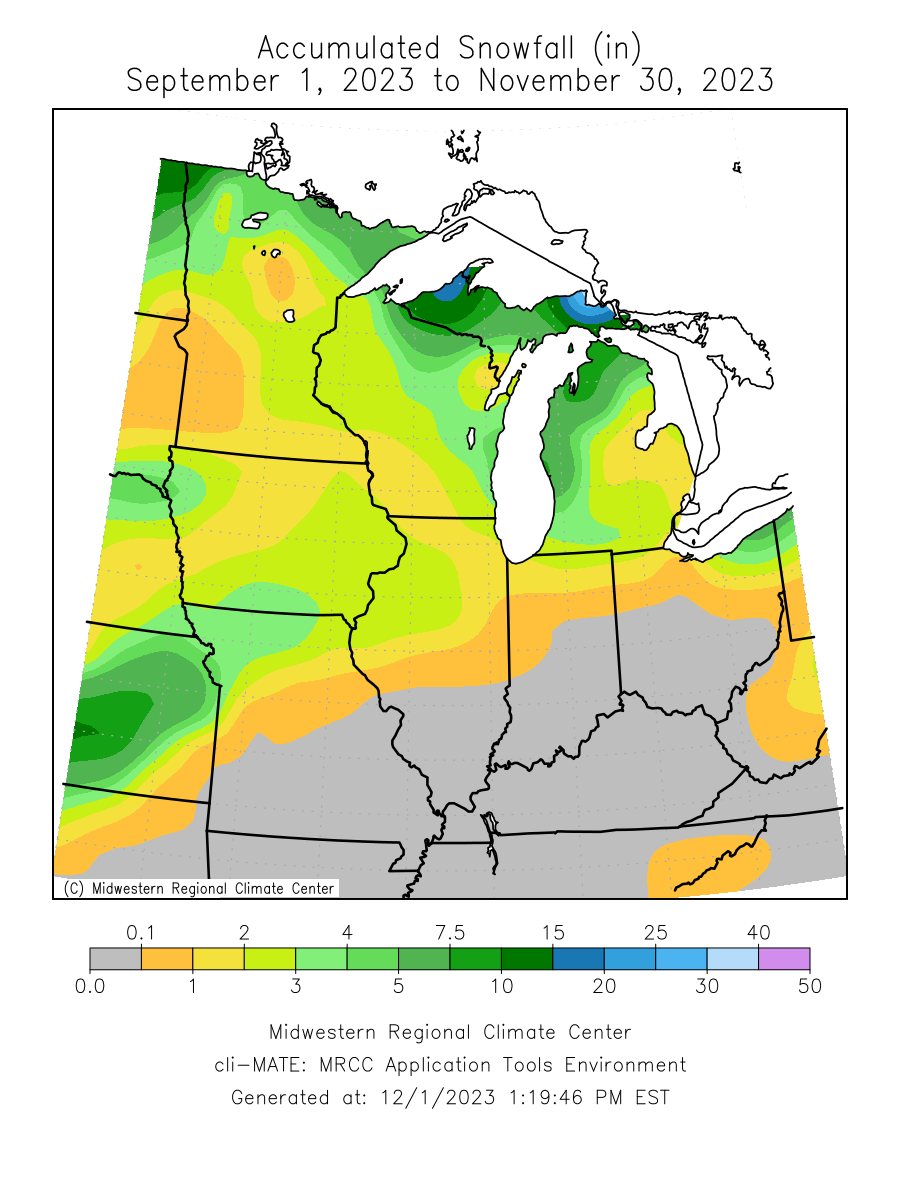
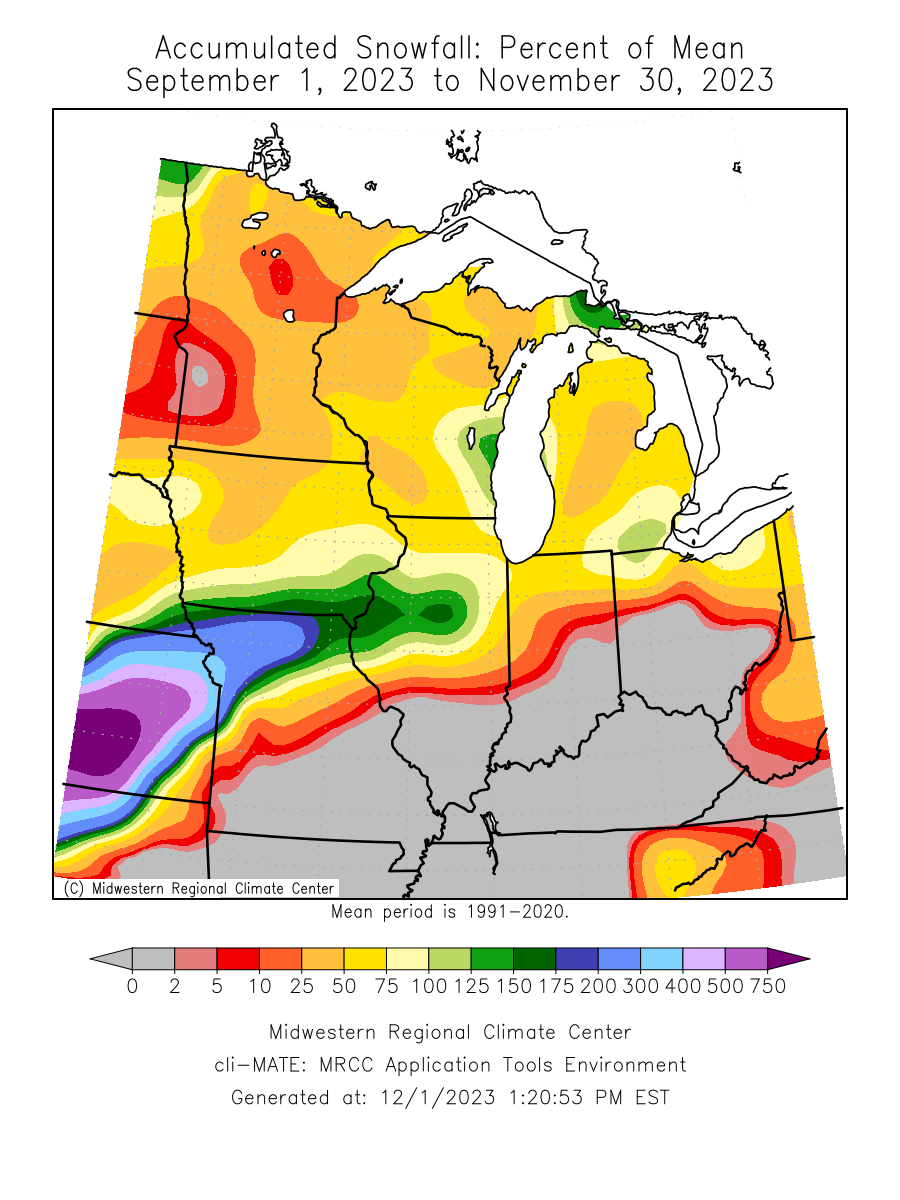
| Snowfall totals were about normal. |
| Please see Autumn Records for seasonal record information. |
| |
| |
| The climate maps below are courtesy of the Northeast Regional Climate Center and Midwest Regional Climate Center. |
| These maps become available or updated a few days after December 1st. |
| |
| |
|
|
|
|
|
Sep-Nov
Average Temperature |
Sep-Nov Temperature
Departure from Normal |
Sep-Nov
Precipitation |
Sep-Nov Precipitation
Percent of Normal |
Accumulated
Snowfall |
Accumulated
Snowfall
Percent of Mean |
 |
 |
 |
 |
 |
 |
|
| |
| |
| A LOOK AHEAD |
| |
| Climate Prediction Center |
| |
December
Temperature Outlook |
December
Precipitation Outlook |
December - February
Temperature Outlook |
December - February
Precipitation Outlook |
 |
 |
 |
 |
|
| |
| |
| |
| |
| |
| |
| |
| |