North and Central Georgia
2019 Annual Climate Summary
Overall, 2019 was both warmer and drier for all of North and Central Georgia.
Jump to:
| Average Temperatures | Precipitation Totals | Snowfall Totals | Narrative Summary |
Annual Top 10 Rankings:
Athens
Atlanta
Columbus
Macon
Annual Avg. Temperature (ºF) and Rankings
* Click on site name below to view a graph with additional data
|
Site |
Avg. Temp. and Current Ranking |
Normal |
Dep. from Normal |
Previous Records |
|
64.9 (3rd Warmest) |
62.5 |
+2.4 |
65.6 (1933) |
|
|
66.1 (Warmest) |
62.5 |
+3.6 |
- |
|
|
68.5 (3rd Warmest) |
65.6 |
+2.9 |
69.3 (1927) |
|
|
67.2 (Warmest) |
64.5 |
+2.7 |
- |
|
|
63.4 |
60.1 |
+3.3 |
|
|
|
63.4 |
61.7 |
+1.7 |
|
|
|
64.4 |
61.8 |
+2.6 |
|
|
|
63.2 |
60.9 |
+2.3 |
|
|
|
65.7 |
61.4 |
+4.3 |
|
|
|
64.1 |
60.5 |
+3.6 |
|
Monthly Avg. Temperature (ºF)
DFN = Departure from normal
Athens
|
Month |
Jan |
Feb |
Mar |
Apr |
May |
Jun |
Jul |
Aug |
Sep |
Oct |
Nov |
Dec |
|
Temp. |
45.0 |
52.2 |
53.5 |
63.9 |
75.5 |
77.0 |
82.0 |
80.3 |
79.3 |
67.4 |
51.9 |
50.2 |
|
Normal |
43.5 |
47.2 |
54.3 |
61.7 |
70.0 |
77.5 |
80.6 |
79.6 |
73.3 |
63.0 |
53.8 |
45.4 |
|
DFN |
+1.5 |
+5.0 |
-0.8 |
+2.2 |
+5.5 |
-0.5 |
+1.4 |
+0.7 |
+6.0 |
+4.4 |
-1.9 |
+4.8 |
Atlanta
|
Month |
Jan |
Feb |
Mar |
Apr |
May |
Jun |
Jul |
Aug |
Sep |
Oct |
Nov |
Dec |
|
Temp. |
45.9 |
53.8 |
55.4 |
65.3 |
76.4 |
77.7 |
82.2 |
82.5 |
82.4 |
68.4 |
52.5 |
51.2 |
|
Normal |
43.3 |
47.2 |
54.3 |
62.0 |
70.1 |
77.3 |
80.2 |
79.4 |
73.5 |
63.3 |
54.0 |
45.3 |
|
DFN |
+2.6 |
+6.6 |
+1.1 |
+3.3 |
+6.3 |
+0.4 |
+2.0 |
+3.1 |
+8.9 |
+5.1 |
-1.5 |
+5.9 |
Columbus
|
Month |
Jan |
Feb |
Mar |
Apr |
May |
Jun |
Jul |
Aug |
Sep |
Oct |
Nov |
Dec |
|
Temp. |
49.7 |
58.7 |
57.7 |
66.5 |
77.8 |
80.7 |
83.3 |
83.7 |
83.3 |
71.9 |
54.9 |
53.9 |
|
Normal |
47.2 |
51.1 |
57.8 |
64.6 |
73.0 |
79.8 |
82.5 |
81.9 |
76.6 |
66.5 |
57.3 |
49.1 |
|
DFN |
+2.5 |
+7.6 |
-0.1 |
+1.9 |
+4.8 |
+0.9 |
+0.8 |
+1.8 |
+6.7 |
+5.4 |
-2.4 |
+4.8 |
Macon
|
Month |
Jan |
Feb |
Mar |
Apr |
May |
Jun |
Jul |
Aug |
Sep |
Oct |
Nov |
Dec |
|
Temp. |
48.8 |
55.8 |
56.5 |
65.3 |
77.1 |
79.9 |
82.9 |
82.8 |
81.1 |
71.1 |
53.3 |
52.3 |
|
Normal |
46.3 |
50.0 |
56.8 |
63.4 |
71.9 |
78.9 |
81.8 |
80.9 |
75.0 |
64.9 |
55.9 |
48.0 |
|
DFN |
+2.5 |
+5.8 |
-0.3 |
+1.9 |
+5.2 |
+1.0 |
+1.1 |
+1.9 |
+6.1 |
+6.2 |
-2.6 |
+4.3 |
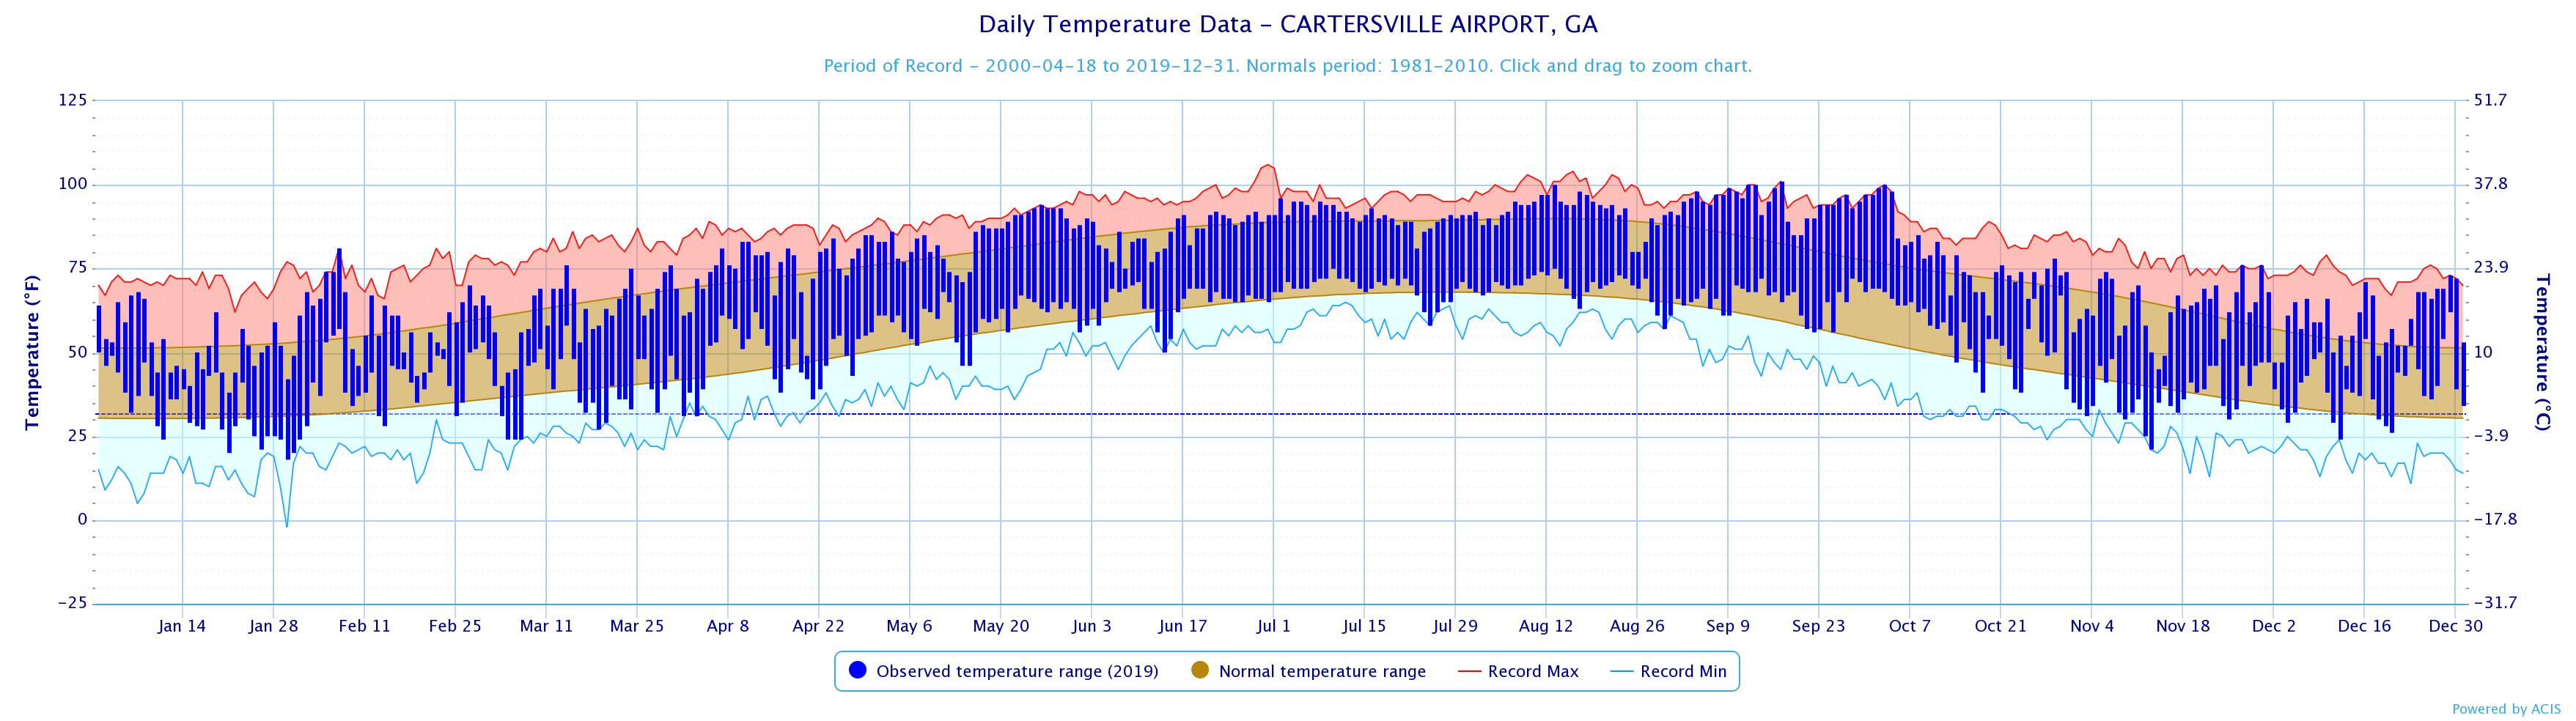
Cartersville
|
Month |
Jan |
Feb |
Mar |
Apr |
May |
Jun |
Jul |
Aug |
Sep |
Oct |
Nov |
Dec |
|
Temp. |
42.5 |
50.6 |
51.2 |
61.9 |
72.5 |
75.2 |
79.9 |
80.5 |
80.0 |
66.8 |
50.1 |
49.8 |
|
Normal |
41.1 |
44.6 |
51.7 |
59.2 |
67.6 |
74.8 |
78.3 |
78.2 |
71.3 |
60.6 |
51.3 |
42.6 |
|
DFN |
+1.4 |
+6.0 |
-0.5 |
+2.7 |
+4.9 |
+0.4 |
+1.6 |
+2.3 |
+8.7 |
+6.2 |
-1.2 |
+7.2 |
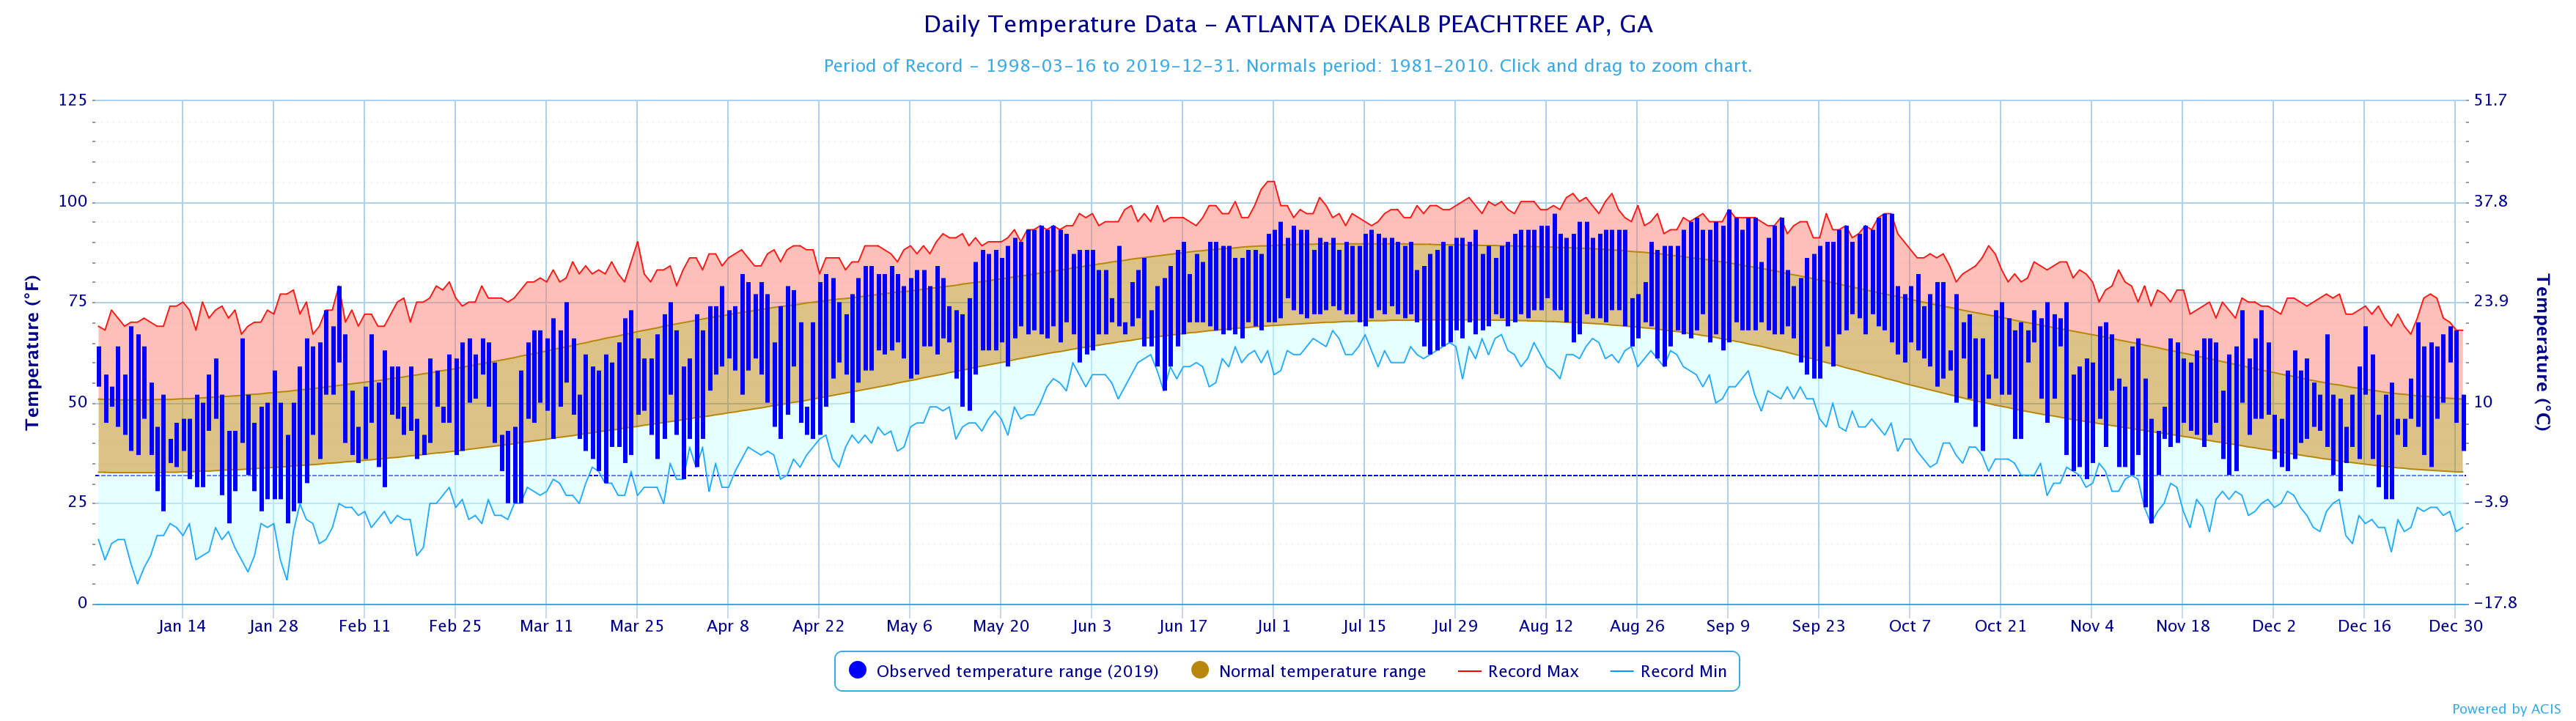
DeKalb Peachtree Arpt
|
Month |
Jan |
Feb |
Mar |
Apr |
May |
Jun |
Jul |
Aug |
Sep |
Oct |
Nov |
Dec |
|
Temp. |
43.4 |
50.6 |
52.1 |
62.4 |
73.9 |
75.6 |
80.2 |
79.8 |
78.7 |
65.6 |
49.8 |
48.3 |
|
Normal |
42.2 |
46.1 |
53.3 |
61.6 |
69.4 |
76.8 |
79.8 |
79.0 |
72.9 |
61.9 |
52.7 |
44.3 |
|
DFN |
+1.2 |
+4.5 |
-1.2 |
+0.8 |
+4.5 |
-1.2 |
+0.4 |
+0.8 |
+5.8 |
+3.7 |
-2.9 |
+4.0 |
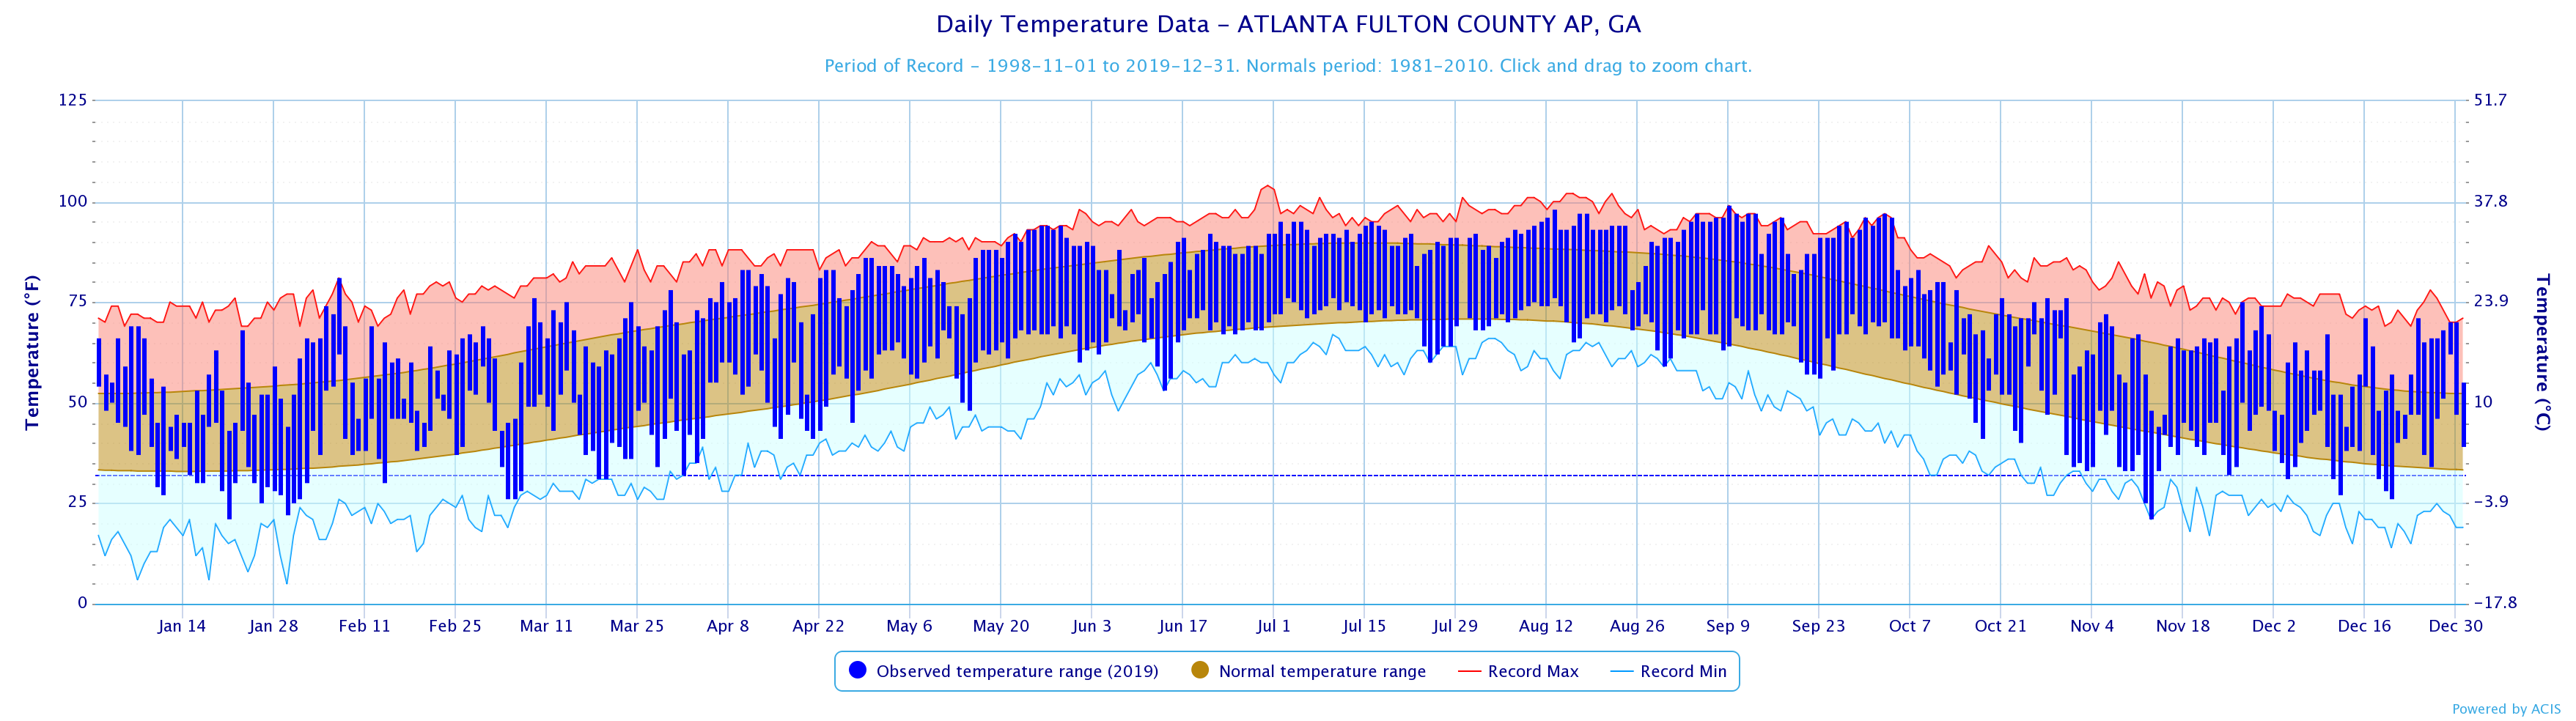
Fulton Co. Arpt
|
Month |
Jan |
Feb |
Mar |
Apr |
May |
Jun |
Jul |
Aug |
Sep |
Oct |
Nov |
Dec |
|
Temp. |
44.8 |
52.2 |
53.6 |
63.3 |
74.2 |
76.2 |
81.2 |
80.8 |
79.5 |
66.6 |
50.5 |
49.5 |
|
Normal |
43.1 |
46.3 |
53.6 |
61.0 |
69.3 |
76.7 |
79.8 |
78.8 |
72.8 |
62.5 |
53.0 |
44.8 |
|
DFN |
+1.7 |
+5.9 |
0.0 |
+2.3 |
+4.9 |
-0.5 |
+1.4 |
+2.0 |
+6.7 |
+4.1 |
-2.5 |
+4.7 |
Gainesville
|
Month |
Jan |
Feb |
Mar |
Apr |
May |
Jun |
Jul |
Aug |
Sep |
Oct |
Nov |
Dec |
|
Temp. |
42.9 |
50.4 |
51.7 |
62.7 |
73.6 |
75.1 |
79.8 |
78.8 |
78.8 |
65.6 |
50.6 |
48.3 |
|
Normal |
41.7 |
45.5 |
52.7 |
60.4 |
68.2 |
75.6 |
78.8 |
78.1 |
71.7 |
61.7 |
52.6 |
43.7 |
|
DFN |
+1.2 |
+4.9 |
-1.0 |
+2.3 |
+5.4 |
-0.5 |
+1.0 |
+0.7 |
+7.1 |
+3.9 |
-2.0 |
+4.6 |
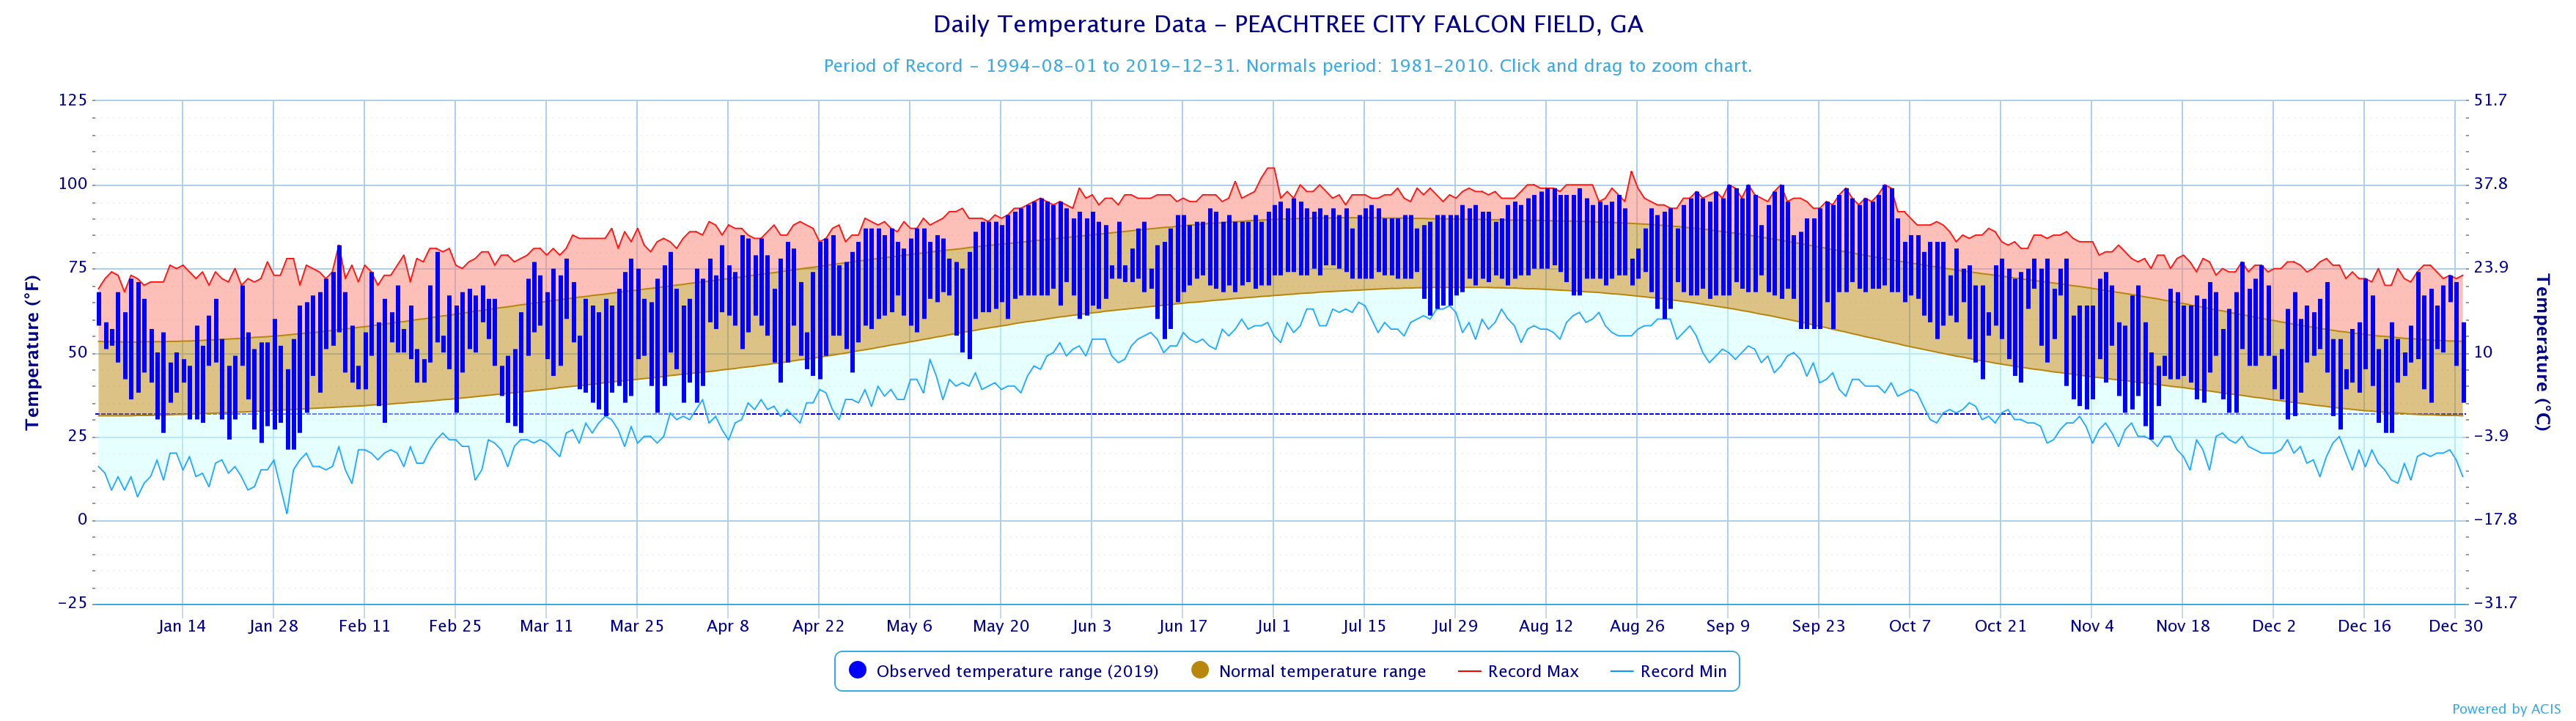
Peachtree City
|
Month |
Jan |
Feb |
Mar |
Apr |
May |
Jun |
Jul |
Aug |
Sep |
Oct |
Nov |
Dec |
|
Temp. |
46.1 |
54.3 |
55.2 |
64.1 |
75.2 |
77.5 |
81.5 |
82.2 |
80.5 |
68.8 |
52.0 |
51.0 |
|
Normal |
42.8 |
46.7 |
53.2 |
60.5 |
68.9 |
75.9 |
79.3 |
78.6 |
72.1 |
61.4 |
52.7 |
44.4 |
|
DFN |
+3.3 |
+7.6 |
+2.0 |
+3.6 |
+6.3 |
+1.6 |
+2.2 |
+3.6 |
+8.4 |
+7.4 |
-0.7 |
+6.6 |
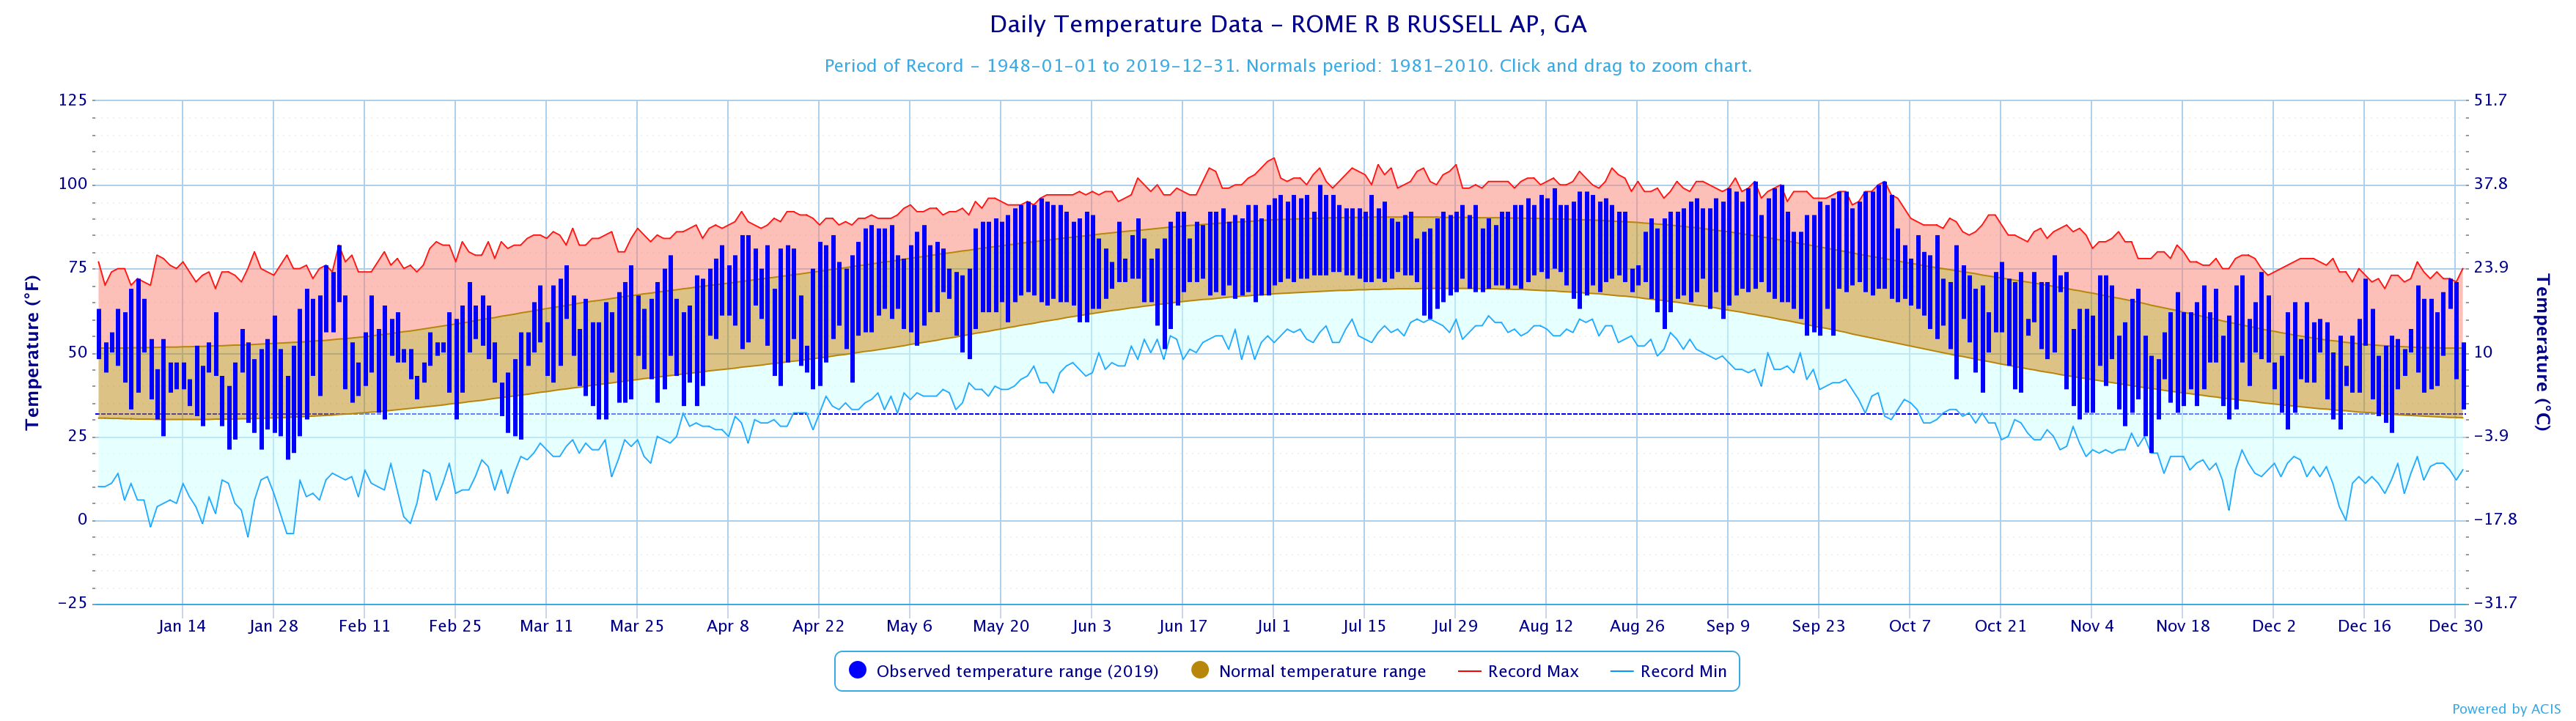
Rome
|
Month |
Jan |
Feb |
Mar |
Apr |
May |
Jun |
Jul |
Aug |
Sep |
Oct |
Nov |
Dec |
|
Temp. |
43.5 |
51.6 |
52.2 |
63.4 |
74.1 |
76.9 |
81.8 |
80.5 |
80.0 |
66.4 |
49.9 |
49.2 |
|
Normal |
41.1 |
44.3 |
52.1 |
59.8 |
68.2 |
75.9 |
79.4 |
78.6 |
72.0 |
61.1 |
50.9 |
42.6 |
|
DFN |
+2.4 |
+7.3 |
+0.1 |
+3.6 |
+5.9 |
+1.0 |
+2.4 |
+1.9 |
+8.0 |
+5.3 |
-1.0 |
+6.6 |
Temp. Extremes (ºF)
|
Site |
Warmest Temp. |
Coldest Temp. |
|
Athens |
100 (10/3)* |
23 (1/30) |
|
Atlanta |
100 (8/13)* |
22 (1/21) |
|
Columbus |
101 (8/17,9/17,10/4*) |
24 (1/30) |
|
Macon |
103 (9/17*,10/4*) |
22 (1/31) |
|
Cartersville |
101 (9/17)* |
18 (1/30) |
|
DeKalb Peachtree Arpt |
98 (9/9)* |
20 (1/21,1/30,11/13*) |
|
Fulton Co. Arpt |
101 (7/30)* |
21 (1/21,11/13*) |
|
Gainesville |
96 (9/9*,9/12*,9/17*,10/3*,10/4*) |
21 (1/21) |
|
Peachtree City |
100 (9/9*,9/12*,9/17*,10/3*) |
21 (1/30,1/31) |
|
Rome |
101 (9/13*,10/3*) |
18 (1/30) |
* Set record for day; Bold = Warmest Monthly Temperature
Annual Precipitation Totals (inches) and Rankings
* Click on site name below to view a graph with additional data
|
Site |
Total Precip. and Current Ranking |
Normal |
Dep. from Normal |
Previous Records |
|
46.31 (58th Driest) |
46.33 |
-0.02 |
72.37 (1929) |
|
|
43.74 (44th Driest) |
49.71 |
-5.97 |
71.45 (1948) |
|
|
48.96 (60th Wettest) |
46.75 |
+2.21 |
80.20 (2009) |
|
|
44.47 (61st Wettest) |
45.68 |
-1.21 |
72.67 (2013) |
|
|
44.79 |
49.93 |
-5.14 |
|
|
|
48.39 |
52.97 |
-4.58 |
|
|
|
44.68 |
51.17 |
-6.49 |
|
|
|
50.00 |
53.98 |
-3.98 |
|
|
|
47.91 |
49.99 |
-2.08 |
|
|
|
59.73 |
51.92 |
+7.81 |
|
Monthly Precipitation Totals (inches)
DFN = Departure from normal
Athens
|
Month |
Jan |
Feb |
Mar |
Apr |
May |
Jun |
Jul |
Aug |
Sep |
Oct |
Nov |
Dec |
|
Total |
5.34 |
3.61 |
2.09 |
3.38 |
1.62 |
7.03 |
1.37 |
8.78 |
1.40 |
3.81 |
2.14 |
5.74 |
|
Normal |
4.05 |
4.48 |
4.43 |
3.15 |
3.00 |
4.18 |
4.47 |
3.53 |
3.94 |
3.55 |
3.82 |
3.73 |
|
DFN |
+1.29 |
-0.87 |
-2.34 |
+0.23 |
-1.38 |
+2.85 |
-3.10 |
+5.25 |
-2.54 |
+0.26 |
-1.68 |
+2.01 |
Atlanta
|
Month |
Jan |
Feb |
Mar |
Apr |
May |
Jun |
Jul |
Aug |
Sep |
Oct |
Nov |
Dec |
|
Total |
6.23 |
4.14 |
2.17 |
6.34 |
2.28 |
6.46 |
2.06 |
1.89 |
0.76 |
3.59 |
2.68 |
5.14 |
|
Normal |
4.20 |
4.67 |
4.81 |
3.36 |
3.67 |
3.95 |
5.27 |
3.90 |
4.47 |
3.41 |
4.10 |
3.90 |
|
DFN |
+2.03 |
-0.53 |
-2.64 |
+2.98 |
-1.39 |
+2.51 |
-3.21 |
-2.01 |
-3.71 |
+0.18 |
-1.42 |
+1.24 |
Columbus
|
Month |
Jan |
Feb |
Mar |
Apr |
May |
Jun |
Jul |
Aug |
Sep |
Oct |
Nov |
Dec |
|
Total |
5.65 |
1.50 |
2.46 |
4.36 |
3.59 |
6.42 |
3.92 |
3.54 |
1.29 |
4.34 |
3.84 |
8.05 |
|
Normal |
3.85 |
4.44 |
5.46 |
3.55 |
3.19 |
3.72 |
4.76 |
3.77 |
3.06 |
2.58 |
4.10 |
4.27 |
|
DFN |
+1.80 |
-2.94 |
-3.00 |
+0.81 |
+0.40 |
+2.70 |
-0.84 |
-0.23 |
-1.77 |
+1.76 |
-0.26 |
+3.78 |
Macon
|
Month |
Jan |
Feb |
Mar |
Apr |
May |
Jun |
Jul |
Aug |
Sep |
Oct |
Nov |
Dec |
|
Total |
6.15 |
1.37 |
1.52 |
2.90 |
1.47 |
4.30 |
3.40 |
6.19 |
0.02 |
5.59 |
2.89 |
8.67 |
|
Normal |
4.24 |
4.36 |
4.55 |
2.96 |
2.72 |
4.06 |
4.95 |
4.10 |
3.59 |
2.79 |
3.32 |
4.04 |
|
DFN |
+1.91 |
-2.99 |
-3.03 |
-0.06 |
-1.25 |
+0.24 |
-1.55 |
+2.09 |
-3.57 |
+2.80 |
-0.43 |
+4.63 |
Cartersville
|
Month |
Jan |
Feb |
Mar |
Apr |
May |
Jun |
Jul |
Aug |
Sep |
Oct |
Nov |
Dec |
|
Total |
4.71 |
7.55 |
2.82 |
4.58 |
1.89 |
2.54 |
4.44 |
3.01 |
0.14 |
6.58 |
2.46 |
4.07 |
|
Normal |
4.60 |
4.90 |
4.72 |
3.91 |
4.03 |
3.84 |
4.66 |
3.93 |
3.62 |
3.40 |
4.08 |
4.24 |
|
DFN |
+0.11 |
+2.65 |
-1.90 |
+0.67 |
-2.14 |
-1.30 |
-0.22 |
-0.92 |
-3.48 |
+3.18 |
-1.62 |
-0.17 |
DeKalb Peachtree Arpt
|
Month |
Jan |
Feb |
Mar |
Apr |
May |
Jun |
Jul |
Aug |
Sep |
Oct |
Nov |
Dec |
|
Total |
5.37 |
5.16 |
2.85 |
7.10 |
2.79 |
4.91 |
3.14 |
4.24 |
1.34 |
4.30 |
2.62 |
4.57 |
|
Normal |
4.80 |
5.01 |
4.98 |
3.65 |
4.05 |
4.76 |
5.02 |
4.31 |
4.56 |
3.45 |
4.22 |
4.16 |
|
DFN |
+0.57 |
+0.15 |
-2.13 |
+3.45 |
-1.26 |
+0.15 |
-1.88 |
-0.07 |
-3.22 |
+0.85 |
-1.60 |
+0.41 |
Fulton Co. Arpt
|
Month |
Jan |
Feb |
Mar |
Apr |
May |
Jun |
Jul |
Aug |
Sep |
Oct |
Nov |
Dec |
|
Total |
5.32 |
5.63 |
2.82 |
6.01 |
1.71 |
5.00 |
2.17 |
1.63 |
1.66 |
4.85 |
3.04 |
4.84 |
|
Normal |
4.27 |
4.90 |
4.81 |
3.74 |
3.77 |
4.13 |
5.06 |
4.74 |
3.98 |
3.61 |
4.17 |
3.99 |
|
DFN |
+1.05 |
+0.73 |
-1.99 |
+2.27 |
-2.06 |
+0.87 |
-2.89 |
-3.11 |
-2.32 |
+1.24 |
-1.13 |
+0.85 |
Gainesville
|
Month |
Jan |
Feb |
Mar |
Apr |
May |
Jun |
Jul |
Aug |
Sep |
Oct |
Nov |
Dec |
|
Total |
5.29 |
7.23 |
2.79 |
6.31 |
3.17 |
6.98 |
3.31 |
2.47 |
0.57 |
4.22 |
3.03 |
4.63 |
|
Normal |
5.03 |
4.87 |
5.42 |
3.56 |
4.04 |
4.39 |
4.51 |
4.43 |
4.68 |
4.08 |
4.47 |
4.50 |
|
DFN |
+0.26 |
+2.36 |
-2.63 |
+2.75 |
-0.87 |
+2.59 |
-1.20 |
-1.96 |
-4.11 |
+0.14 |
-1.44 |
+0.13 |
Peachtree City
|
Month |
Jan |
Feb |
Mar |
Apr |
May |
Jun |
Jul |
Aug |
Sep |
Oct |
Nov |
Dec |
|
Total |
6.40 |
2.36 |
2.50 |
7.02 |
2.48 |
8.78 |
2.08 |
1.43 |
1.32 |
3.23 |
3.10 |
7.21 |
|
Normal |
4.20 |
4.90 |
5.11 |
3.92 |
3.39 |
3.63 |
5.26 |
4.32 |
3.84 |
3.41 |
3.87 |
4.14 |
|
DFN |
+2.20 |
-2.54 |
-2.61 |
+3.10 |
-0.91 |
+5.15 |
-3.18 |
-2.89 |
-2.52 |
-0.18 |
-0.77 |
+3.07 |
Rome
|
Month |
Jan |
Feb |
Mar |
Apr |
May |
Jun |
Jul |
Aug |
Sep |
Oct |
Nov |
Dec |
|
Total |
6.82 |
10.83 |
5.18 |
3.71 |
2.43 |
3.59 |
4.20 |
5.69 |
0.31 |
7.84 |
2.79 |
6.34 |
|
Normal |
4.82 |
4.87 |
4.95 |
4.05 |
4.18 |
4.10 |
4.32 |
4.13 |
3.41 |
3.86 |
4.85 |
4.38 |
|
DFN |
+2.00 |
+5.96 |
+0.23 |
-0.34 |
-1.75 |
-0.73 |
+0.07 |
+2.28 |
-3.55 |
+2.99 |
-1.59 |
+1.96 |
Annual Precip. Extremes (in)
|
Site |
Highest Daily Amount |
|
Athens |
3.73 (8/4) |
|
Atlanta |
3.90 (6/8)* |
|
Columbus |
2.84 (12/22) |
|
Macon |
3.11 (12/13)* |
|
Cartersville |
2.20 (4/19)* |
|
DeKalb Peachtree Arpt |
3.26 (4/19)* |
|
Fulton Co. Arpt |
2.74 (6/8)* |
|
Gainesville |
3.01 (4/19)* |
|
Peachtree City |
4.37 (4/19)* |
|
Rome |
3.26 (7/20)* |
* Set record for a day; Bold = Highest daily amount for that month on record
Annual Snowfall Totals (inches) – (Jan to Dec)
|
Site |
Total |
Normal |
Dep. from Normal |
Records |
|
Athens |
0.0 |
2.9 |
-2.9 |
10.6 (1983) |
|
Atlanta |
0.0 |
2.9 |
-2.9 |
10.5 (1936) |
|
Columbus |
0.0 |
0.4 |
-0.4 |
14.0 (1973) |
|
Macon |
0.0 |
0.7 |
-0.7 |
16.5 (1973) |
2019 Narrative Climate Summary For North and Central Georgia
To start off 2019, north and central Georgia were plagued with warm temperatures and above average rainfall. One of the river gauges in the city of Abbeville on the Ocmulgee River was in flood for 46 days, from the issuance of the flood warning on December 14th, 2018 through the cancellation on January 15th, 2019. In addition, all 10 of our routine climate sites recorded around an inch or two above average rainfall for the month of January. Temperatures within the first week of the year were well above average across north and central Georgia with highs reaching into the upper 60s and lower 70s. By the last of January there was a noticeable difference in temperatures. A cold spell brought on by an area of high pressure that had pushed into the area dropped low temperatures into the upper teens and lower 20s. Overall, January did end up slightly warmer and wetter than average.
After a quiet January in the way of severe weather, a line of thunderstorms swept across the area on the 14th of February producing 4 EF-0 tornadoes. Then on the 24th, an EF-1 tornado occurred in the city of Moreland in Coweta County. In addition, February was markedly well above average with all of our four primary climate sites having top 10 temperature records. Athens recorded its 10th warmest February on record, Atlanta had its 7th warmest, Columbus had its 5th warmest, and Macon had its 9th warmest on record. These anomalous temperatures led to high temperature records being broken across the area on the 7th. In addition to being hot, the area was split in terms of precipitation. The northern portions of the area ended up wet with the southern portions remaining dry. Columbus even recorded its 9th driest February on record with Macon recording its 7th driest February on record. In contrast, Rome accumulated 10.83 inches for the month, which was 5.96 inches above normal.
 |
| Tree on a house on Gordon Oaks Way. |
In March, we experienced the biggest severe weather outbreak of the year so far as a strong low pressure system swept through the area. By the morning of March 3rd, an enhanced risk had been issued by the Storm Prediction Center across the area and by that evening the office had received multiple reports of hail in addition to 14 tornadoes. The most notable tornado began across the Alabama border in Macon County west of the city of Beauregard before moving east through the city of Smith’s Station, producing EF4 damage in Alabama. This tornado continued into Georgia producing EF2/EF3 rating damage to the cities of Ellerslie and Talbotton and was on the ground for 68.8 miles before lifting.
 |
| Half-dollar hail was reported in Bryon |
 |
|
A house was destroyed in Talbotton. |
Through the month of April, two more severe weather events occurred. On April 14th in a round of severe weather, three EF0 tornadoes and one EF1 tornado were recorded across the area. Then, just a week later on April 19th, one EF0 and two EF1 tornadoes moved through the area in addition to a period of very heavy rainfall across the area. In just a few hours on Friday, April 19th, a swatch of very heavy rainfall fell across portions of northern Georgia. Some areas even received over 6 inches leading to flash flooding, areal flooding, and river flooding within the areas that received heavy rainfall.
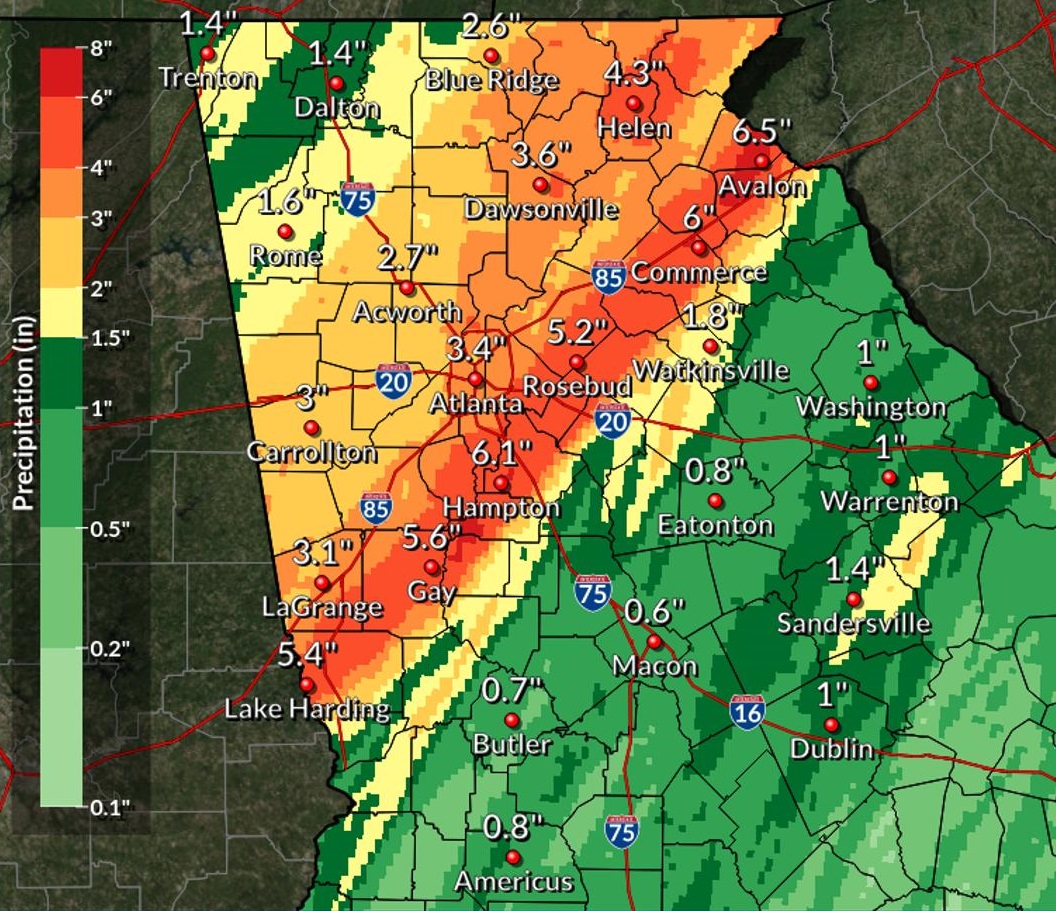 |
| Reported rainfall across the area in April |
 |
| Flooding reported in Clayton County. |
 |
| Flooded road in Troup County. |
Overall in the category of weather events, May was fairly quiet although there was severe weather reported in White County on the 12th. In terms of climate, May was record breaking. At the end of the month, a heat wave gripped the state with three all-time May temperature records broken at Atlanta (tied record highest minimum temperature on 5/28 with 75 degrees) and Macon (broken high temperature record on 5/26 with 100 degrees, tied high temperature record on 5/28 with 100 degrees). In addition, twenty-five individual temperature records were broken or tied between Atlanta, Athens, Columbus, and Macon. By the end of the month, all four of our primary climate sites had seen top 10 record monthly temperatures. Athens recorded its 2nd warmest May on record, Atlanta recorded its warmest May on record, Columbus recorded its 3rd warmest May on record, and Macon had its 2nd warmest May on record.
.PNG) |
| Damage to roofs of chicken houses in White County. |
June ended up being average for temperatures, but total recorded precipitation was above normal with daily precipitation records broken on the 8th at many climate sites. Athens, Atlanta, and Columbus recorded daily precipitation records and two other climate sites recorded all-time June precipitation records (Fulton Co. Arpt – 2.74 inches; Peachtree City – 4.27 inches). For the month, Athens accumulated 3.61 inches, Atlanta accumulated 3.90 inches, and Columbus accumulated 2.20 inches. For the month of July, overall temperatures averaged a few degrees warmer than normal with drier than normal precipitation. In general, normal summertime storms continued to down trees sporadically over the months of June, July, and August.
During the month of August, the average temperature across the area was several degrees warmer than normal. Atlanta experienced a 100°F high on 8/13, and experienced 24 days of 90°F+ heat, compared to 10-11 days on average. In central Georgia, Macon also hit 100°F on the 13th, and only had 3 days in the month in which the temperature did not reach 90°F. Precipitation for the month was lower than average for the Atlanta metro and areas east, which would signal the beginning of the flash drought to come in September. Toward the end of August, most areas over Georgia received very little precipitation while above average heat continued with the prospect of a tropical system on the horizon.
 |
| Inside the eye of Hurricane Dorian. |
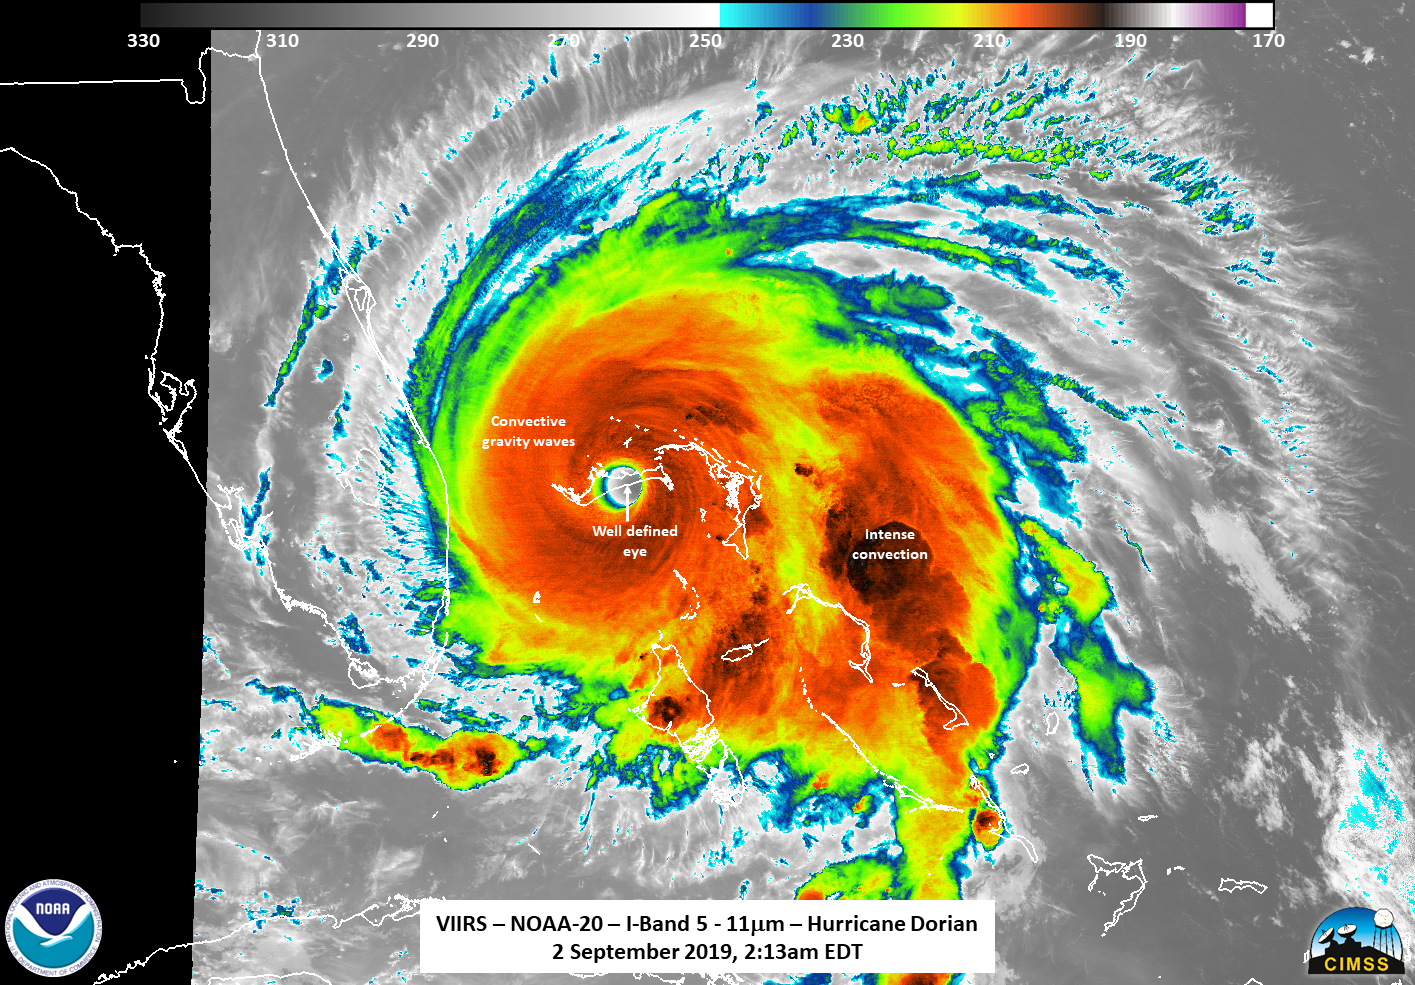 |
| Satellite imagery of Hurricane Dorian. |
By September 1, all eyes had turned towards Hurricane Dorian that was expected to impact the area within the first week of September. As the forecast updates continued, forecast tracks for Dorian shifted to the east and remained offshore of the United States, and eventually the area was finally cleared from the threat of Hurricane Dorian. While this was a welcome shift in the forecast, this also prevented much needed rains from impacting the area. This dry trend continued into September and early October with record breaking heat and little precipitation over all of the southeast. In Atlanta, 10 daily record highs were set during September, including a stretch at the end of the month into October in which 9 out of 10 days set daily record highs. Also, a total of 32 records were set at our 4 primary climate sites in addition to other numerous record highs at our other climate sites with 4 sites setting new all-time warmest September temperatures (Cartersville – 101° on the 17th; Dekalb Peachtree Airport – 98° on the 9th; Fulton County Airport – 99° on the 9th ; Peachtree City – 100° on the 9th, 12th, and 17th). In addition, Macon tied its driest September on record with only 0.02” of precipitation falling on the 10th, the only day in the month in which it precipitated. Rain did not fall again in Macon until October 13th. The 32 days without rainfall was the 10th longest streak on record for Macon. Overall for September, Atlanta ended up recording its 2nd warmest September on record, Athens recorded its 6th warmest September on record, Columbus recorded its 3rd warmest September on record, and Macon recorded its 4th warmest September on record.
This combination of both extreme heat as well as extreme lack of short term precipitation lead to the onset of a flash drought across our region and the southeast at large. While conventional droughts tend to form over long periods with lack of precipitation, flash droughts form rapidly due to rapid evapotranspiration rates (the rate at which water evaporates from plants and soil into the atmosphere) that occur with unusual hot, dry conditions over an area. These droughts can have a significant impact on agriculture as well as water supplies. During September, the heat and lack of precipitation lead to significant expansion of flash drought across our region, with 57% of our area considered to be in moderate (D1) or severe drought (D2) by the end of the month as defined by the drought monitor (https://droughtmonitor.unl.edu). At the beginning of October, the stretch of record setting temperatures described above with continued lack of precipitation lead to the introduction of extreme drought (D3) in several counties.
The heat continued into October with all four of our primary climate sites setting top 10 records for the month of October. Athens and Atlanta had its 5th warmest October on record, Columbus has its 7th warmest October on record, and Macon had its 4th warmest October on record. In addition, all 10 of our climate sites set new all-time warmest October temperature records and between the four primary climate sites 23 new daily records were set. Although the drought had already set in by mid-October, the area saw its highest coverage of D3 extreme drought at this point, with nearly 16% of the state of Georgia in extreme drought conditions. However, a very welcomed wet weather pattern set up for the second half of the month, which included Post Tropical Storm Nestor crossing the area, helping to provide much needed rainfall and ending the month just slightly above average in terms of precipitation.
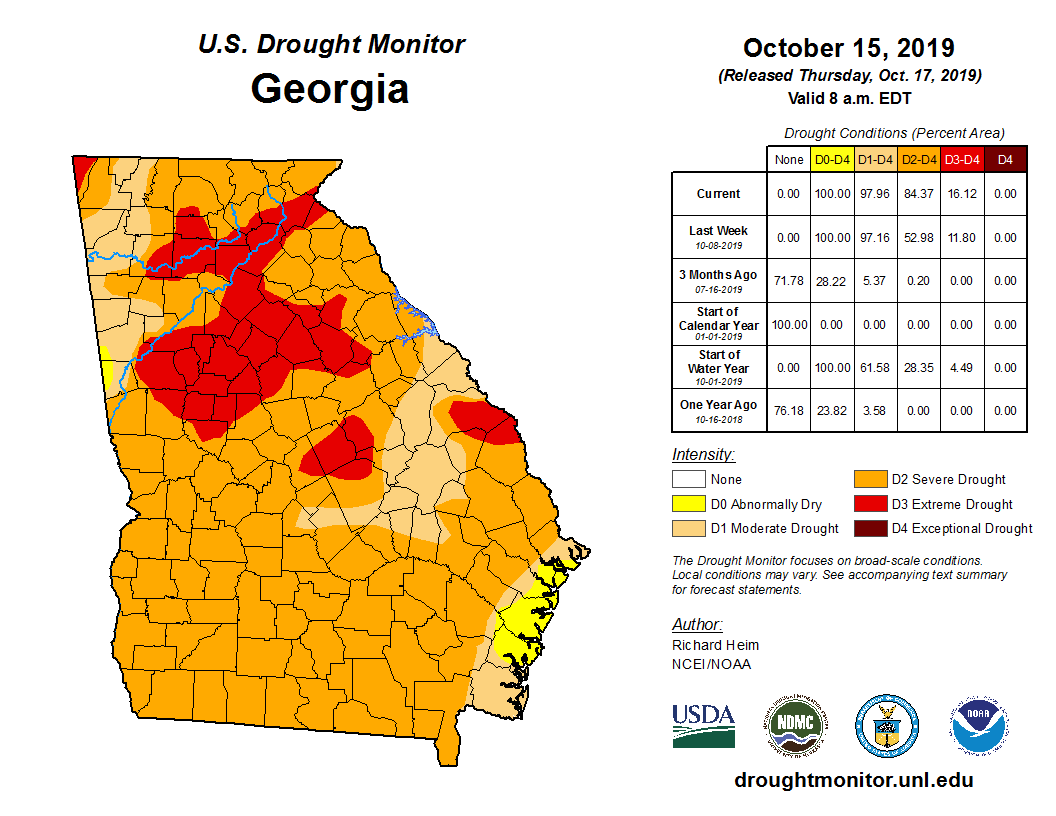 |
| Drought monitor from October 15th, 2019. |
For the first time in a while, temperatures averaged out to be just a couple degrees below normal in November, but the area was still dry. Although the area ended up with below average rainfall, there were enough rainfall events to assist with ending severe drought conditions across the area. By the end of November, only 4% of the area remained in D2 Severe Drought and many areas had improved significantly from mid-October conditions. Thankfully this rain came without any severe weather, as our office issued zero severe thunderstorm or tornado warnings during the month of November.
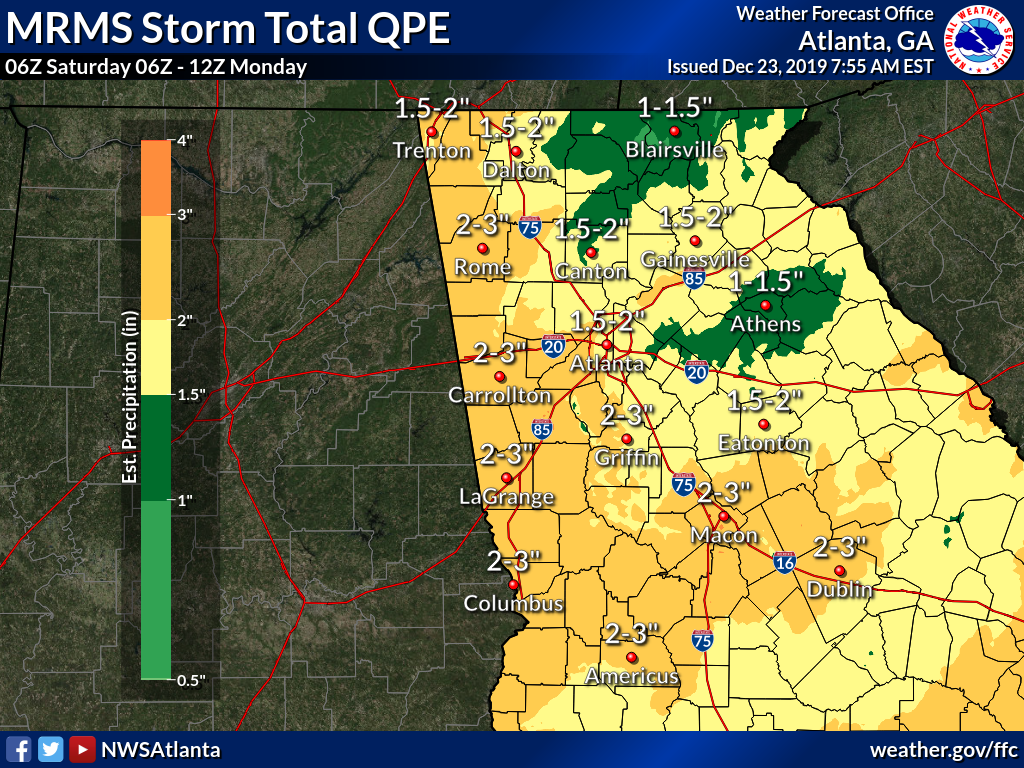
Following the very dry period would be a more normal late October and November followed by a very wet December for much of our area, but especially for portions of central Georgia. A series of storms brought very heavy rainfall across much of the area, leading to minor river flooding along numerous creeks and streams. The heavier rainfall in central Georgia lead to minor flooding along portions of the Oconee River which continued into the new year. Macon lead the way with our highest official total of 8.67”, but that likely was not the area of heaviest rain in the state for the month of December. Several counties to the east and northeast of Macon had estimated rainfall amounts from the River Forecast Center Quantitative Precipitation Estimates of nearly 10 inches or more in some locations. A good portion of that rainfall fell during two storms – a slow moving cold front on December 13th, which dumped 2-3” along and south of I-85, including some 4-6” totals just east of Macon, and a slowly moving surface low the weekend before Christmas, which had very gusty winds and widespread precipitation totals of 1.5-3”.
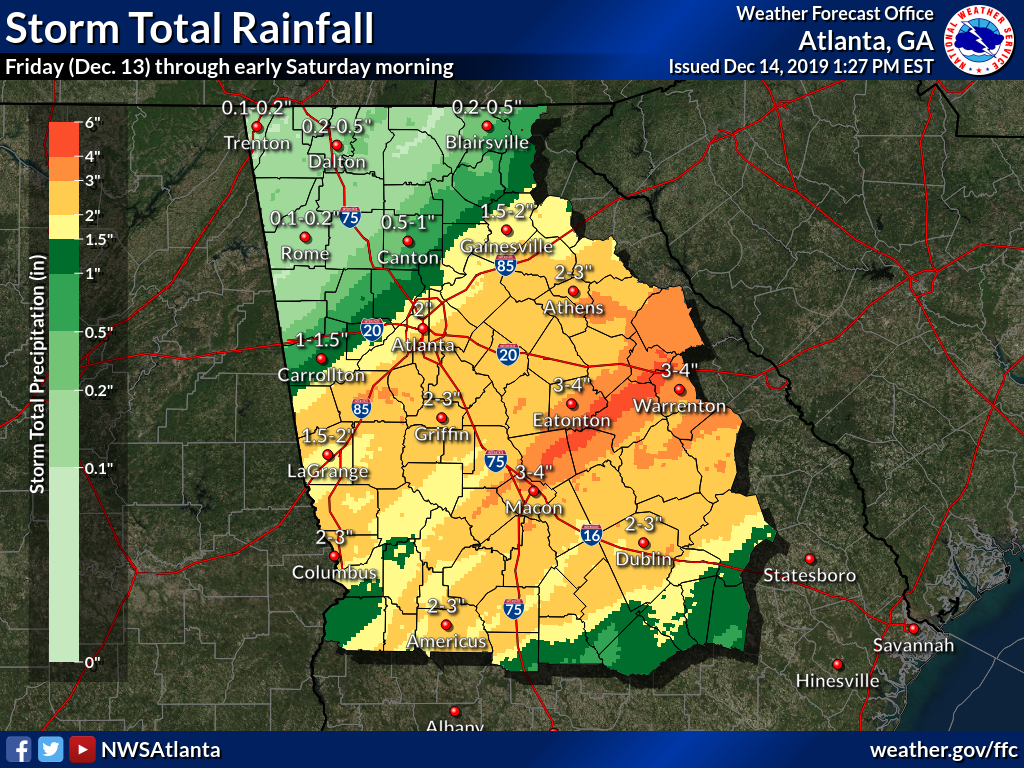 |
| Storm total rainfall from the office in December. |
 |
| Storm total rainfall from December. |
The biggest impact from these rains was to completely erase the flash drought which had developed in the months prior. The final drought monitor (https://droughtmonitor.unl.edu/data/png/20191231/20191231_ga_trd.png) of the year had zero drought across the entire state of Georgia, with zero of our counties even considered to be abnormally dry. The rainfall deficits across our area were significantly decreased as shown by the final yearly totals and percent of normal (average) rainfall listed below. More detailed information about the flash drought of 2019 can be found in our final drought information statement, which is located with other rainfall related information at: https://weather.gov/ffc/raindef
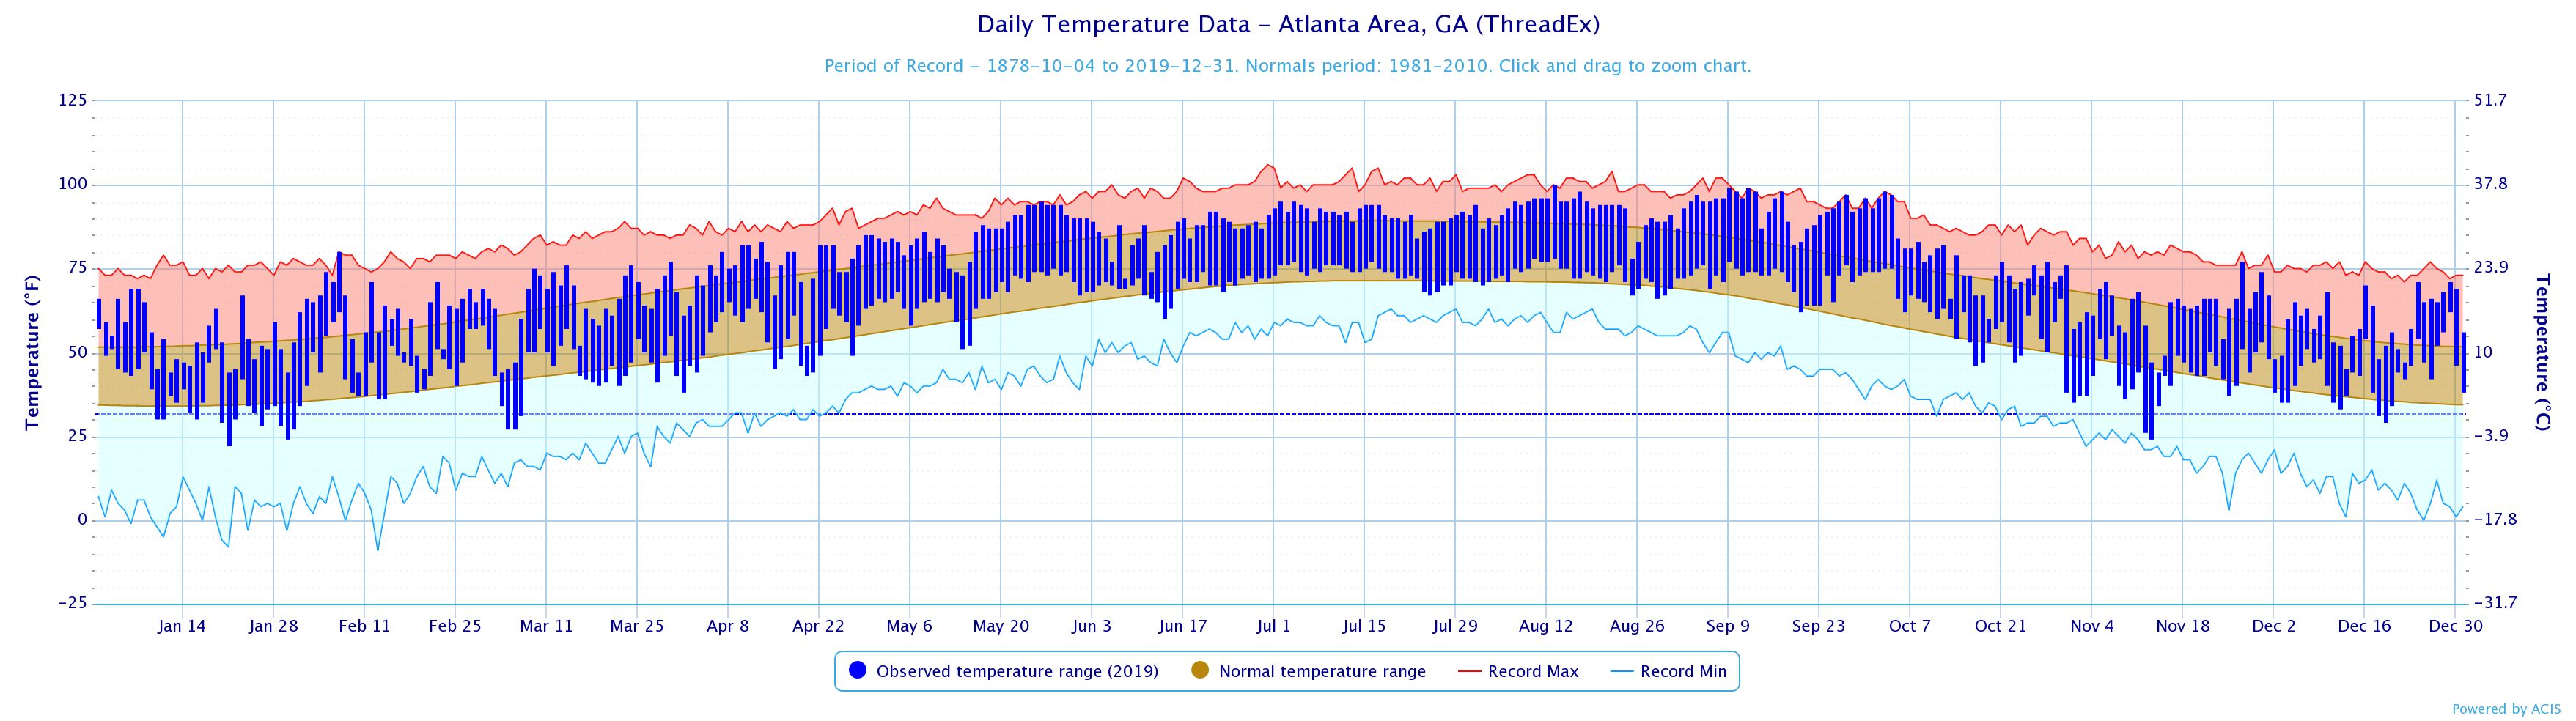
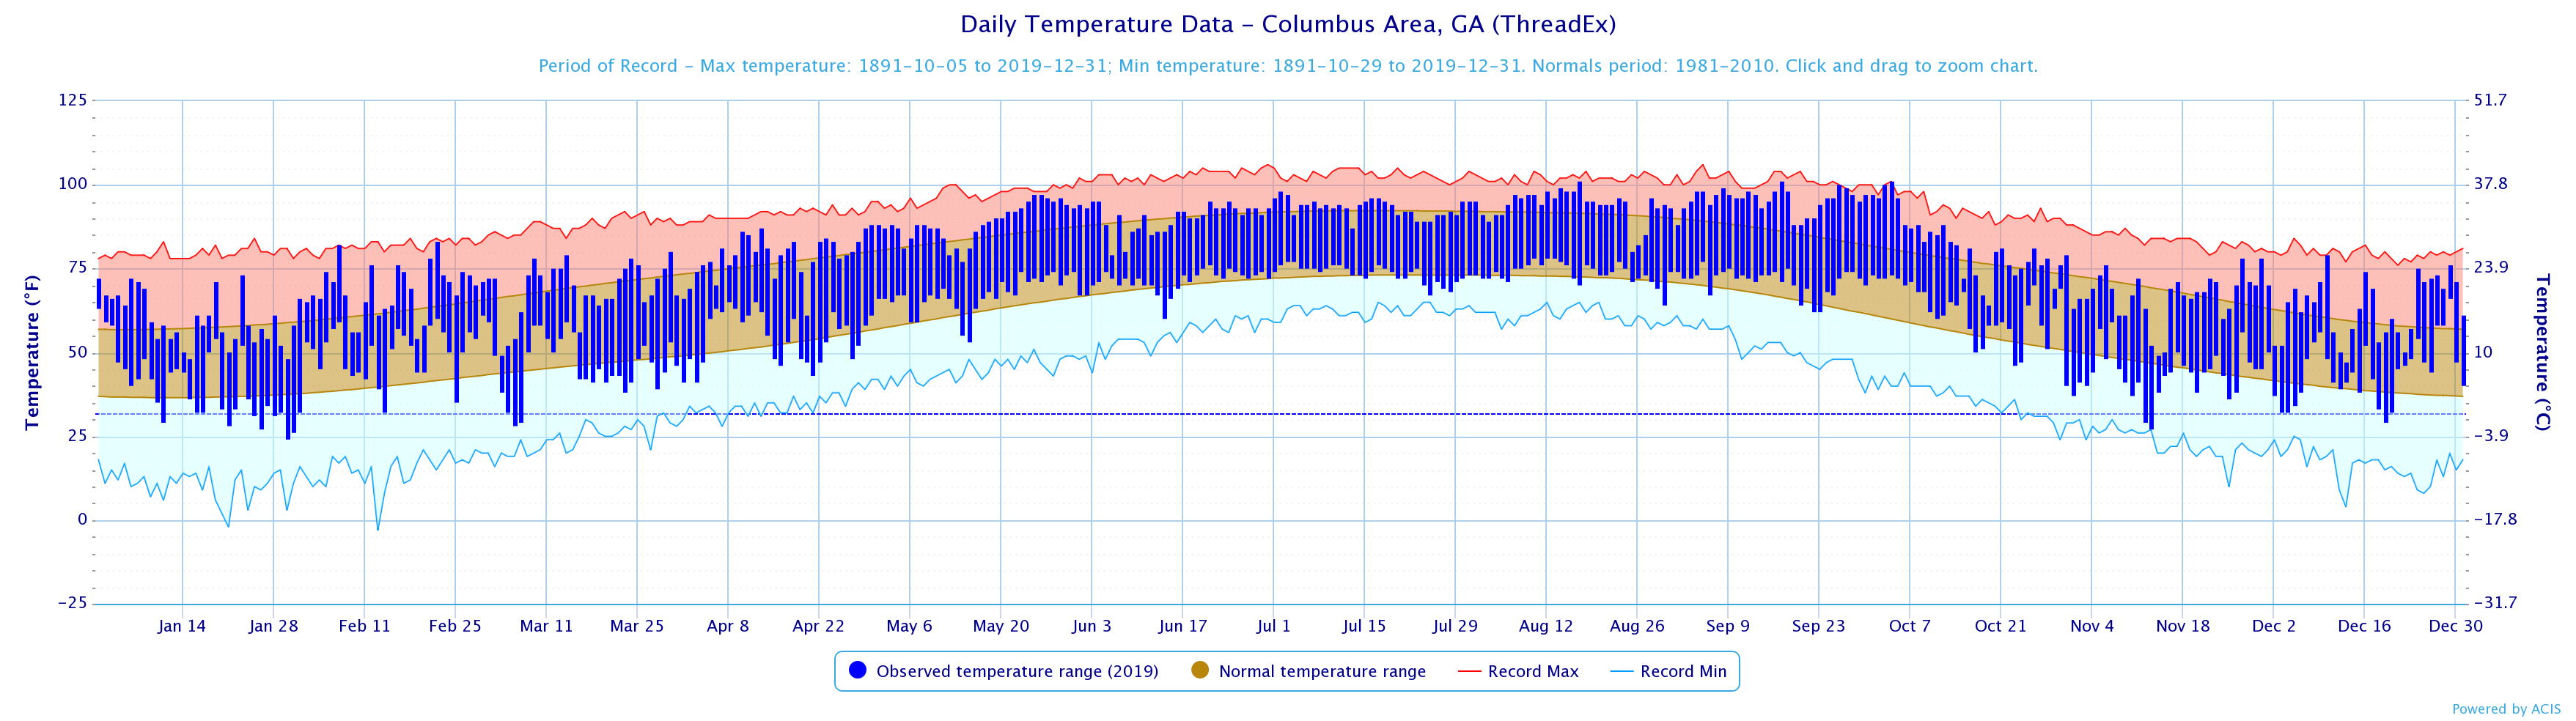
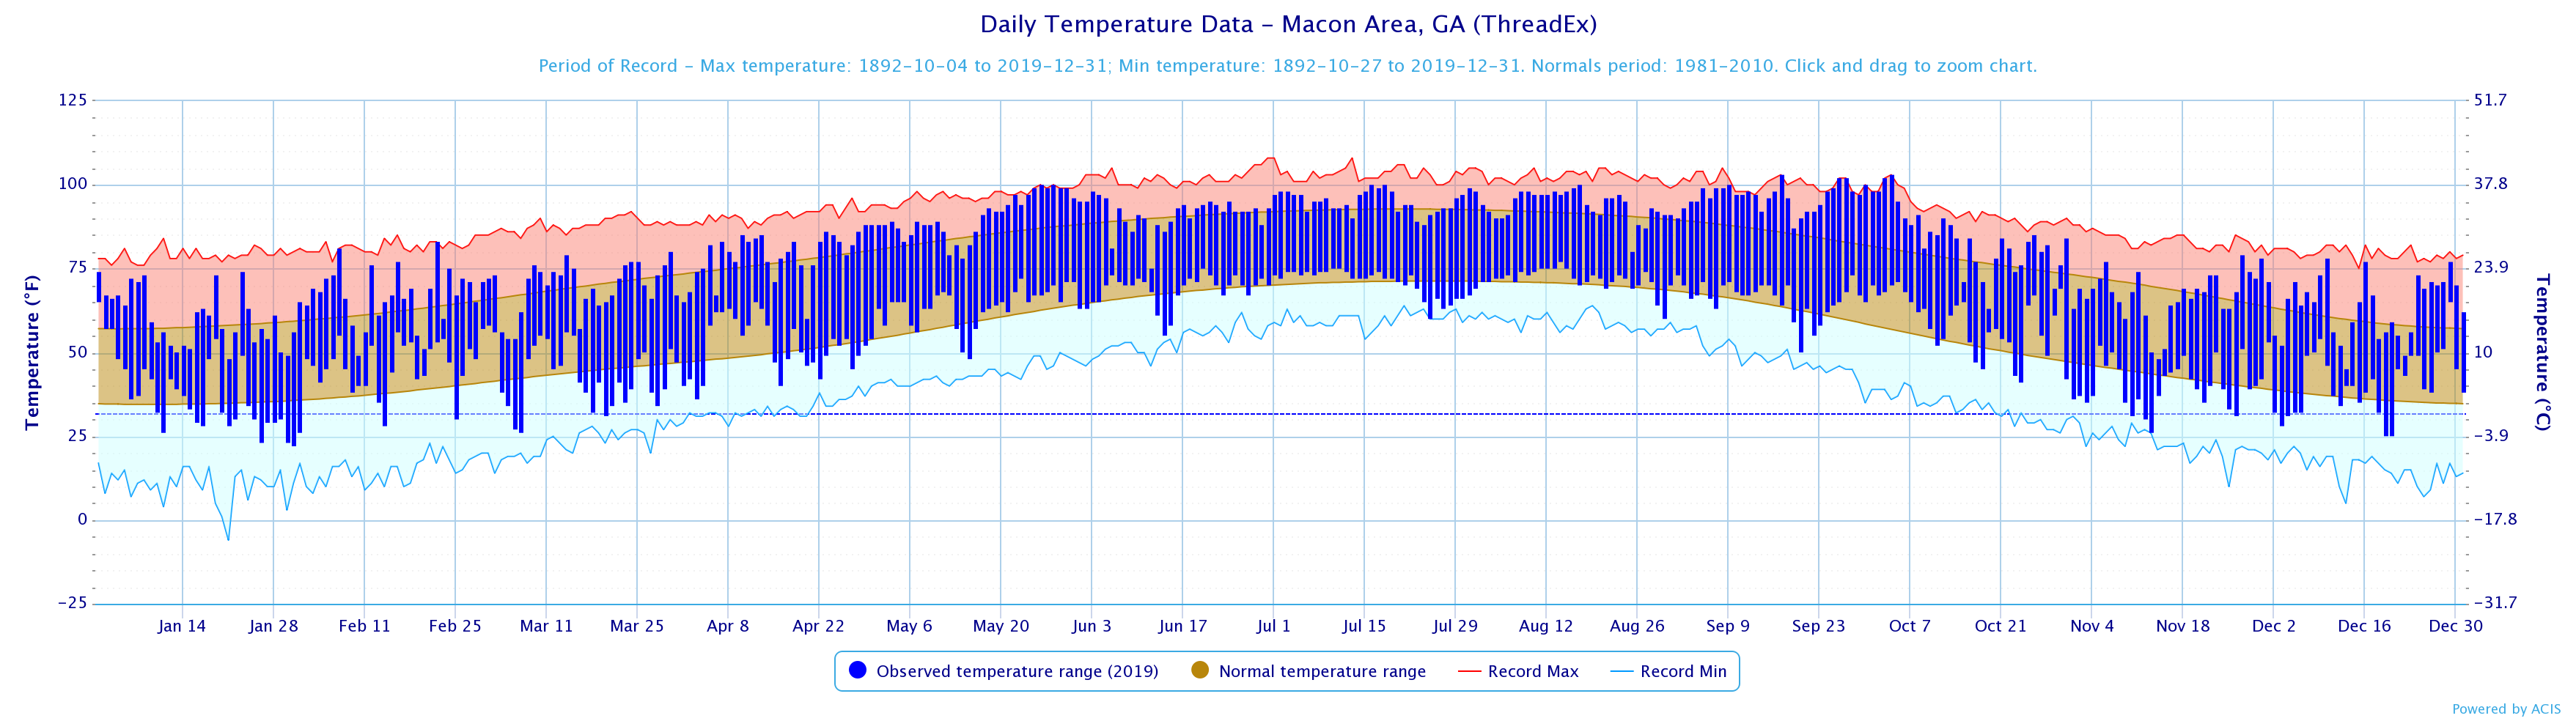
Overall, 2019 ended up being warm and dry across north and central Georgia. Average temperatures were at least two degrees above average at all of our recorded climate sites with all four of our primary sites recording top 10 rankings for the year. Ranked by average temperatures, both Atlanta (66.1°) and Macon (67.2°) recorded their warmest years on record. Athens (64.9°) and Columbus (68.5°) both recorded their third warmest years on record. This year was also one for the books in terms of temperature extremes. Across our 10 climate sites, 12 warmest monthly temperatures were set with highest temps ranging from 98° to 103°. As far as precipitation totals, Athens recorded 46.31 inches, Atlanta recorded 43.74 inches, and Macon recorded 44.47 inches, with those sites all recording below average precipitation. Columbus recorded above average rainfall, accumulating 48.96 inches by the end of the year. All in all, Atlanta received 88% of normal rainfall, Athens received 100% of normal rainfall, Columbus received 105% of normal rainfall, and Macon received 97% of normal rainfall. There were also several precipitation extremes reported as well with 3 new monthly totals being set at Dekalb Peachtree Airport in April (3.26 inches on April 19th), Fulton County Airport in June (2.74 inches on June 8th), and Peachtree City in April (4.37 inches on April 19th). Shockingly enough, snow wasn’t reported at any of our four primary climate sites which is fairly abnormal. Overall, 2019 will be a year to remember!
Data prepared by the Atlanta Forecast Office. Normal values provided are from the 1981-2010 period.


.png)
.png)
.png)
.png)
.png)
.png)
.png)
.png)
.png)
.png)