North and Central Georgia
January 2019 Climate Summary
| Previous Month | Next Month |
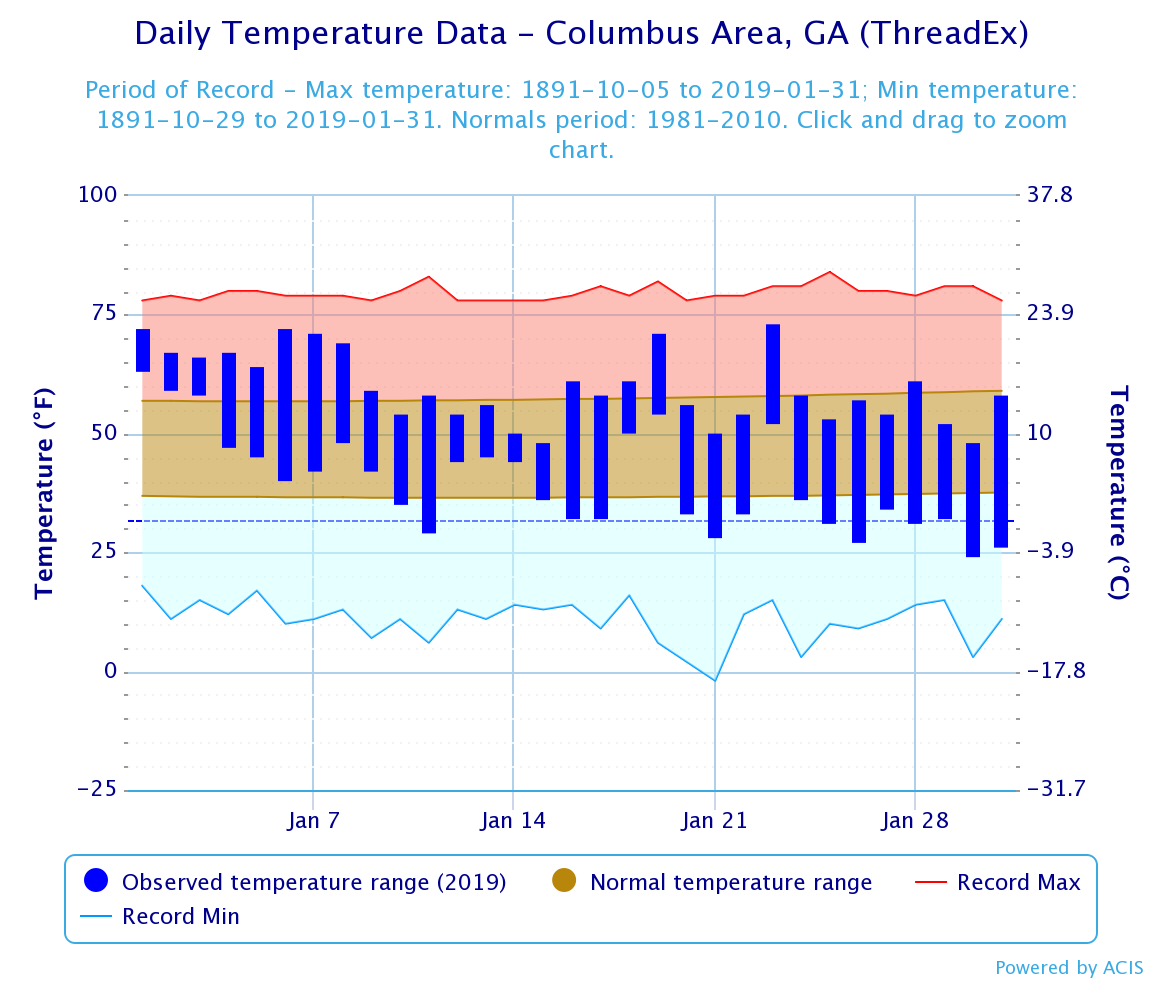
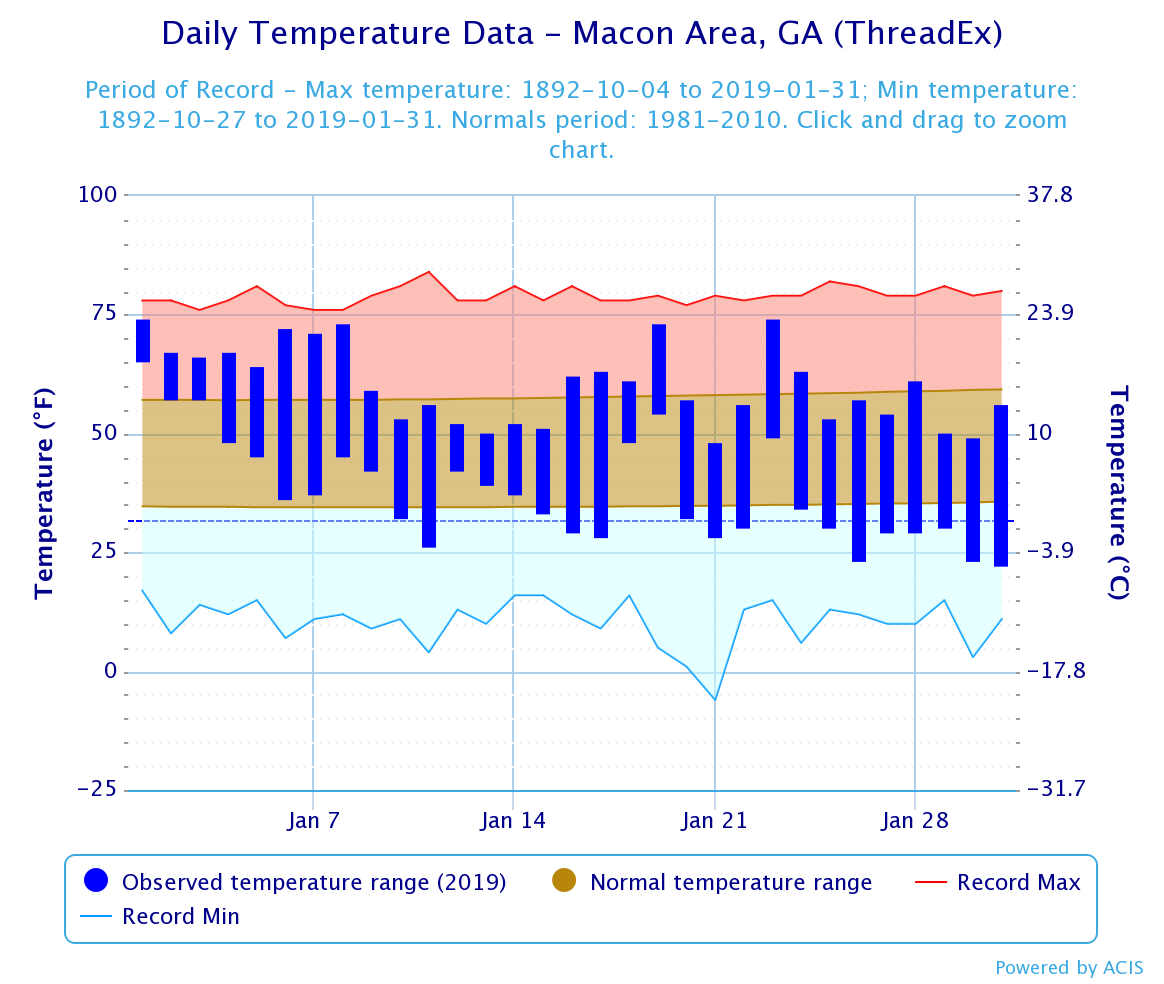
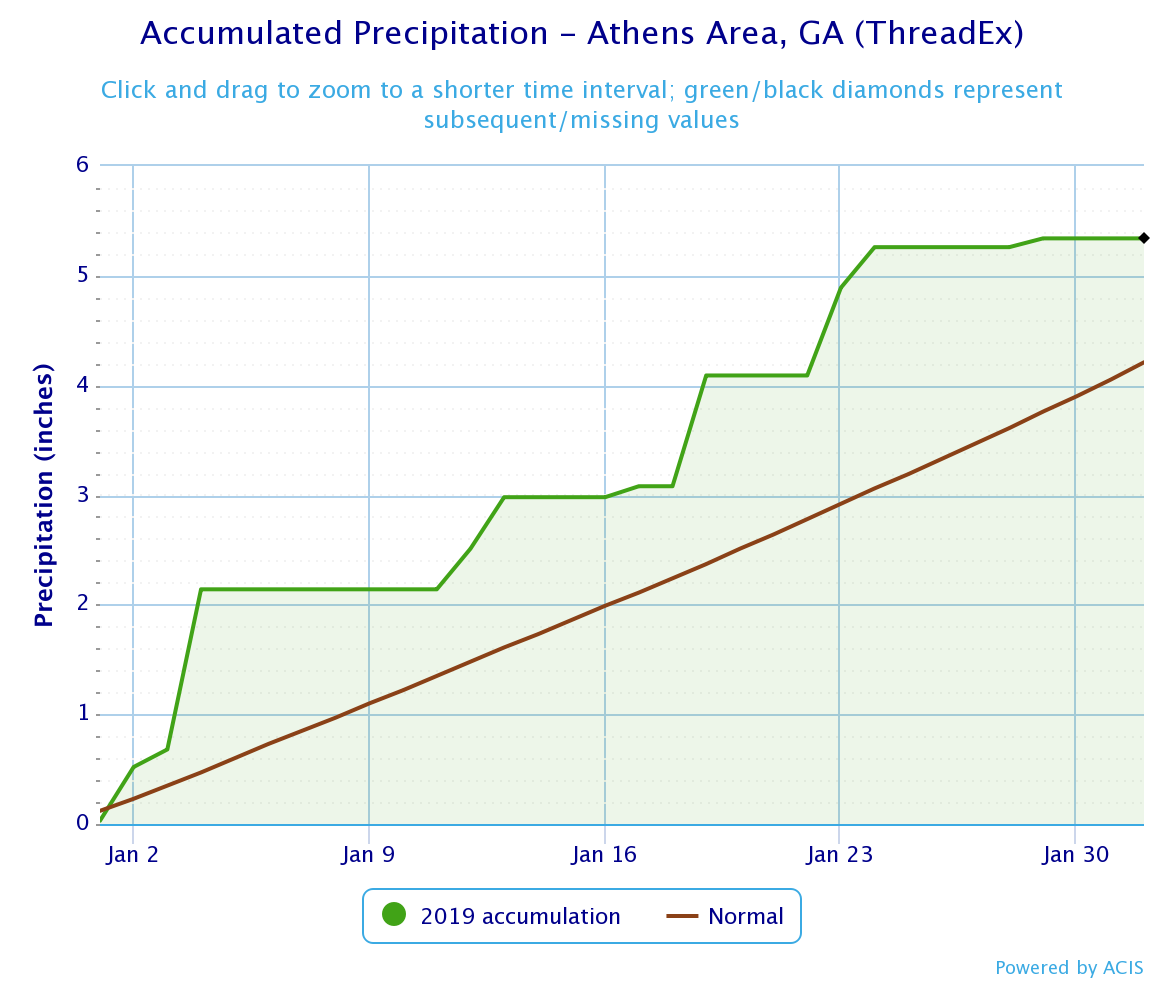
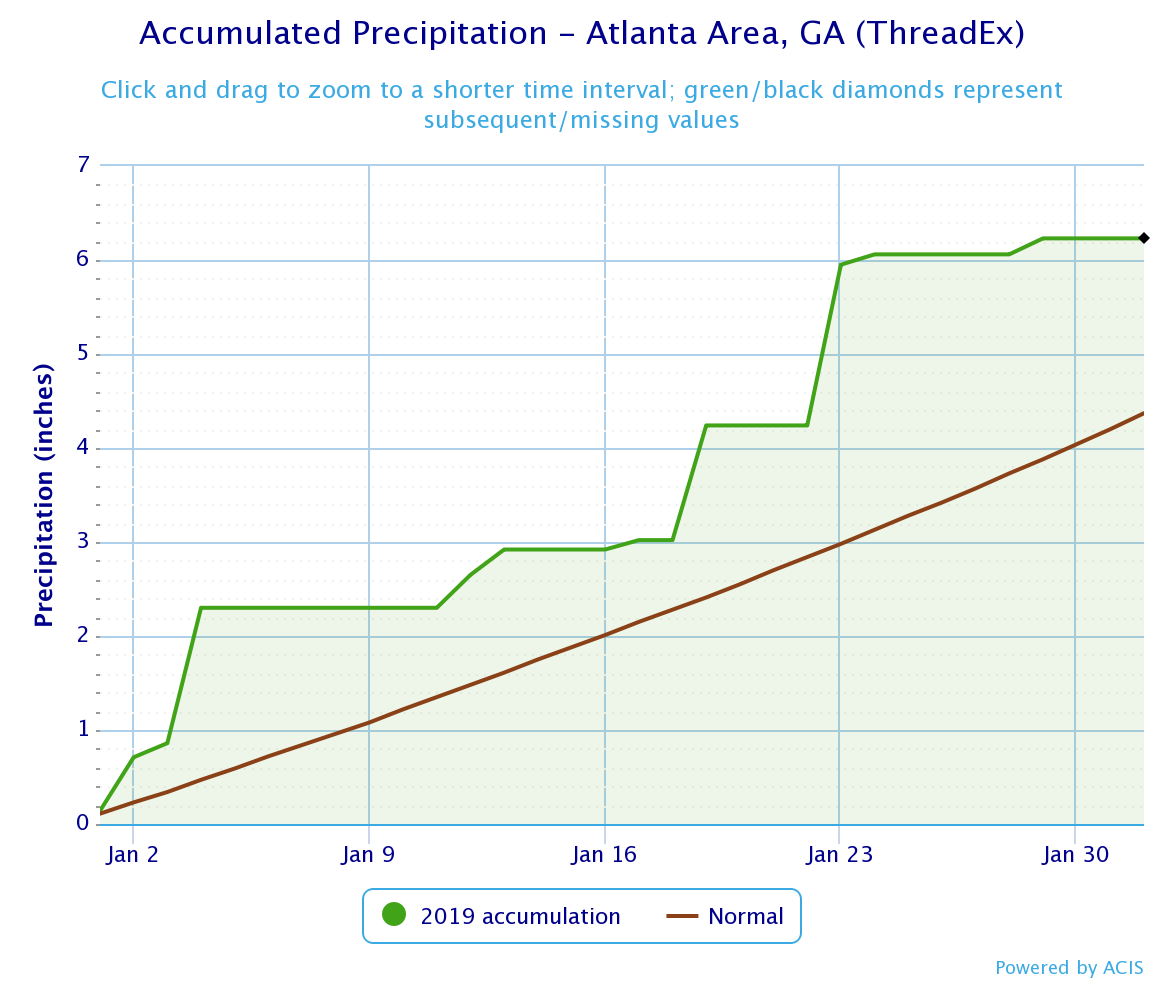
For January, the majority of locations were about 1 to 3 degrees warmer than normal and 0 to 2 inches wetter than normal.
Monthly Top 10 Rankings:
None
*Complete rankings in tables below
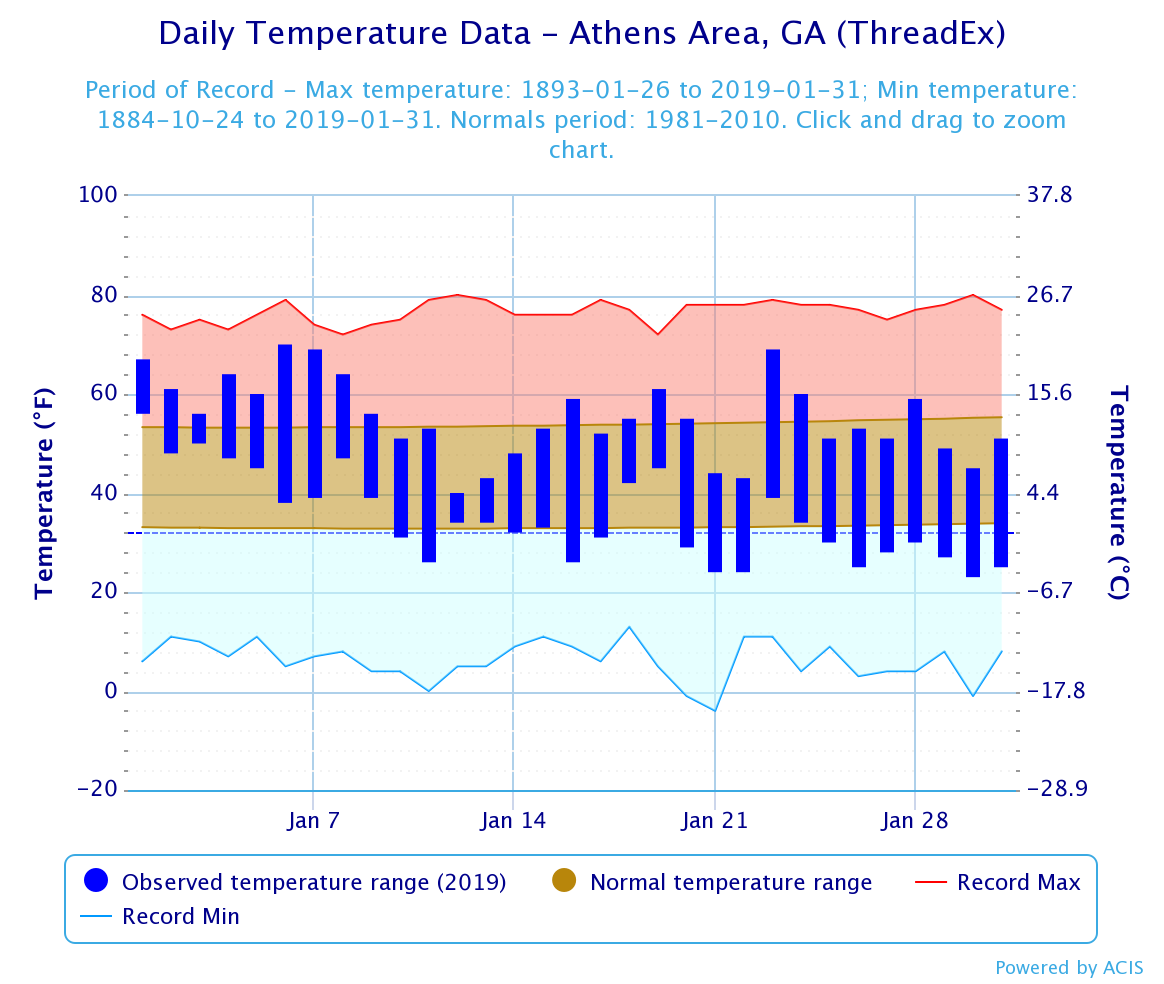
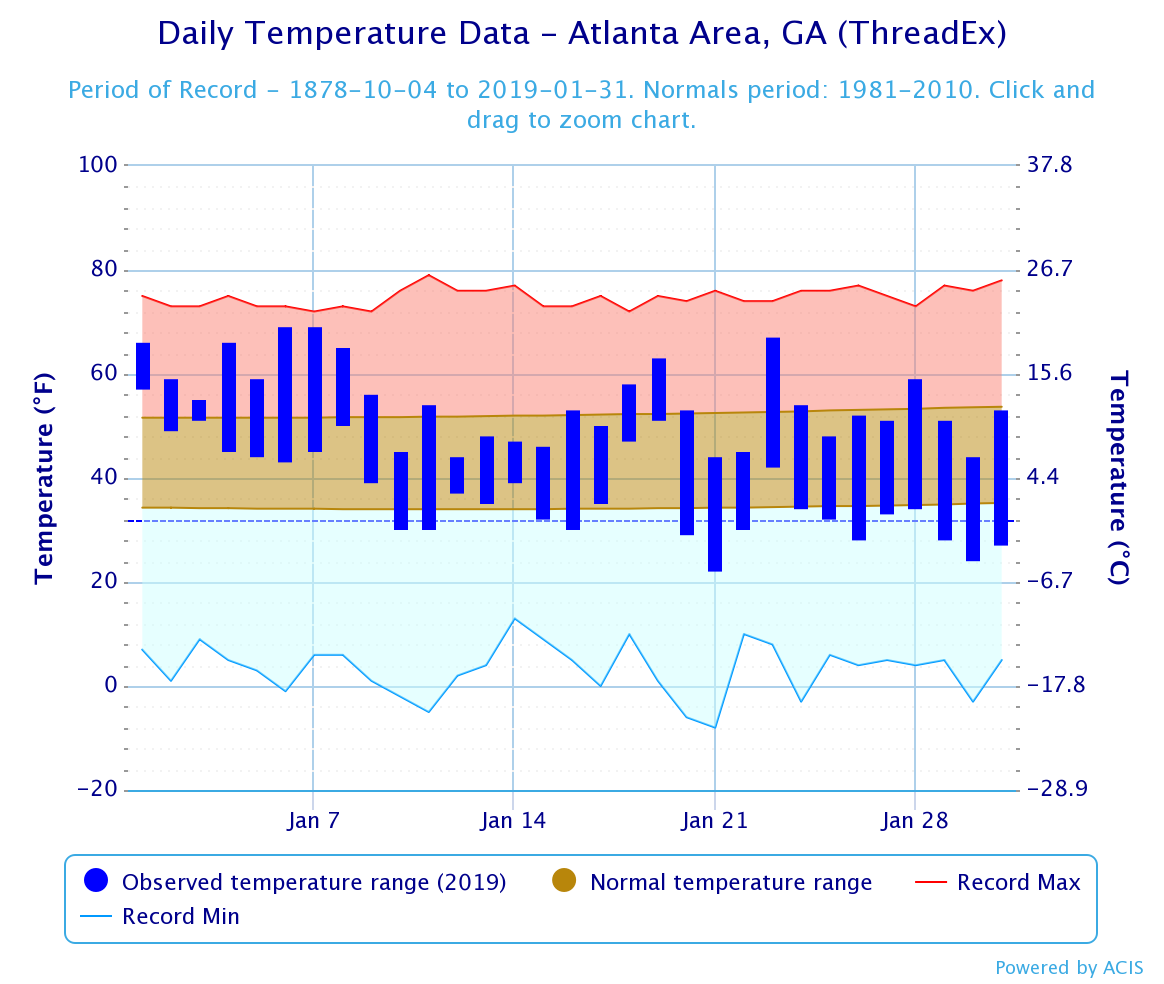
Temp. Extremes (°F) for January
|
Site |
Warmest Temp. |
Coldest Temp. |
|
Athens |
70 (1/6) |
23 (1/30) |
|
Atlanta |
69 (1/6,1/7) |
22 (1/21) |
|
Columbus |
73 (1/23) |
24 (1/30) |
|
Macon |
74 (1/1,1/23) |
22 (1/31) |
|
Cartersville |
68 (1/7) |
18 (1/30) |
|
DeKalb Peachtree Arpt |
69 (1/6) |
20 (1/21,1/30) |
|
Fulton Co. Arpt |
69 (1/6,1/7) |
21 (1/21) |
|
Gainesville |
68 (1/6)* |
21 (1/21) |
|
Peachtree City |
72 (1/6) |
21 (1/30,1/31) |
|
Rome |
72 (1/7)* |
18 (1/30) |
* Set record for day
January Avg. Temperature (°F) and Rankings
* Click on site name below to view a graph with additional data
|
Site |
Avg. Temp. and Current Ranking |
Normal |
Dep. from Normal |
Record |
|
45.0 (44th Warmest) |
43.5 |
+1.5 |
54.4 (1950) |
|
|
45.9 (38th Warmest) |
43.3 |
+2.6 |
55.4 (1950) |
|
|
49.7 (40th Warmest) |
47.2 |
+2.5 |
60.4 (1950) |
|
|
48.8 (43rd Warmest) |
46.3 |
+2.5 |
60.5 (1950) |
|
|
Cartersville |
42.5 |
41.1 |
+1.4 |
|
|
DeKalb Peachtree Arpt |
43.4 |
42.2 |
+1.2 |
|
|
Fulton Co. Arpt |
44.8 |
43.1 |
+1.7 |
|
|
Gainesville |
42.9 |
41.7 |
+1.2 |
|
|
Peachtree City |
46.1 |
42.8 |
+3.3 |
|
|
Rome |
43.5 |
41.1 |
+2.4 |
|
Precip. Extremes (in) for January
|
Site |
Highest Daily Amount |
|
Athens |
1.46 (1/4) |
|
Atlanta |
1.71 (1/28) |
|
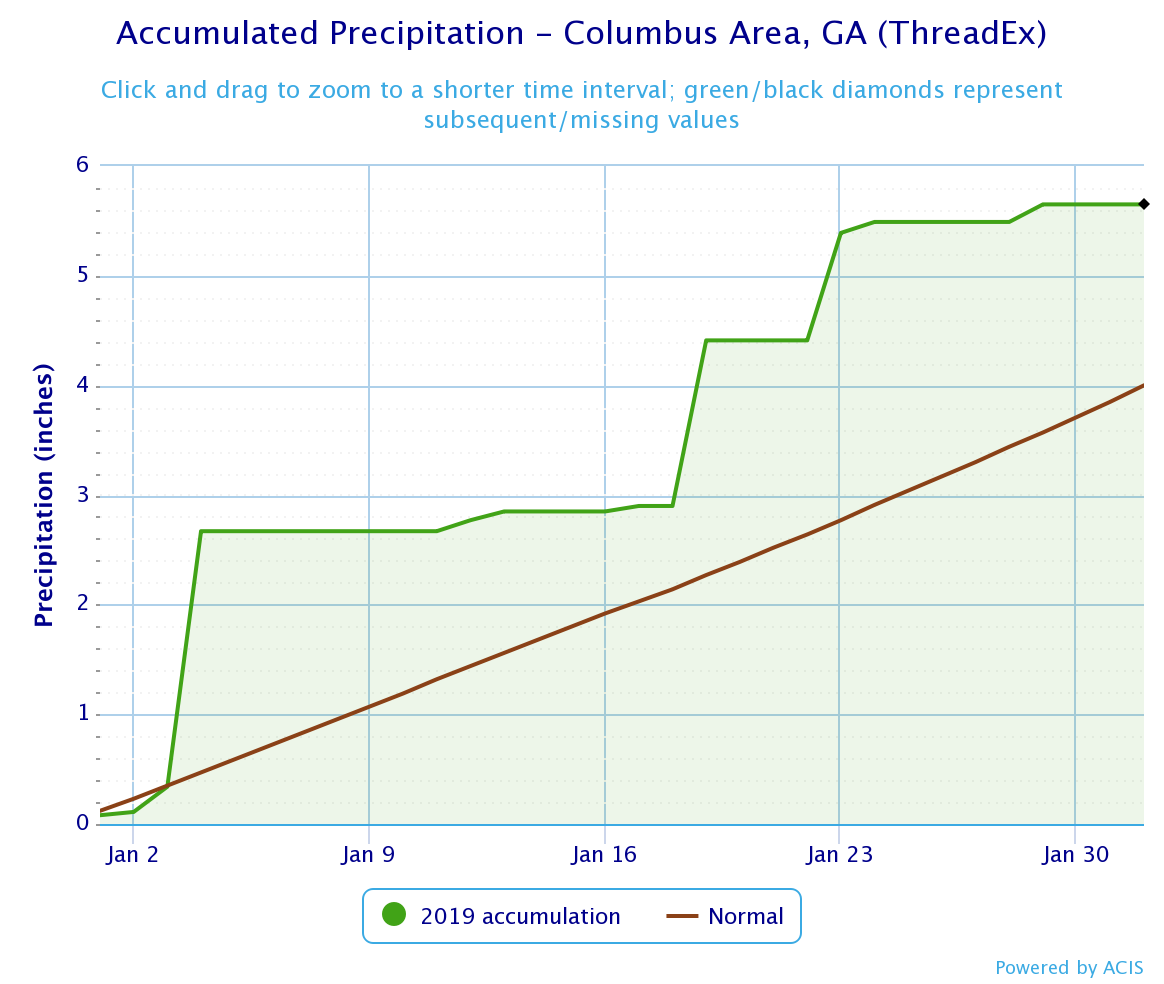
Columbus |
2.33 (1/4)* |
|
Macon |
1.92 (1/4) |
|
Cartersville |
1.83 (1/23)* |
|
DeKalb Peachtree Arpt |
1.55 (1/23) |
|
Fulton Co. Arpt |
1.66 (1/23)* |
|
Gainesville |
1.11 (1/4) |
|
Peachtree City |
1.74 (1/23) |
|
Rome |
2.31 (1/19)* |
* Set record for day
January Precipitation Totals (in) and Rankings
* Click on site name below to view a graph with additional data
|
Site |
Total Precip. and Current Ranking |
Normal |
Dep. from Normal |
Record |
|
5.34 (42nd Wettest) |
4.05 |
+1.29 |
12.83 (1936) |
|
|
6.23 (25th Wettest) |
4.20 |
+2.03 |
15.82 (1883) |
|
|
5.65 (29th Wettest) |
3.85 |
+1.80 |
13.76 (1925) |
|
|
6.15 (18th Wettest) |
4.24 |
+1.91 |
13.22 (1925) |
|
|
Cartersville |
4.71 |
4.60 |
+0.11 |
|
|
DeKalb Peachtree Arpt |
5.37 |
4.80 |
+0.57 |
|
|
Fulton Co. Arpt |
5.32 |
4.27 |
+1.05 |
|
|
Gainesville |
5.29 |
5.03 |
+0.26 |
|
|
Peachtree City |
6.40 |
4.20 |
+2.20 |
|
|
Rome |
6.82 |
4.82 |
+2.00 |
|
Records Set this January
Columbus:
February Outlook
Based on the Climate Prediction Center’s February outlook, North Georgia has a 33 to 40% chance of above normal temperatures while Central Georgia has a 40 to 50% chance of above normal temperatures. For precipitation, far North Georgia has a 50 to 60% chance of above normal precipitation and Central Georgia has a 40% to 50% chance for above normal precipitation.
Data prepared by the Atlanta Forecast Office.

