North and Central Georgia
June 2019 Climate Summary
| Previous Month | Next Month |
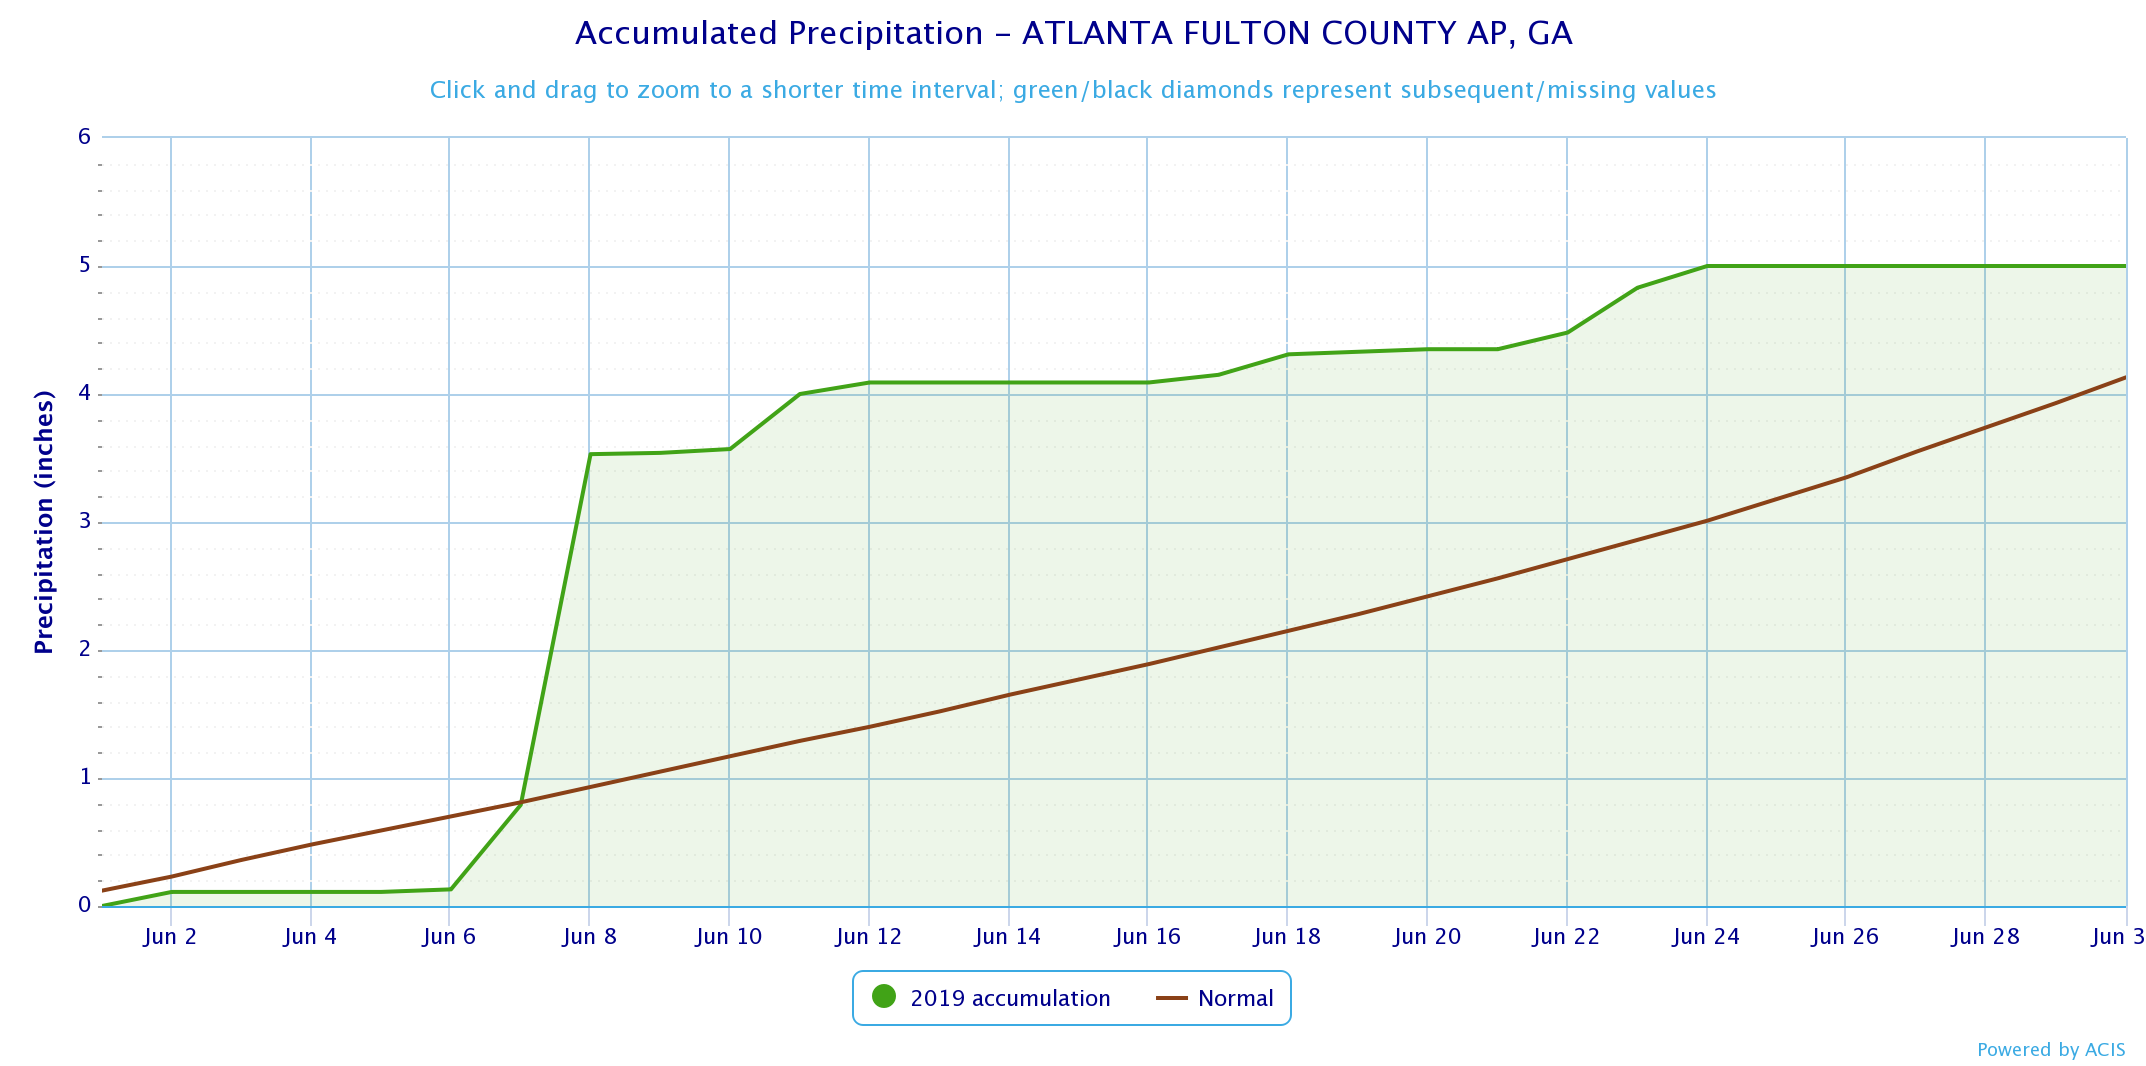
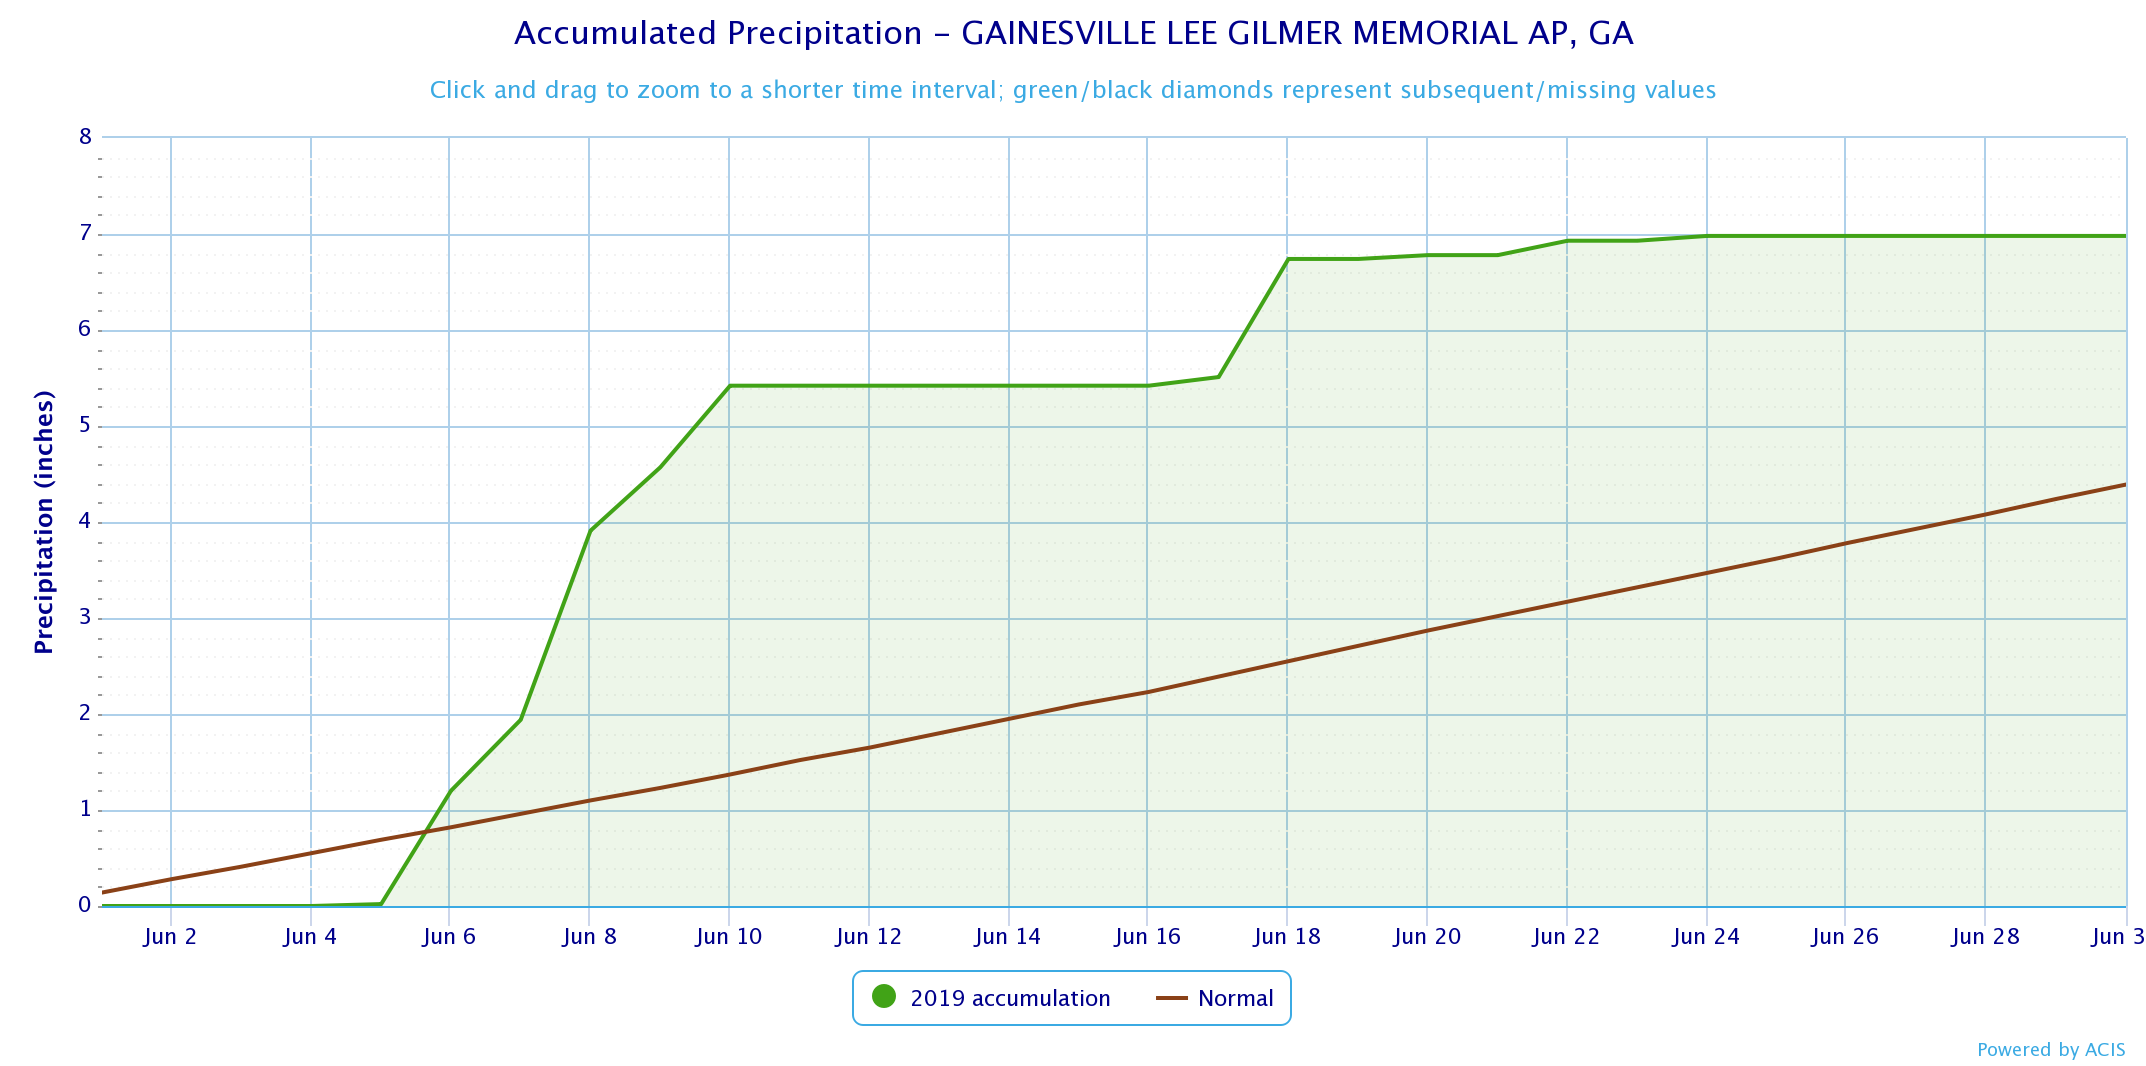
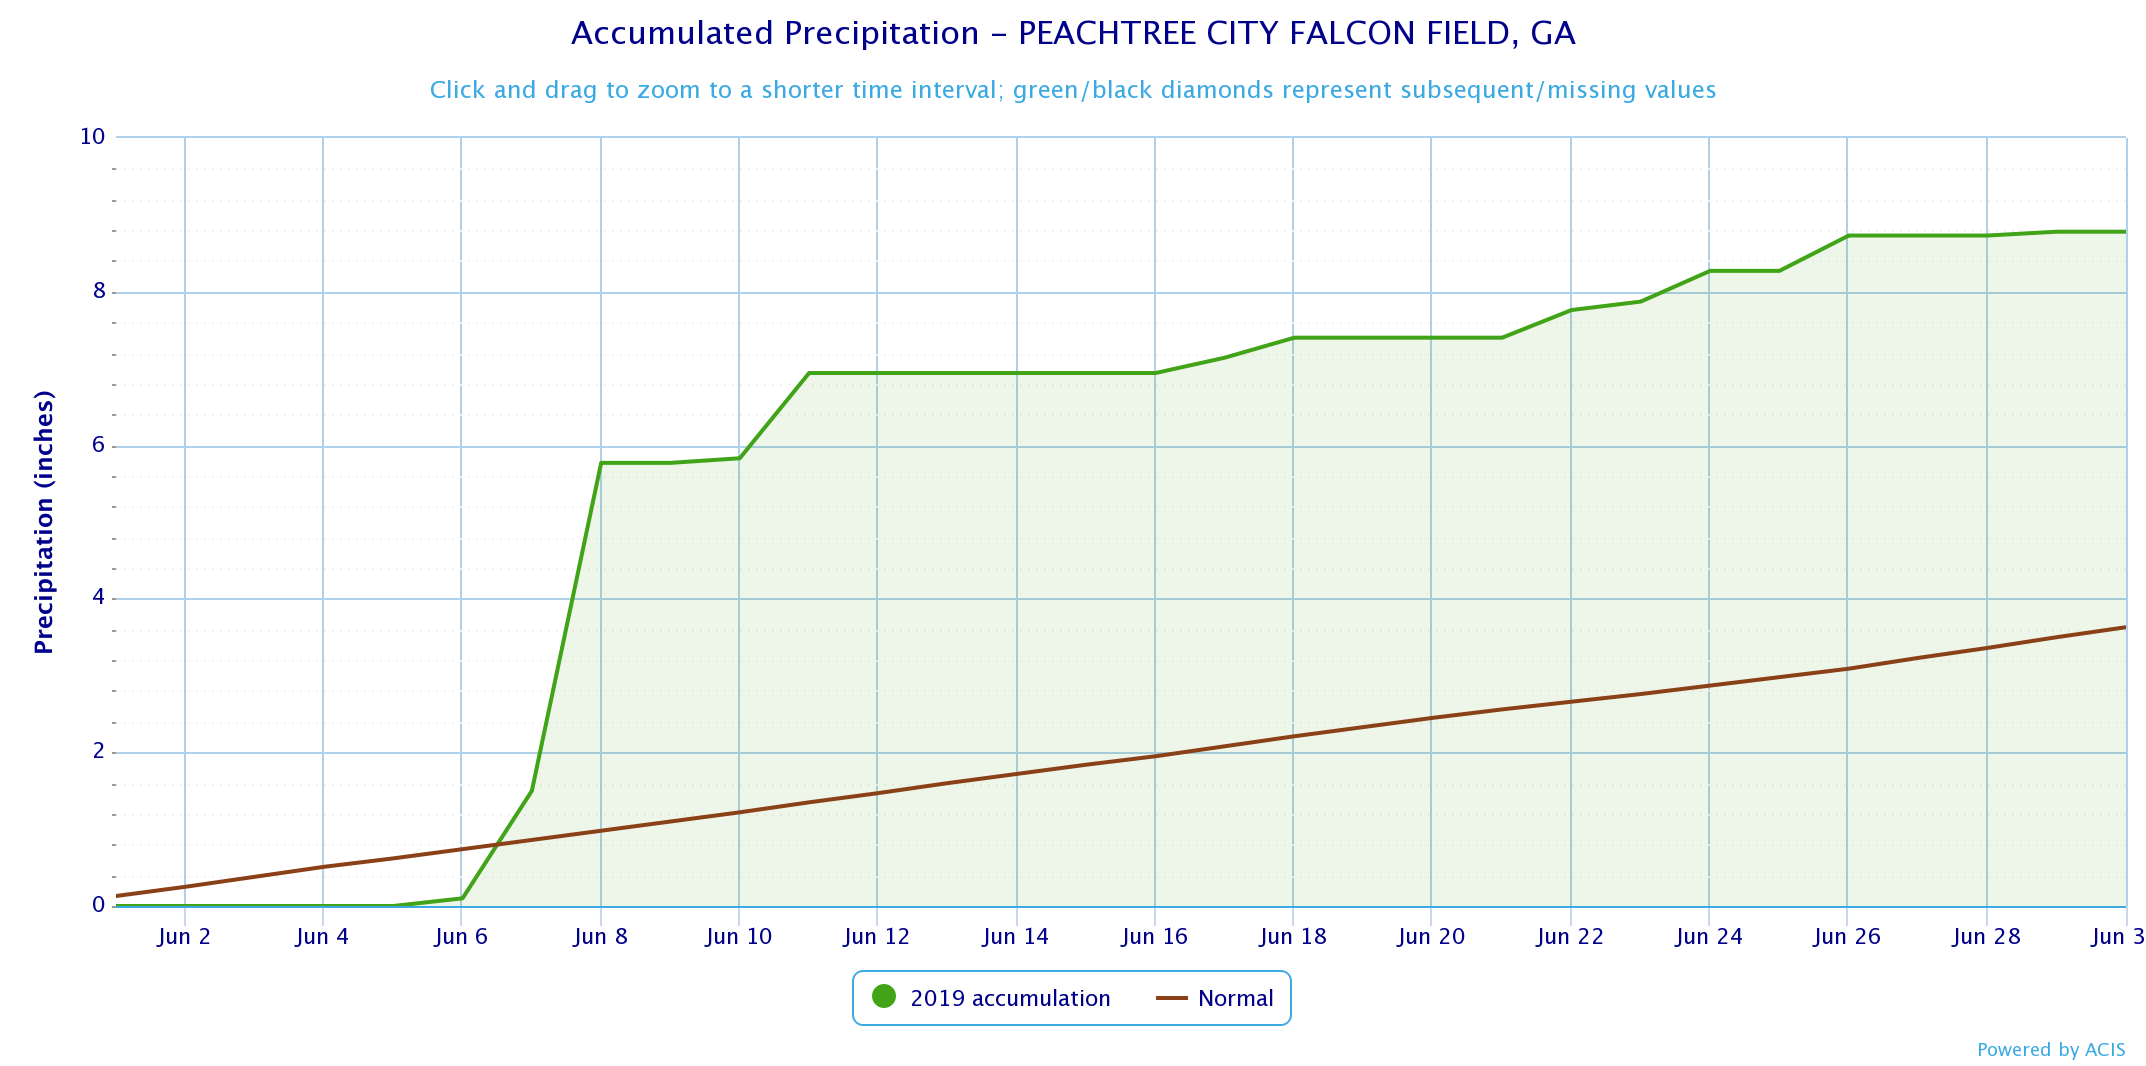
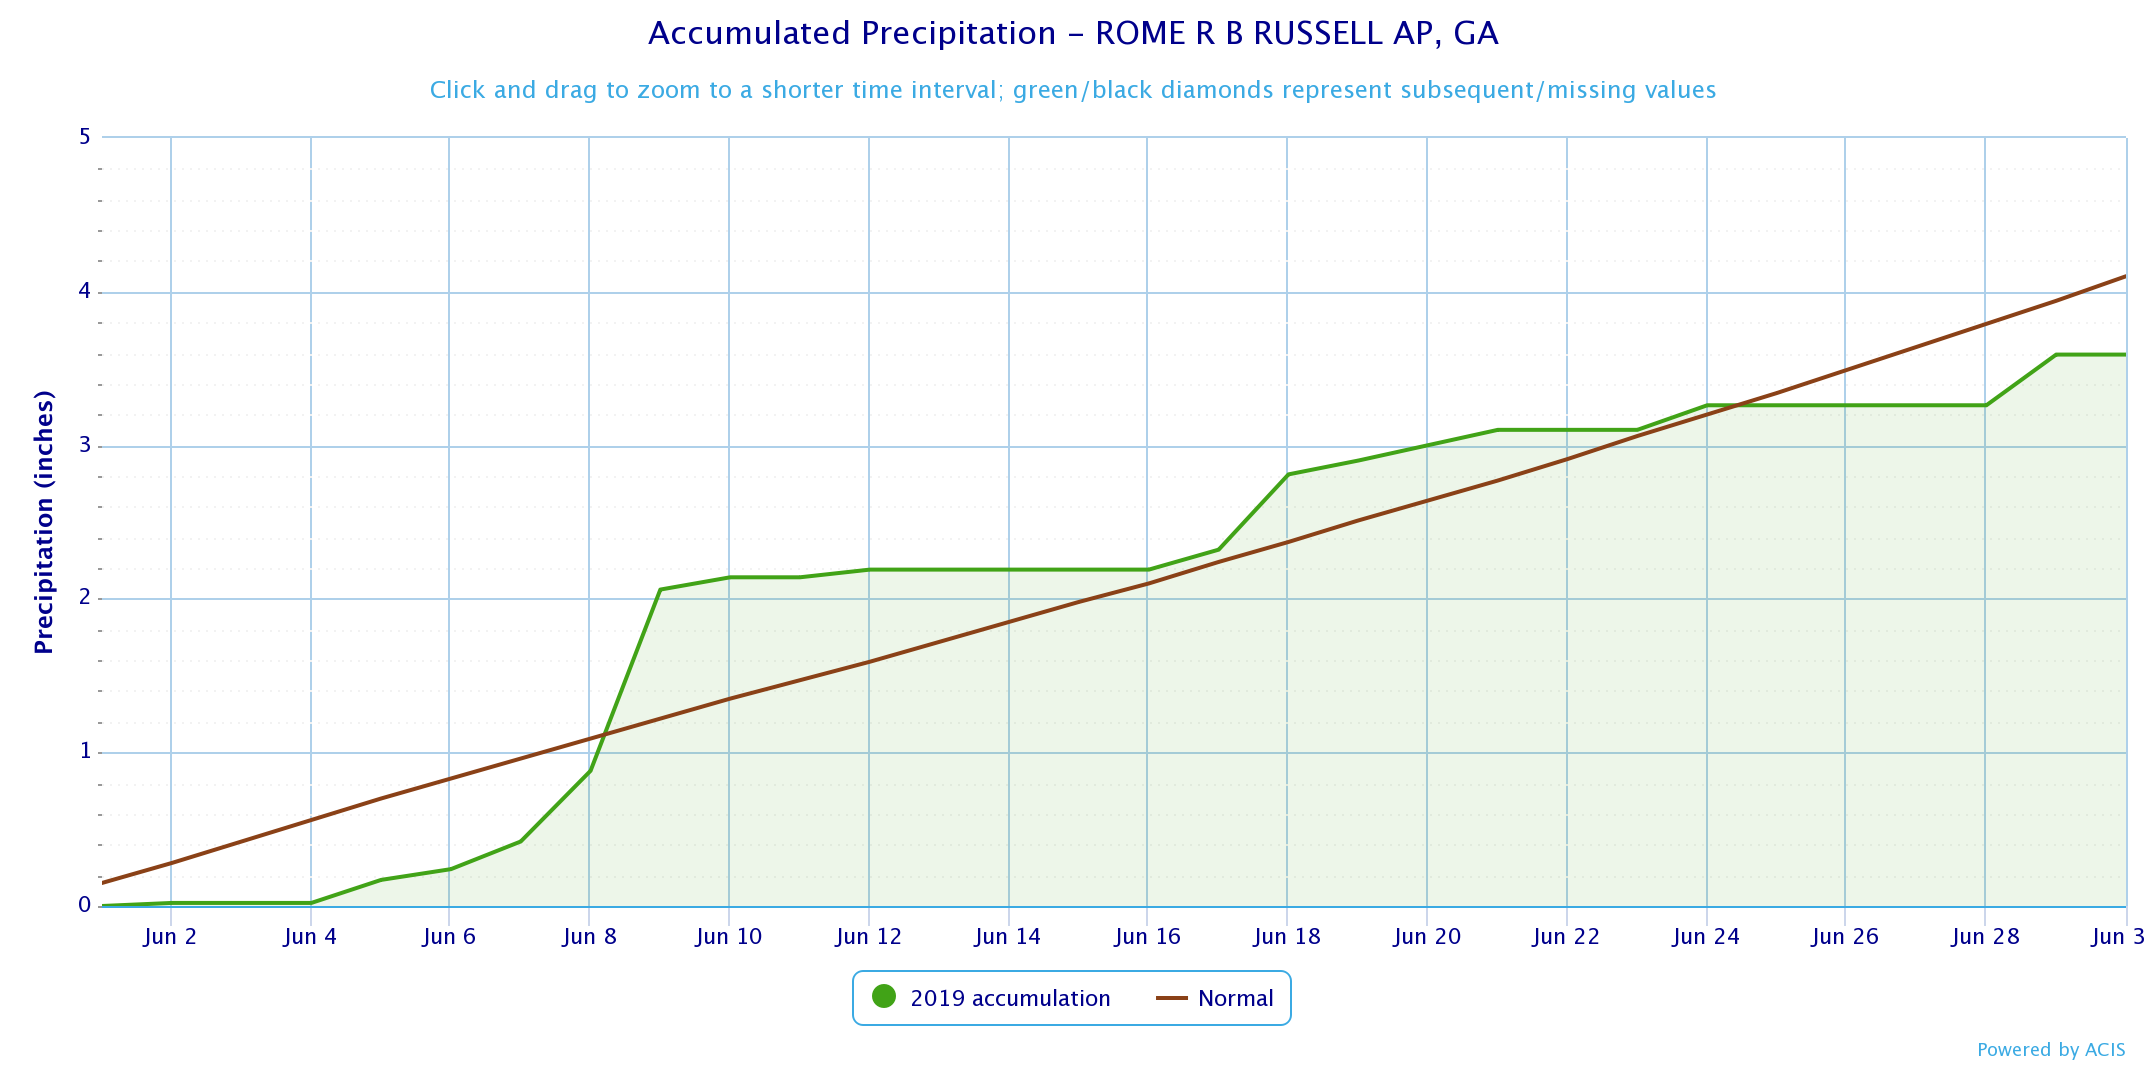
For June, the majority of locations experienced temperatures near average but were about 0 to 3 inches wetter than normal.
|
June Monthly Top 10 Rankings |
|---|
|
None |
*Complete rankings in tables below
Temp. Extremes (ºF) for June
|
Site |
Warmest Temp. |
Coldest Temp. |
|
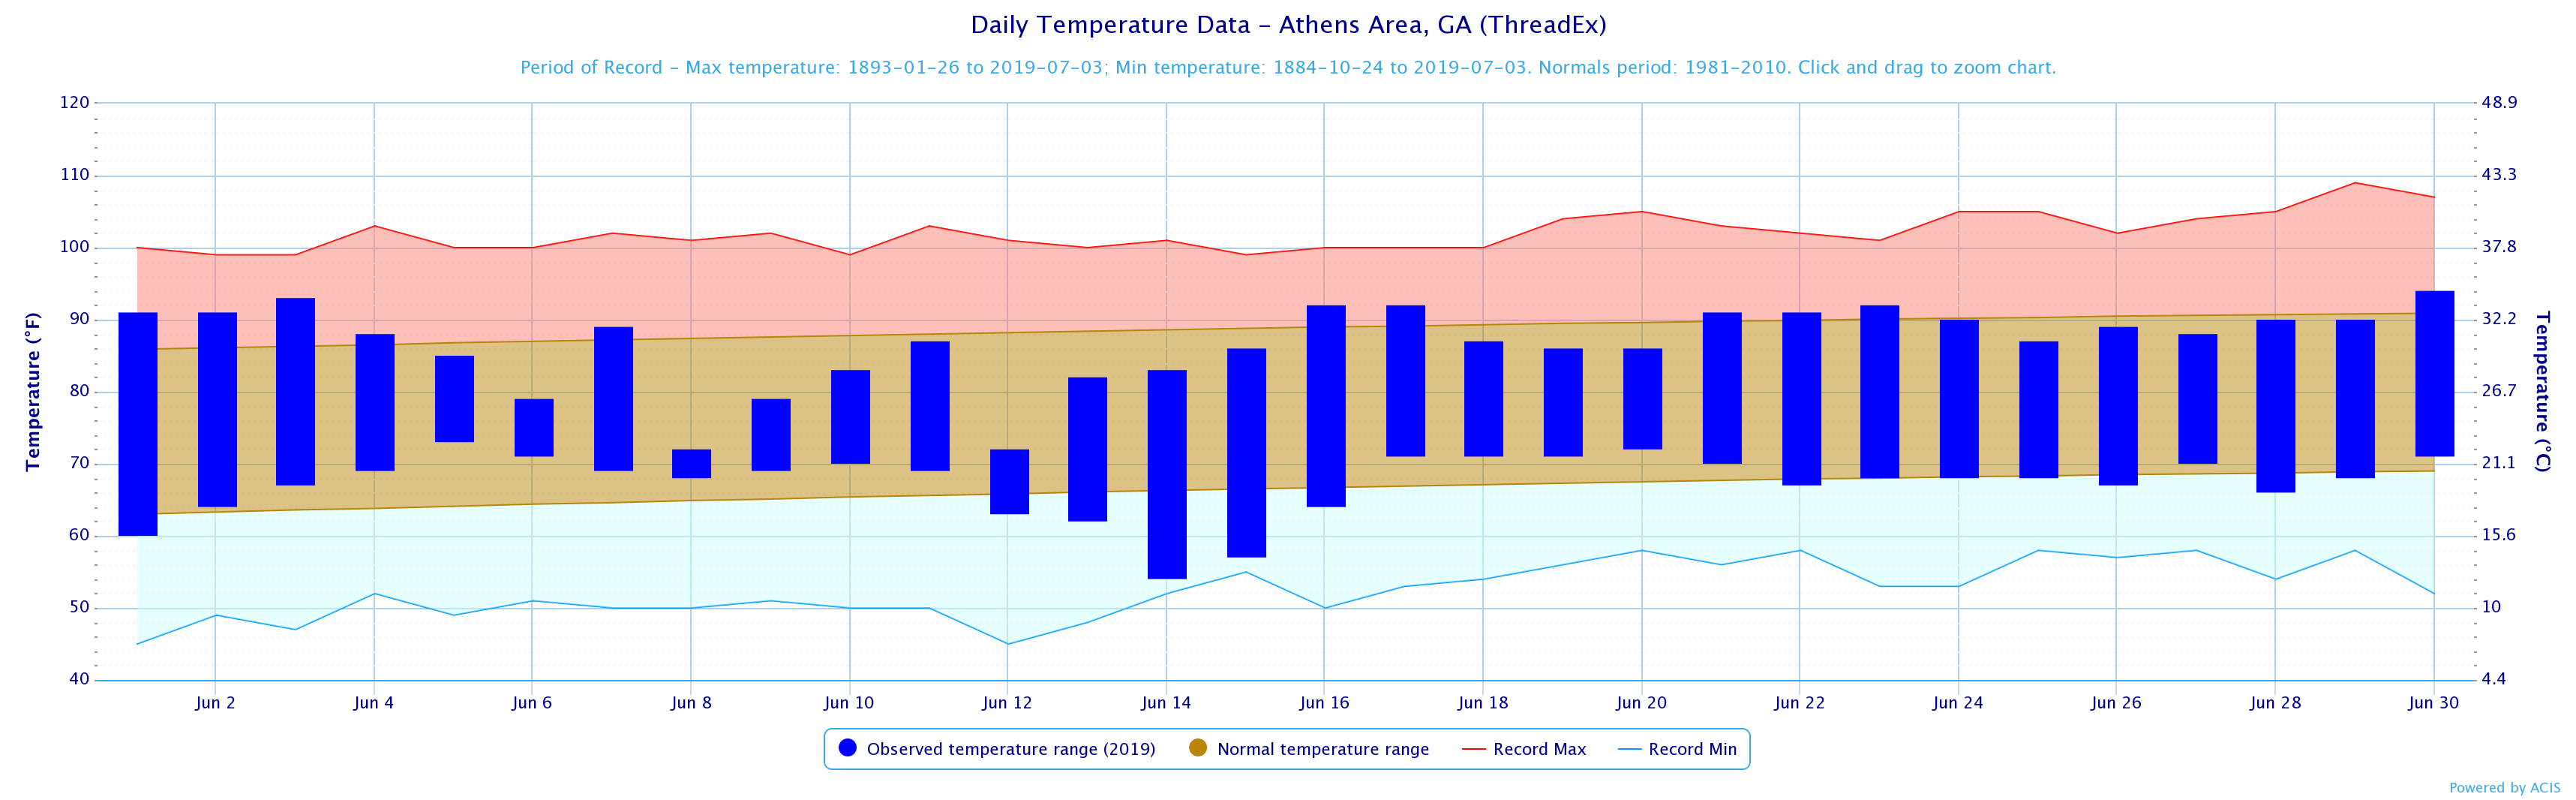
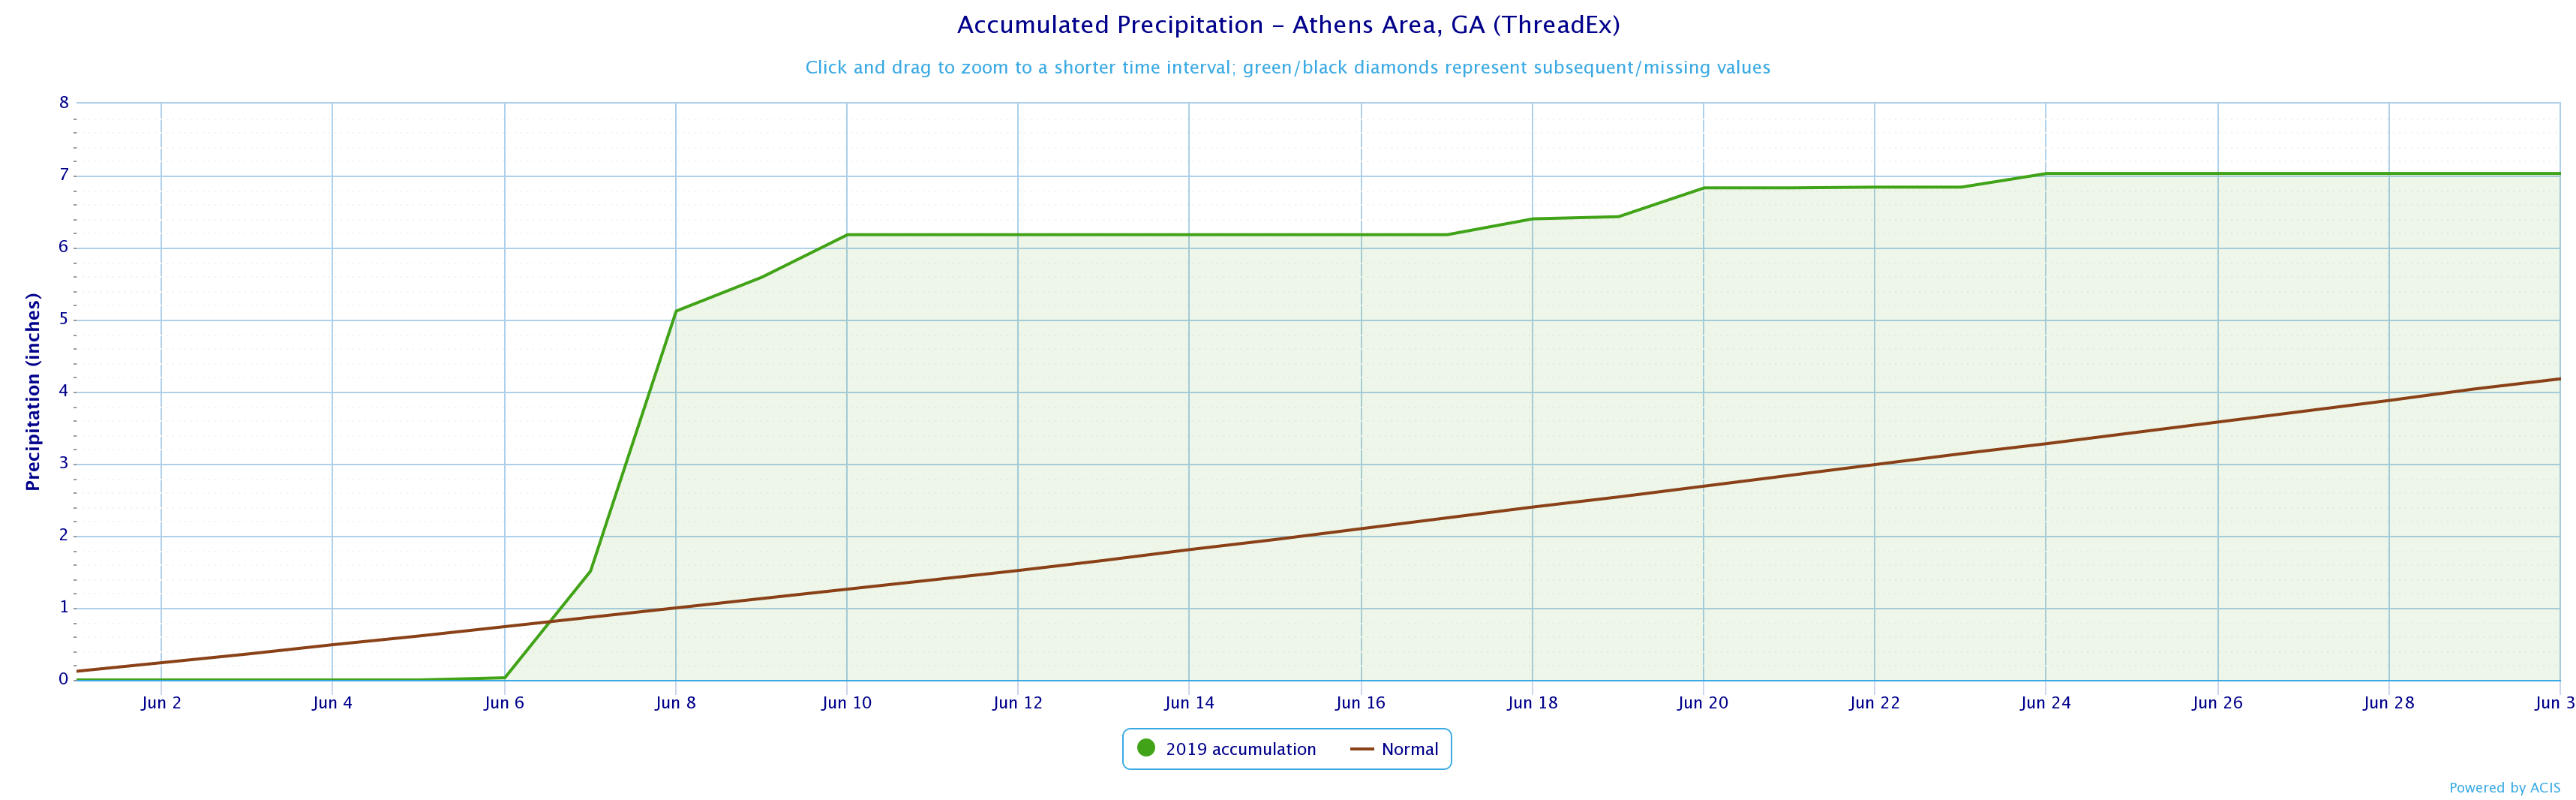
Athens |
94 (6/30) |
54 (6/14) |
|
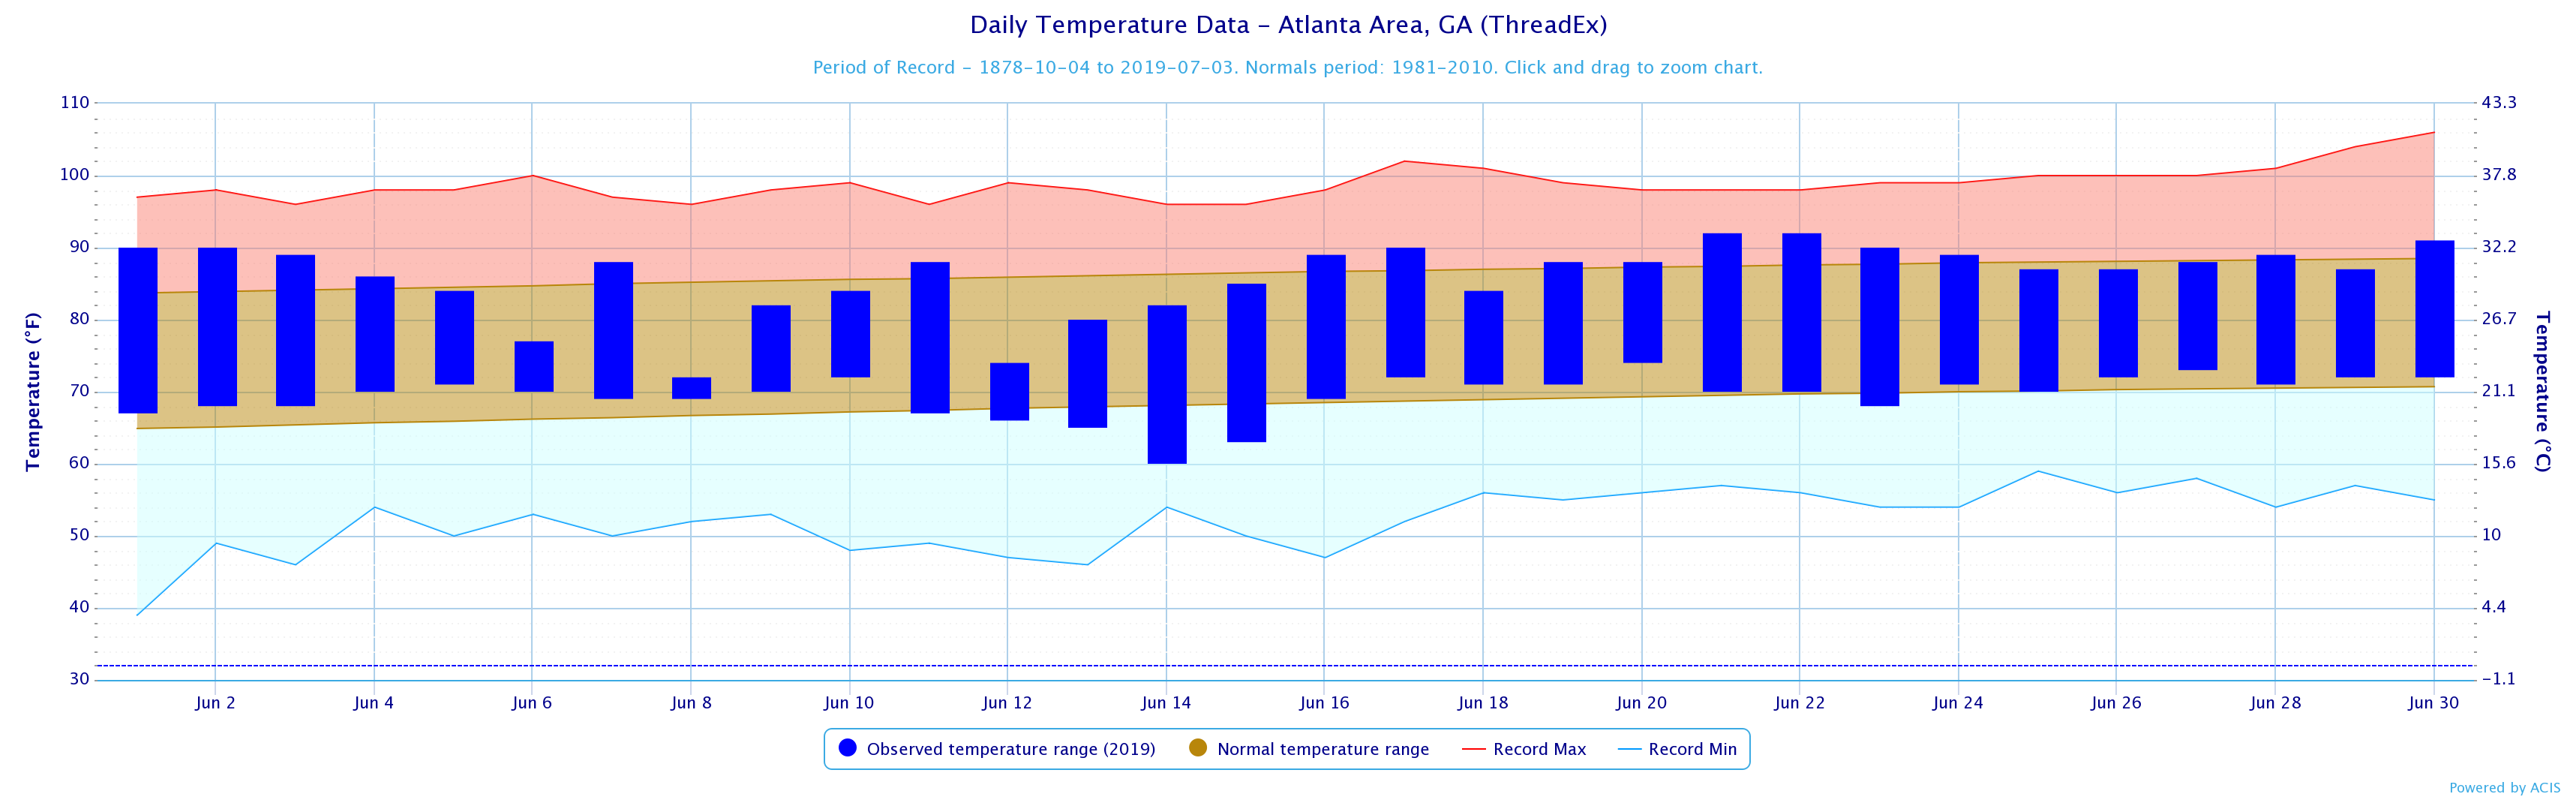
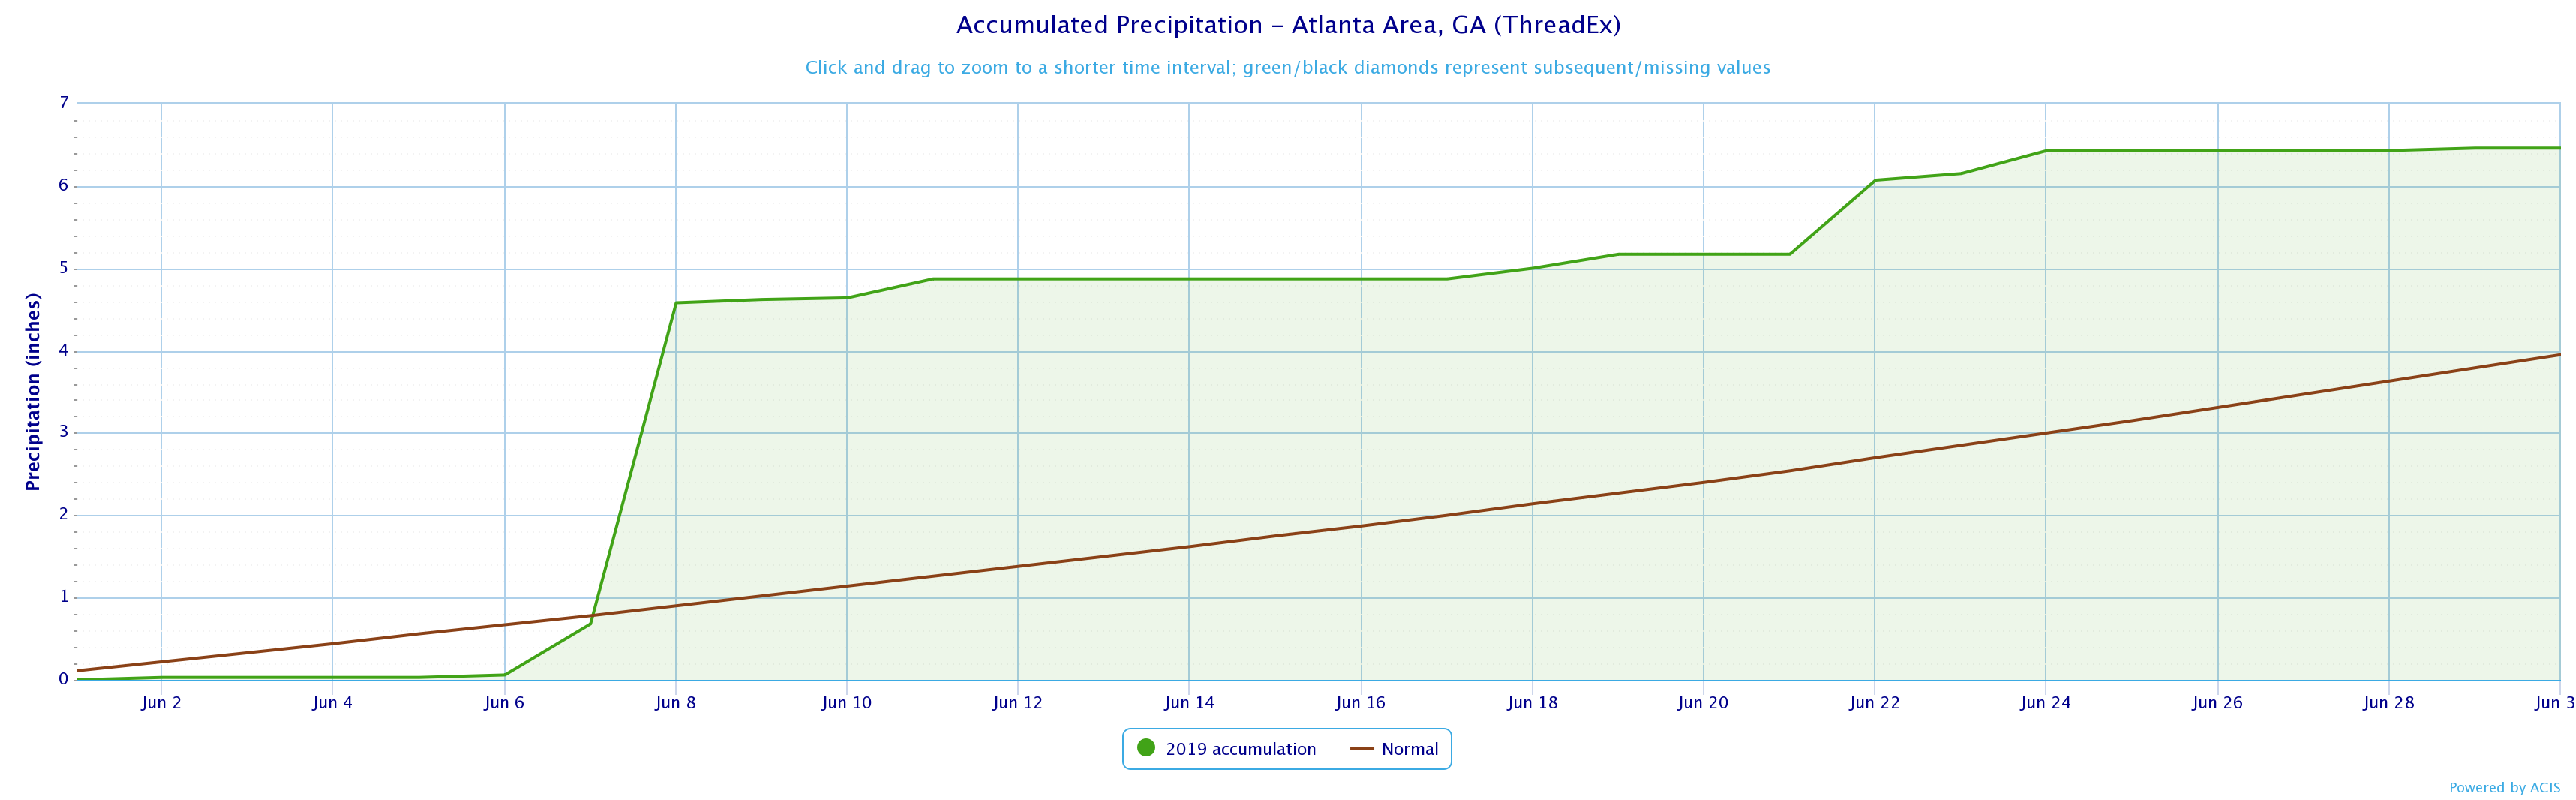
Atlanta |
92 (6/21,6/22) |
60 (6/14) |
|
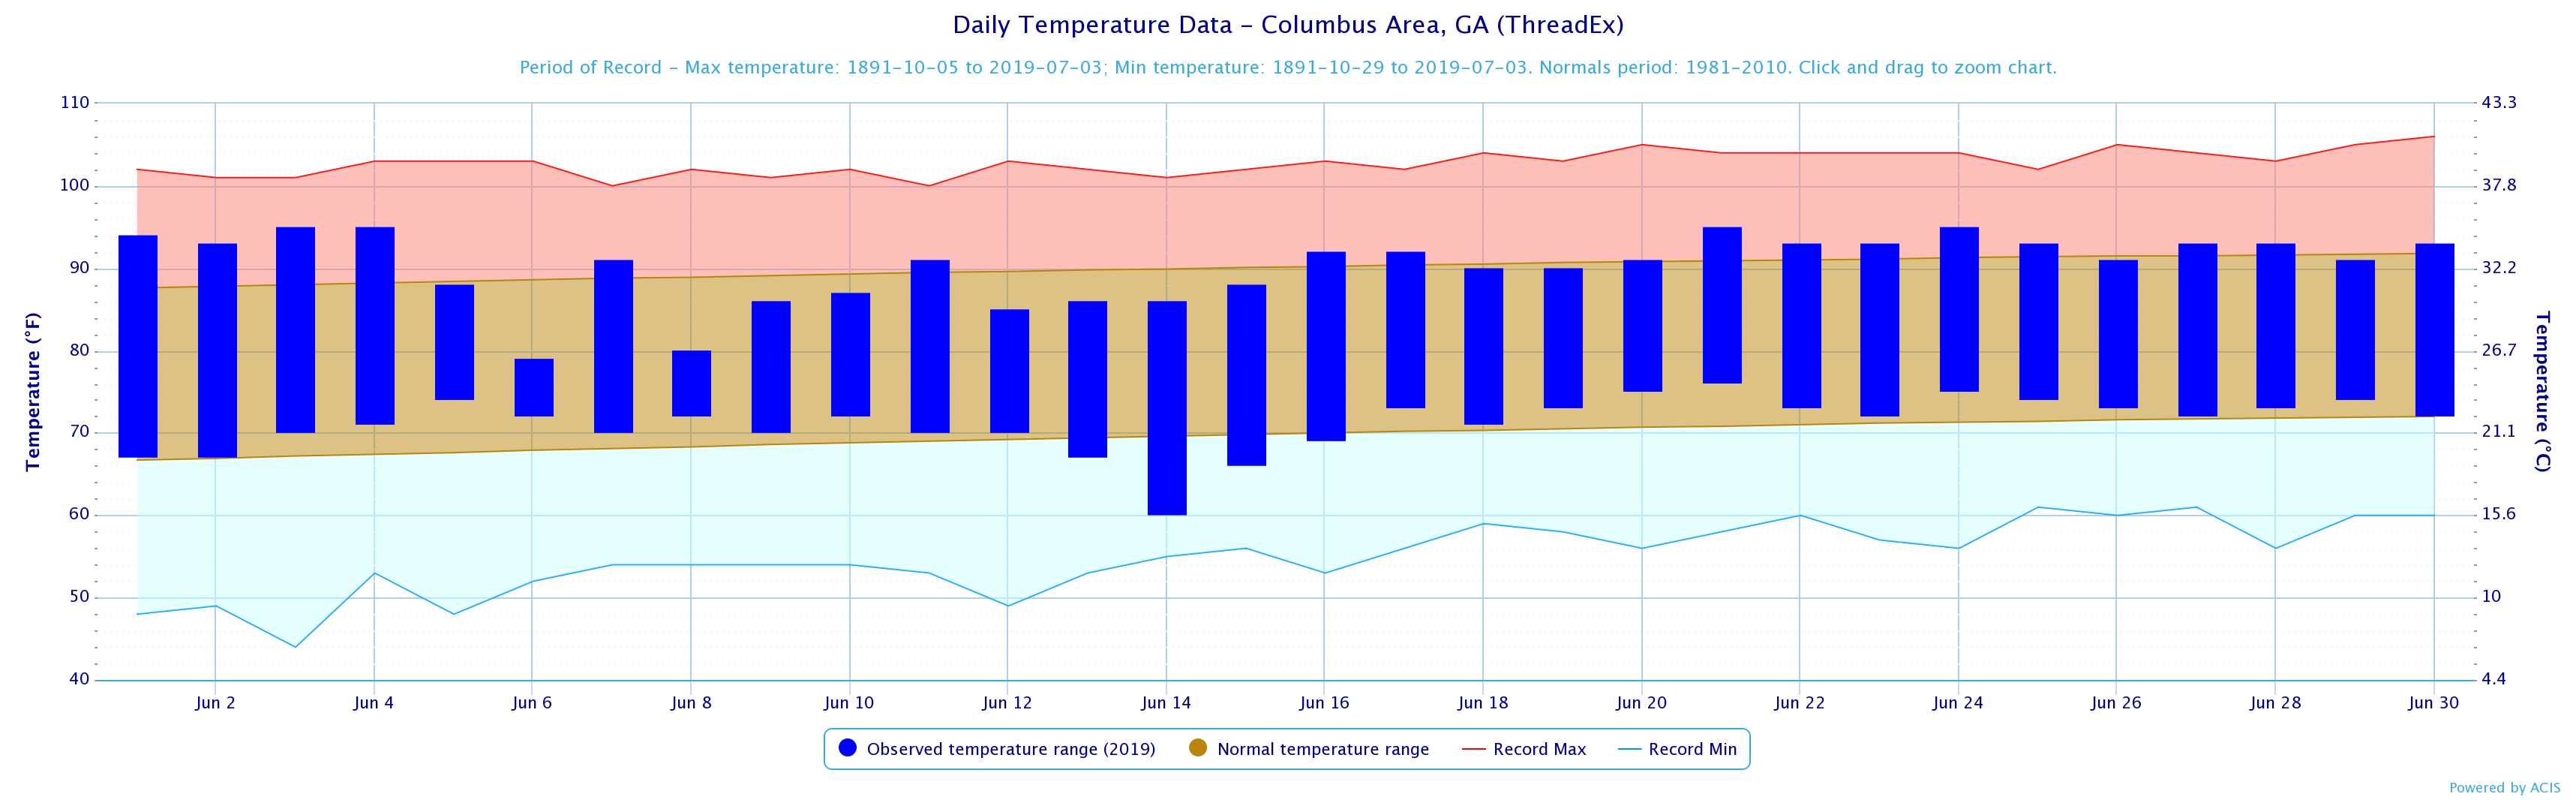
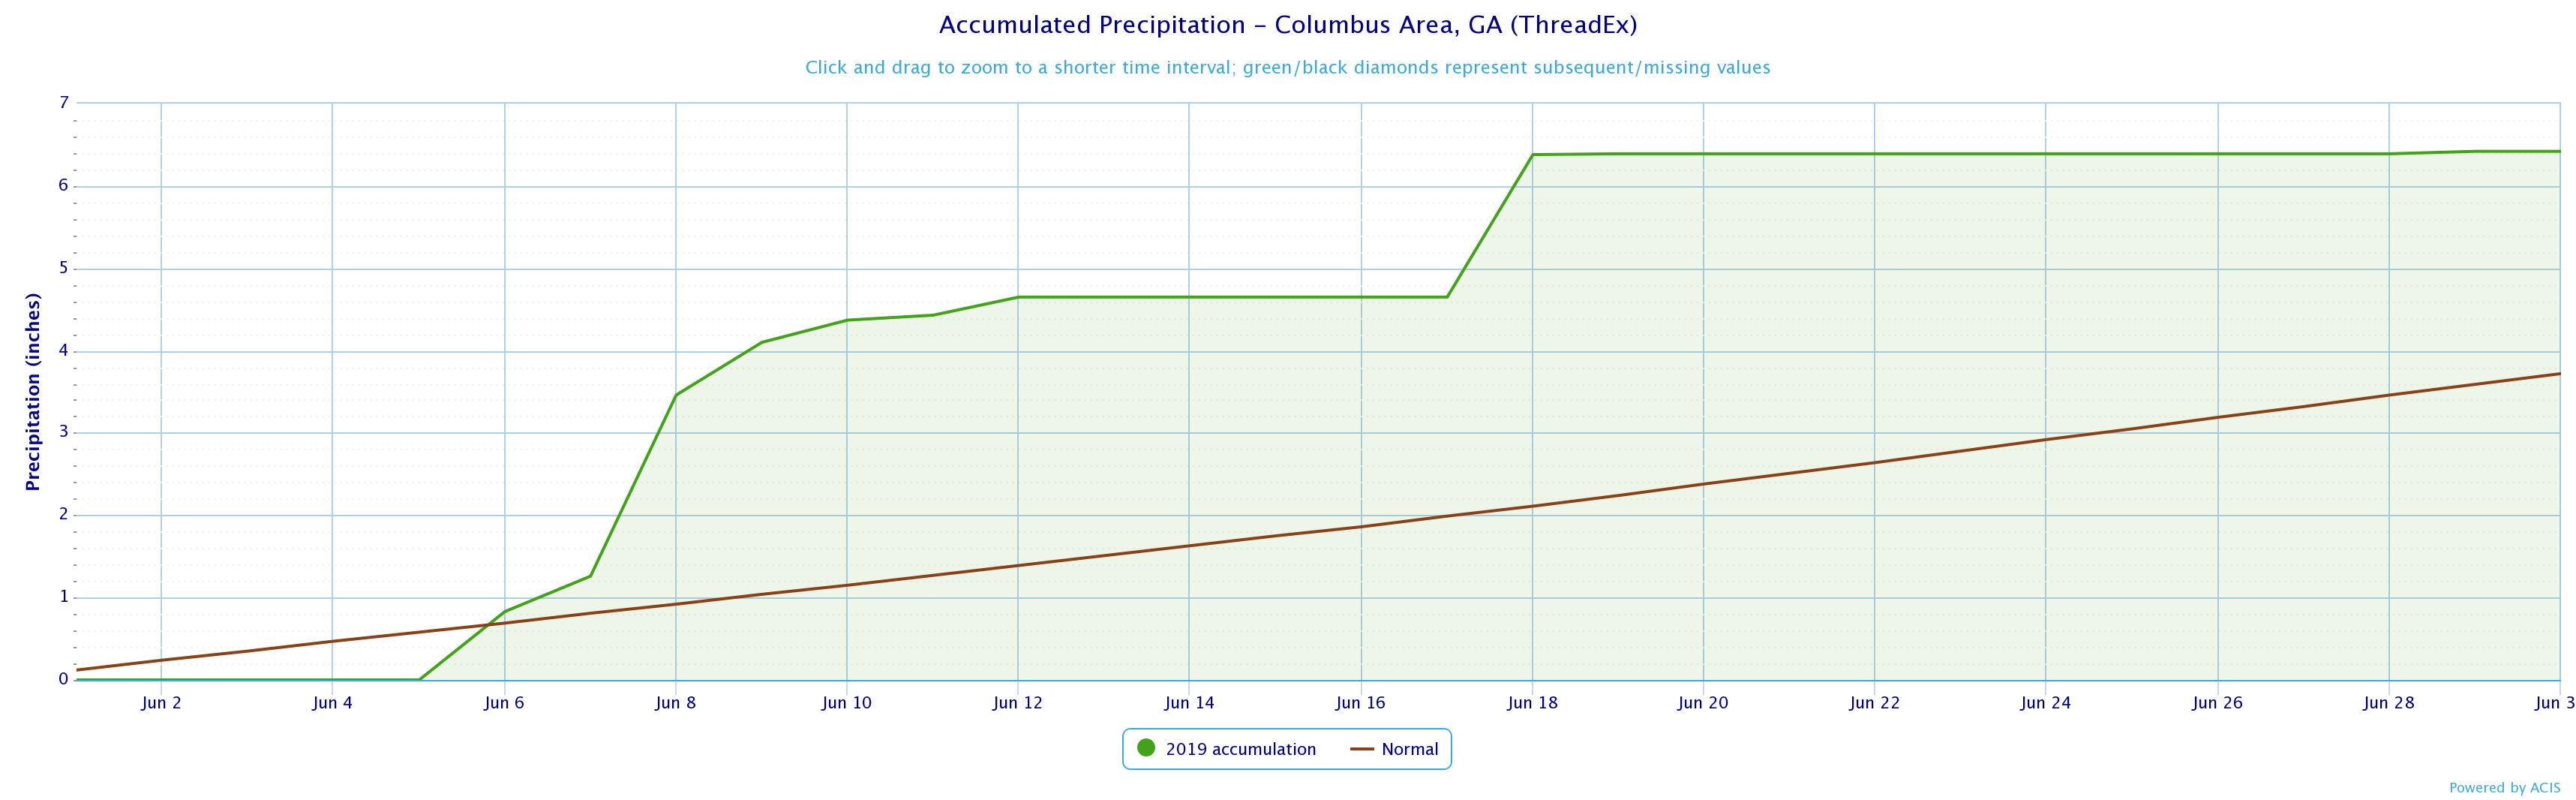
Columbus |
95 (6/3,6/4,6/21,6/24) |
60 (6/14) |
|
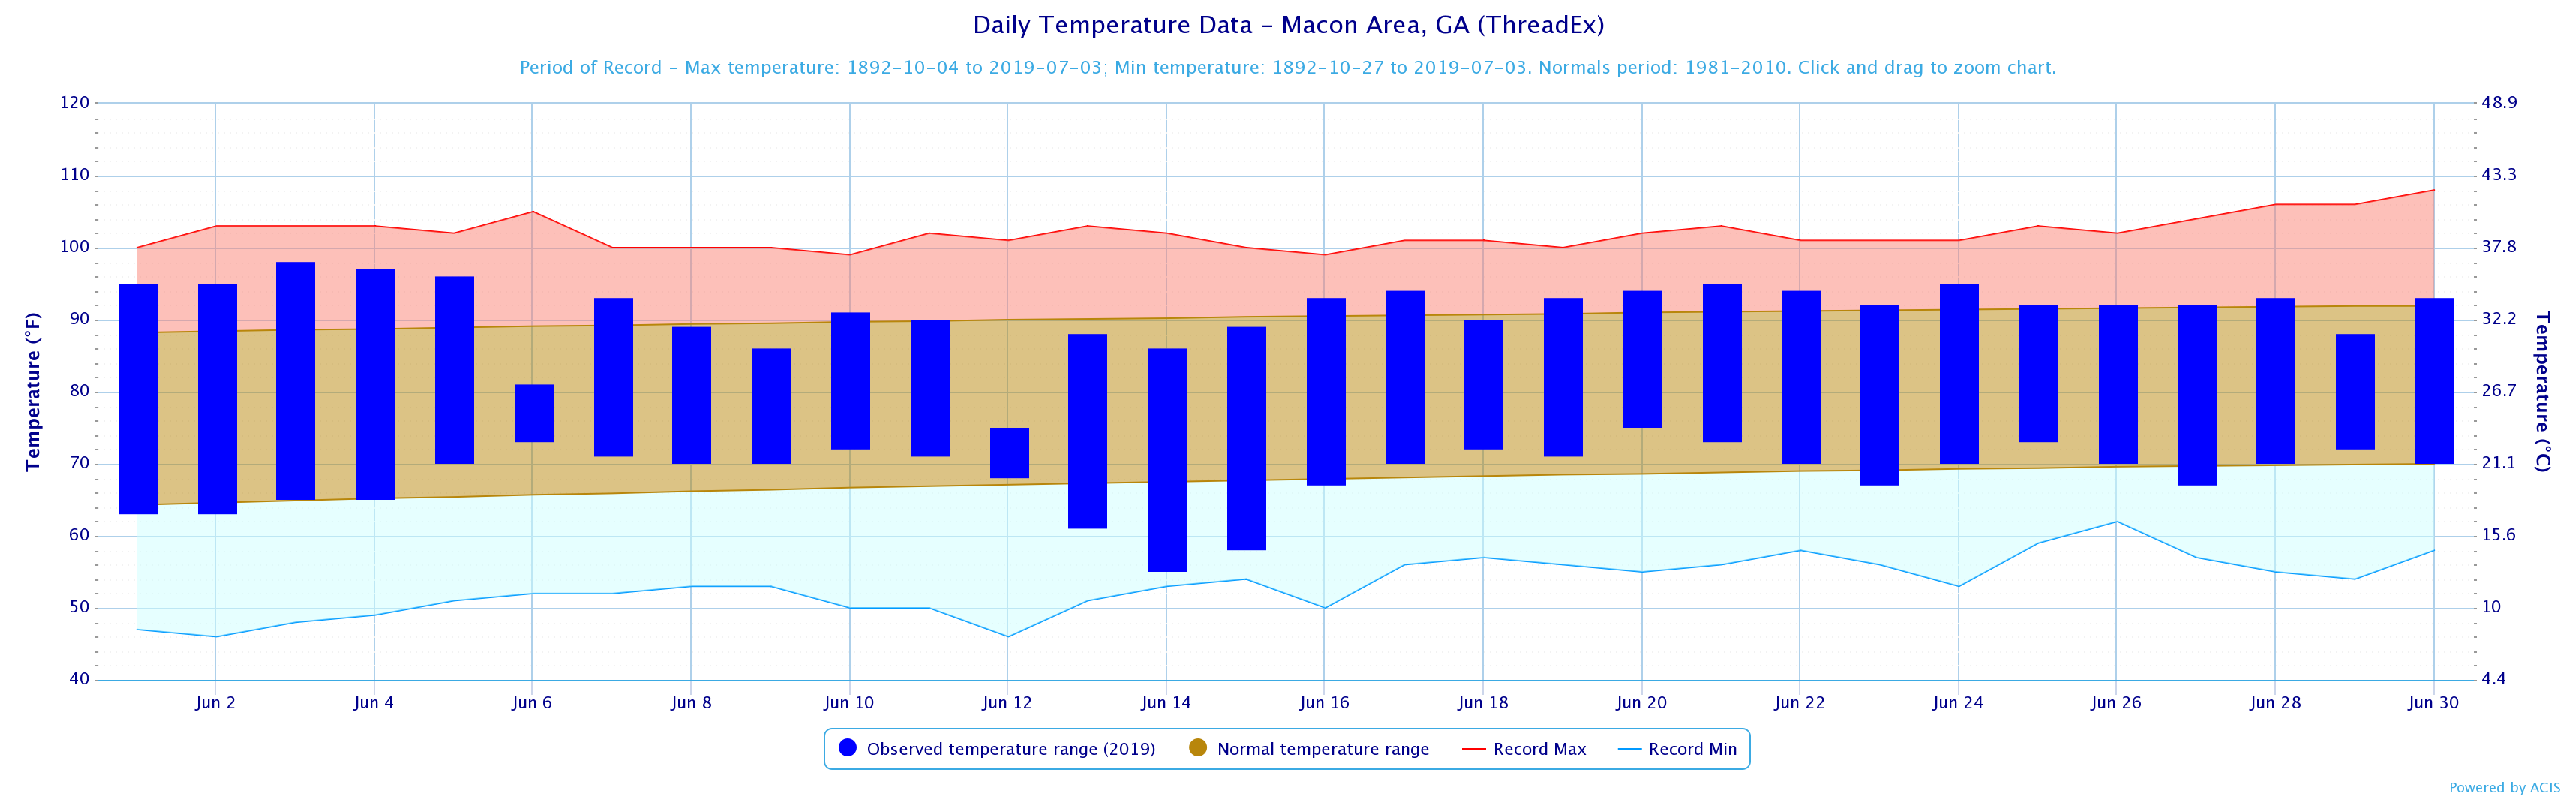
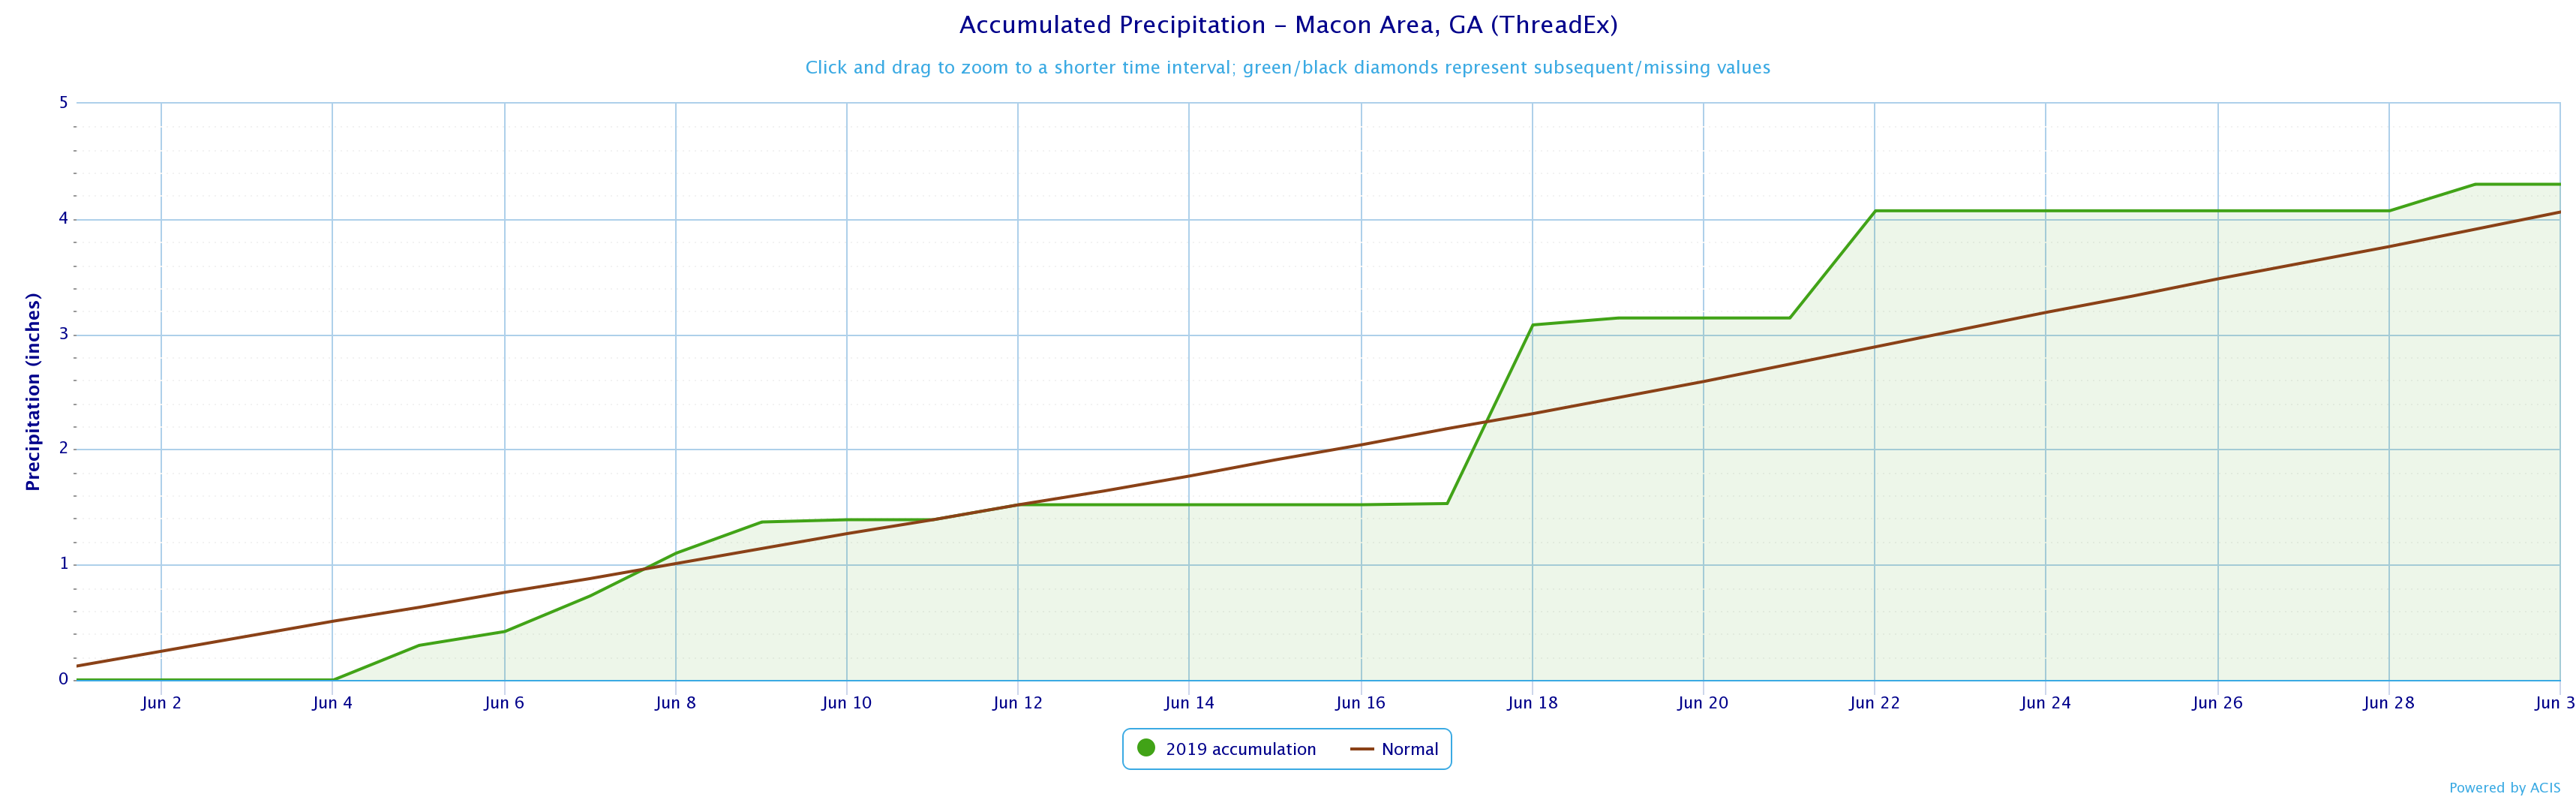
Macon |
98 (6/3) |
55 (6/14) |
|
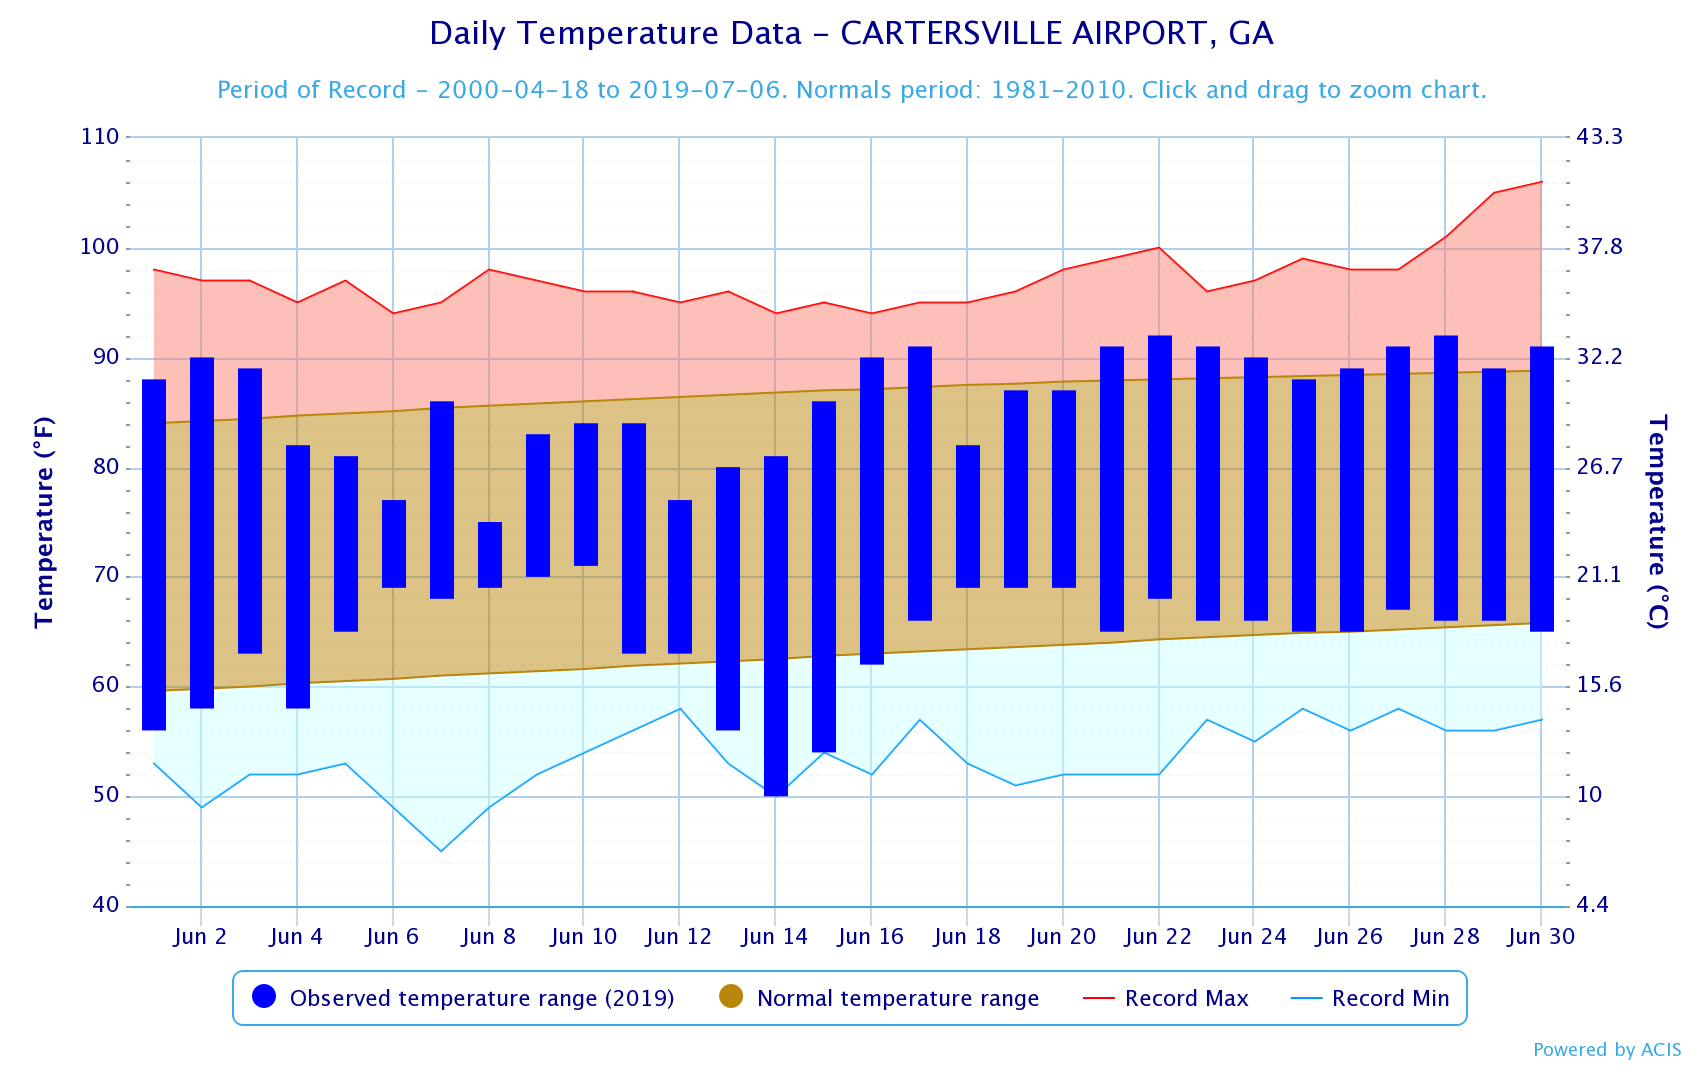
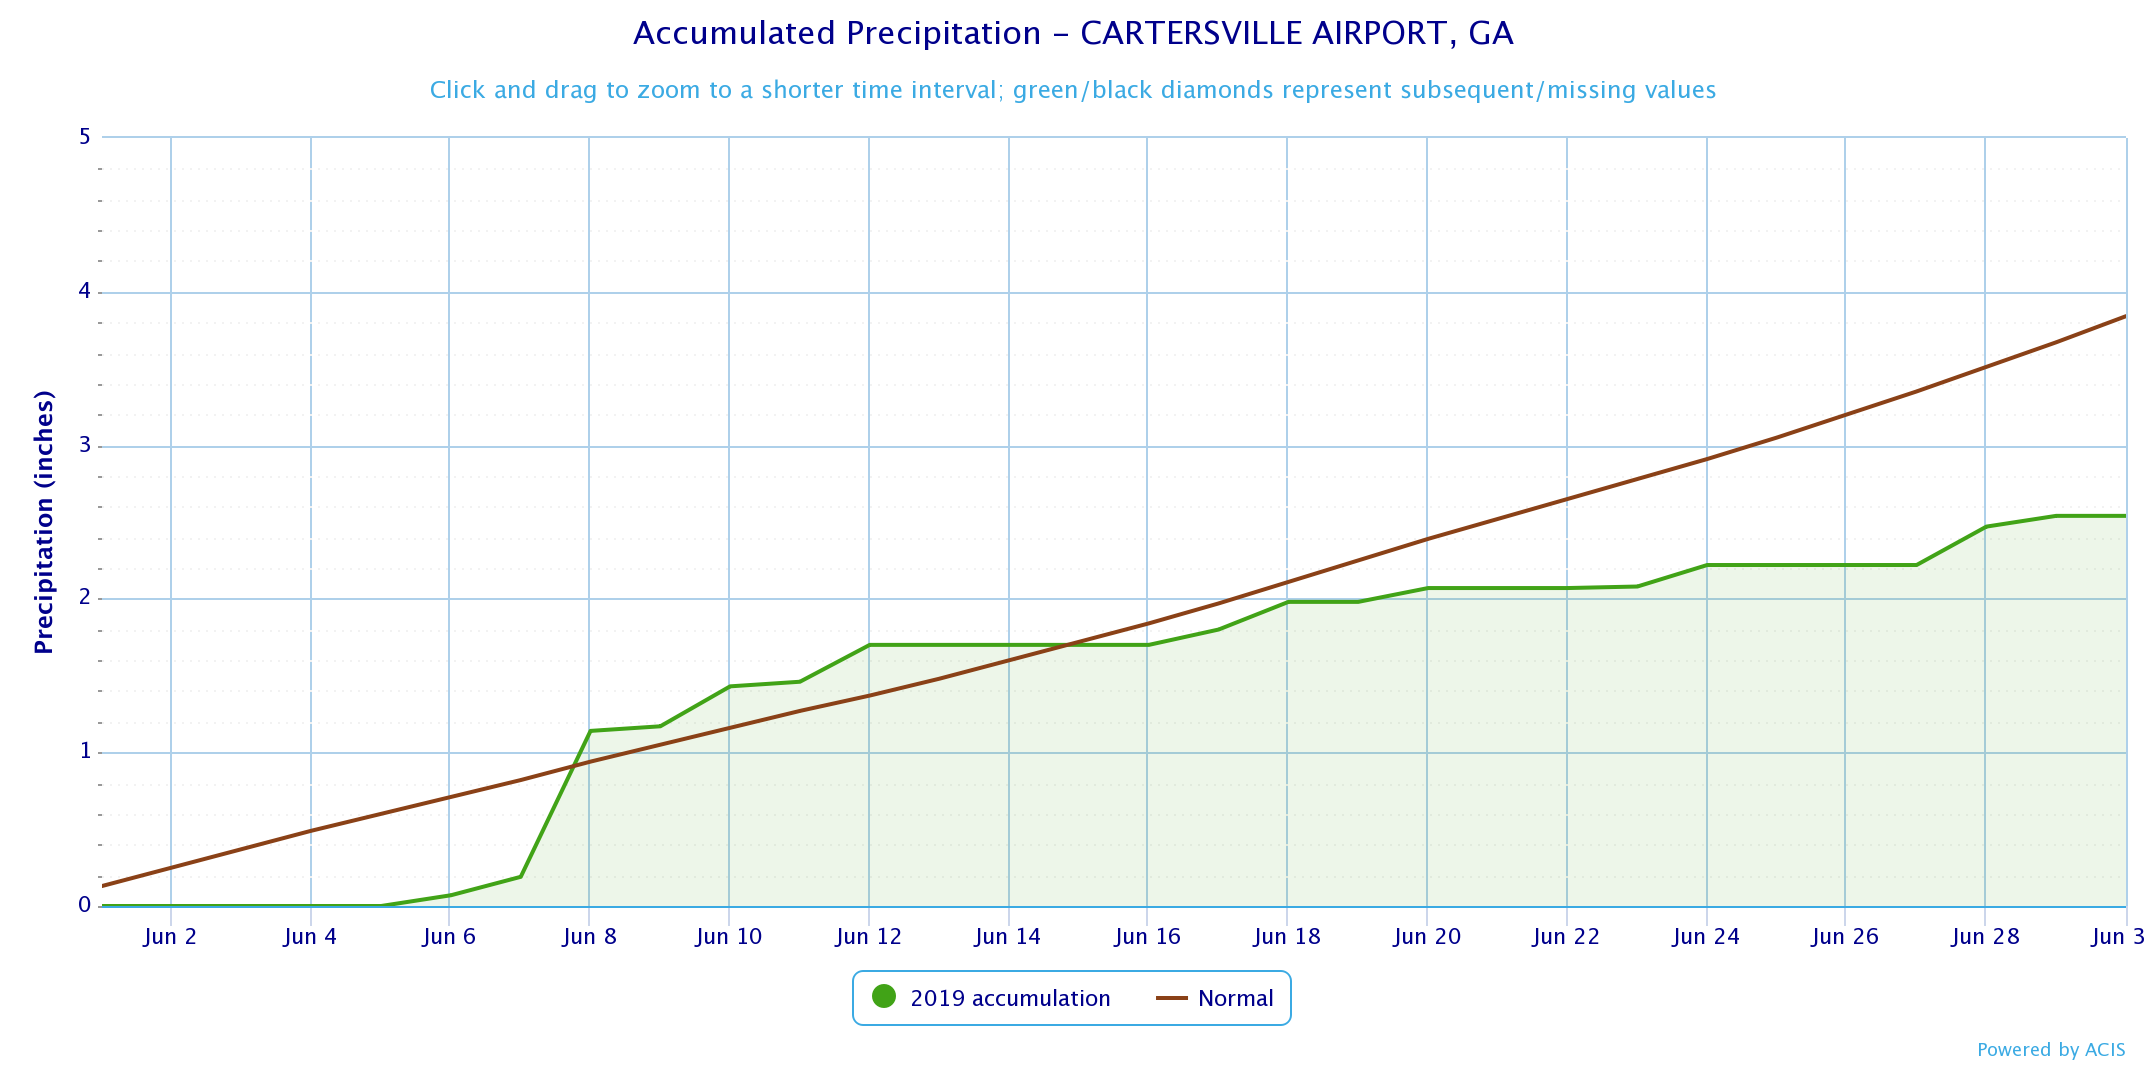
Cartersville |
92 (6/22,6/28) |
50 (6/14)* |
|
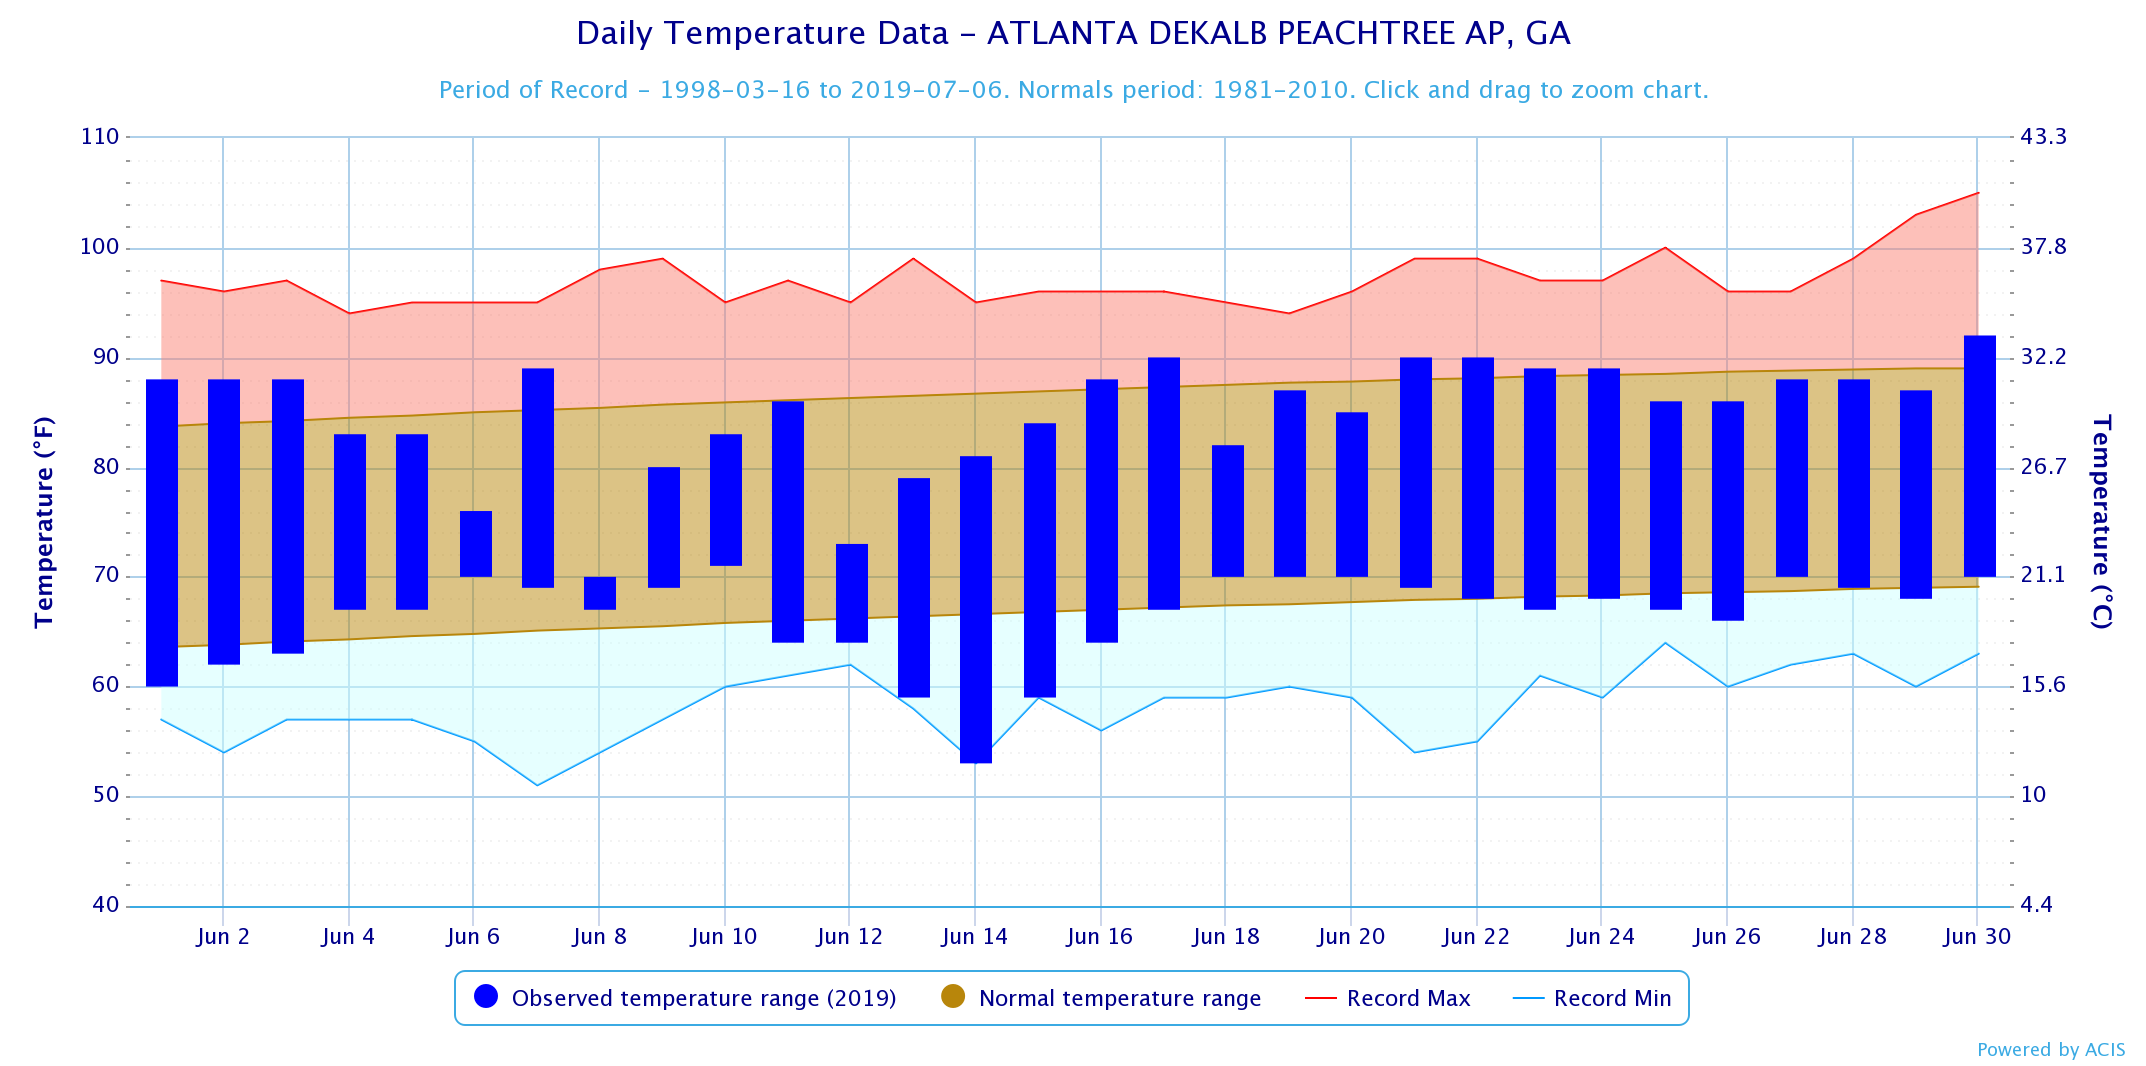
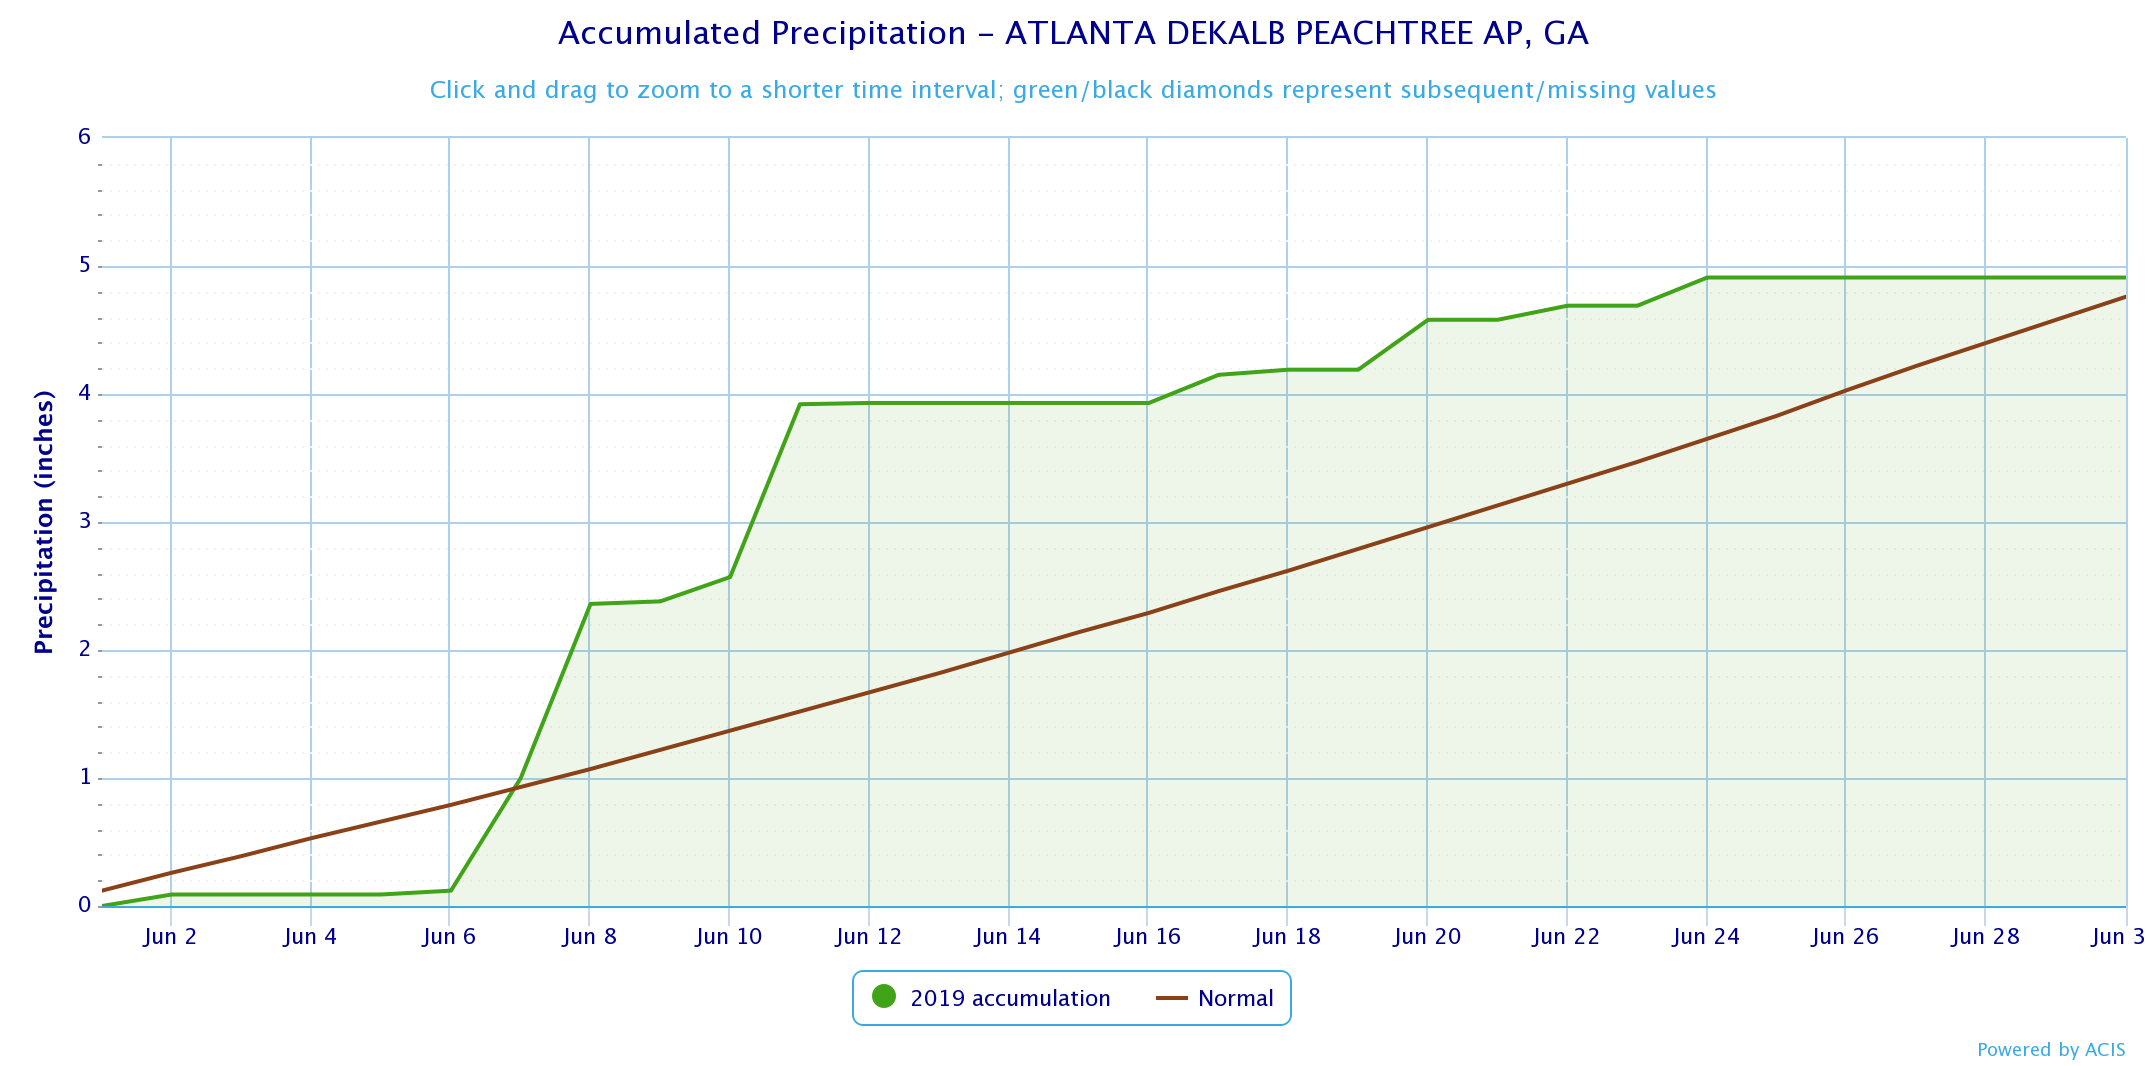
DeKalb Peachtree Arpt |
92 (6/30) |
53 (6/14)* |
|
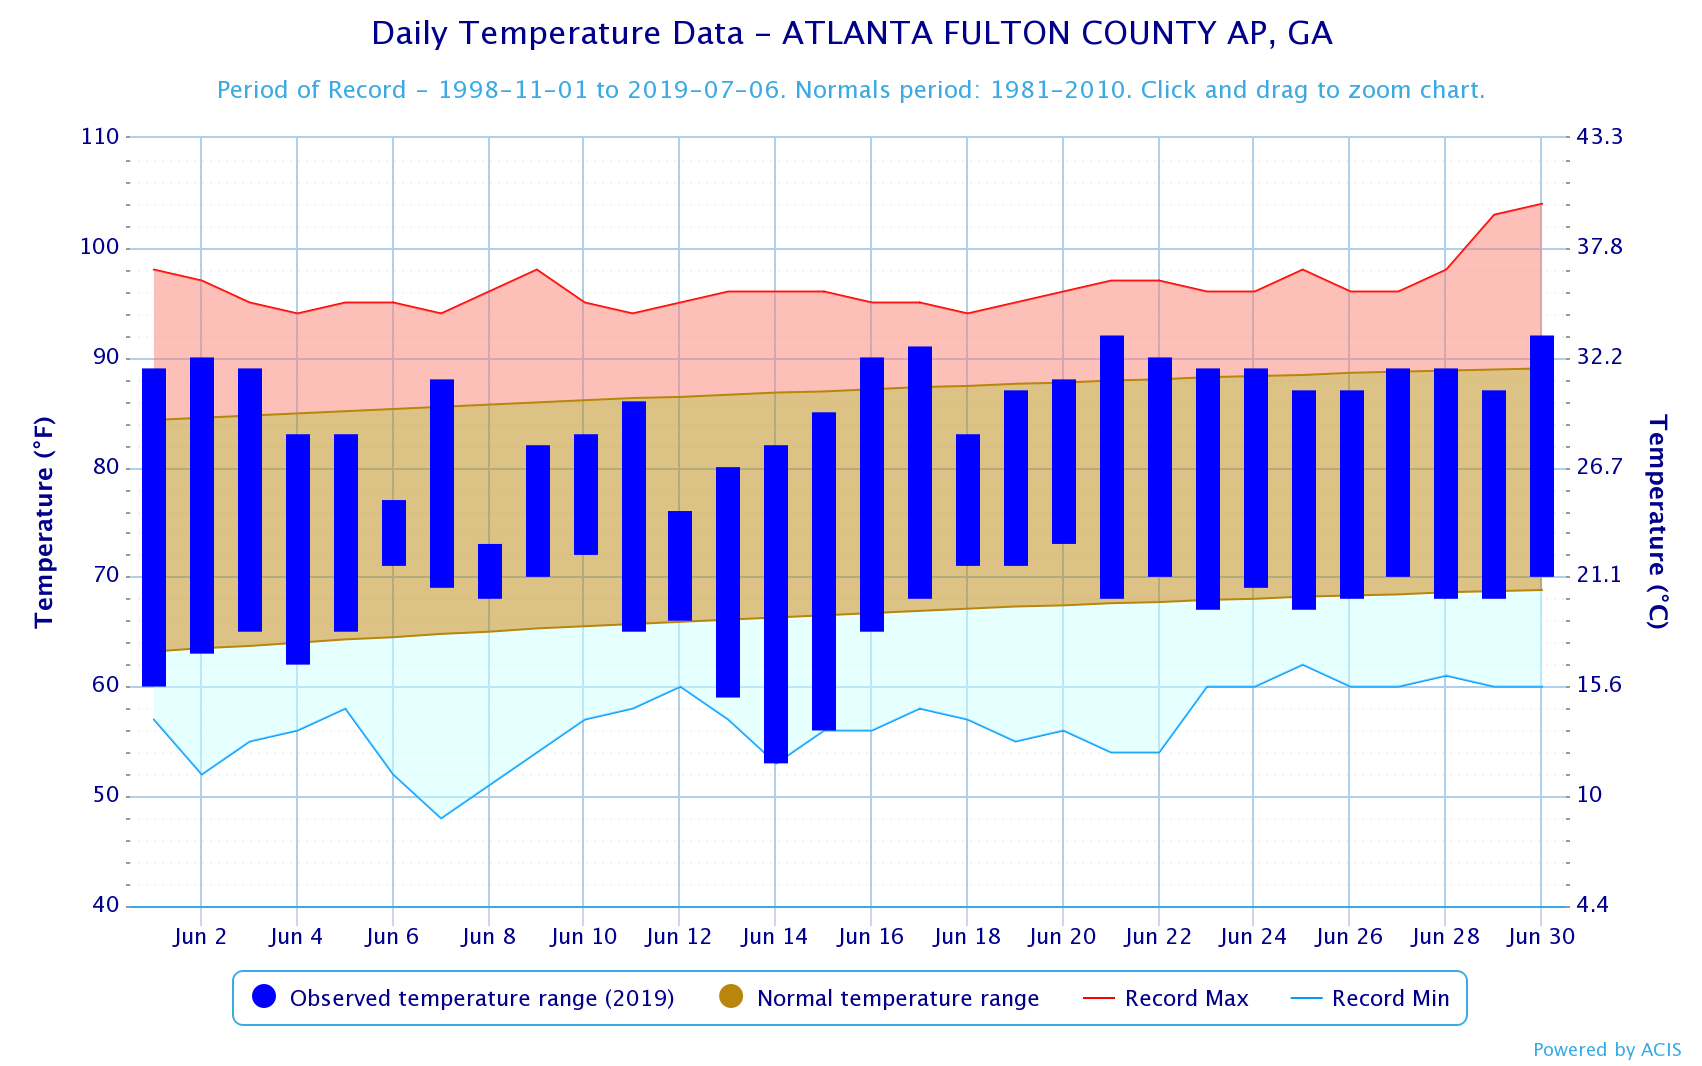
Fulton Co. Arpt |
92 (6/21,6/30) |
53 (6/14)* |
|
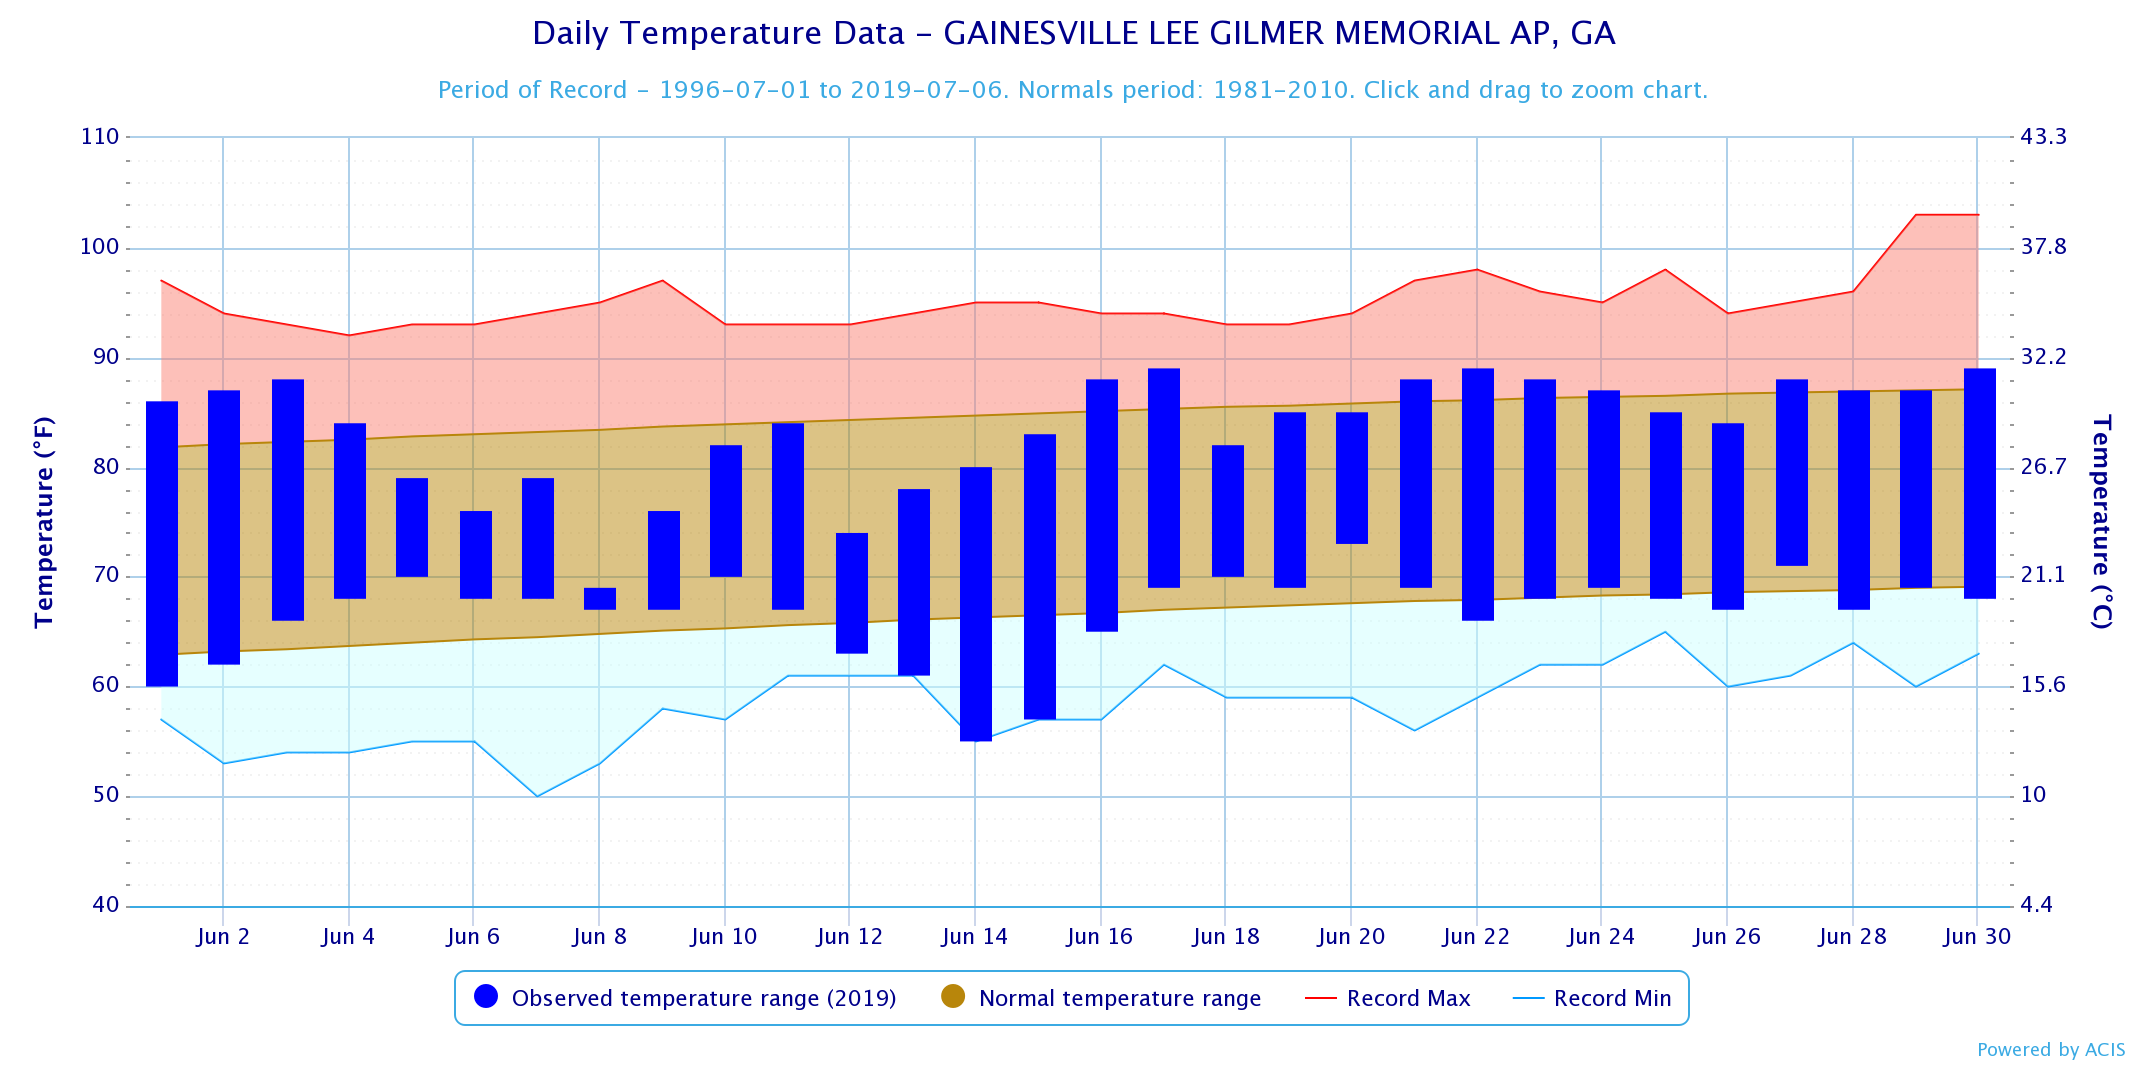
Gainesville |
89 (6/17,6/22,6/30) |
55(6/14)* |
|
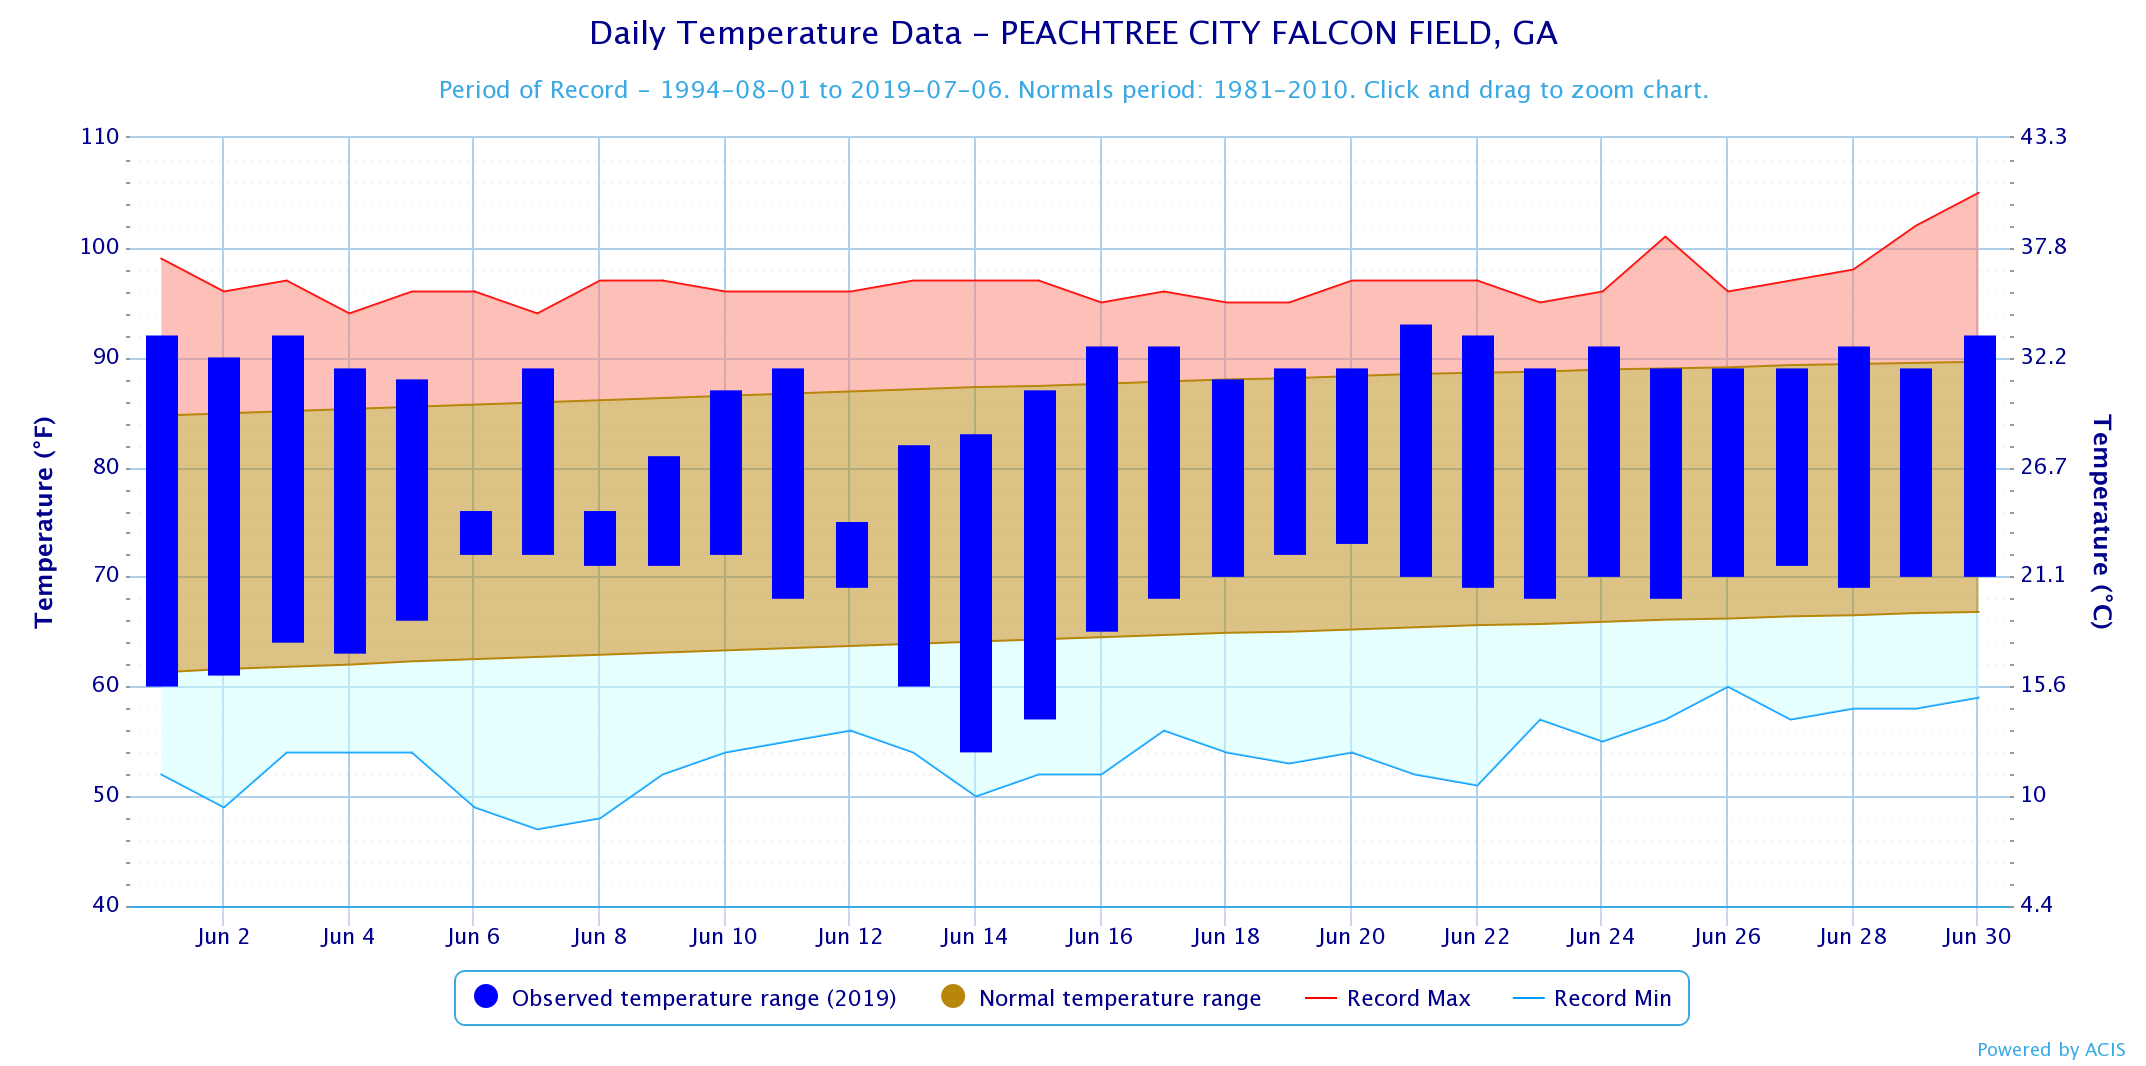
Peachtree City |
93 (6/21) |
54 (6/14) |
|
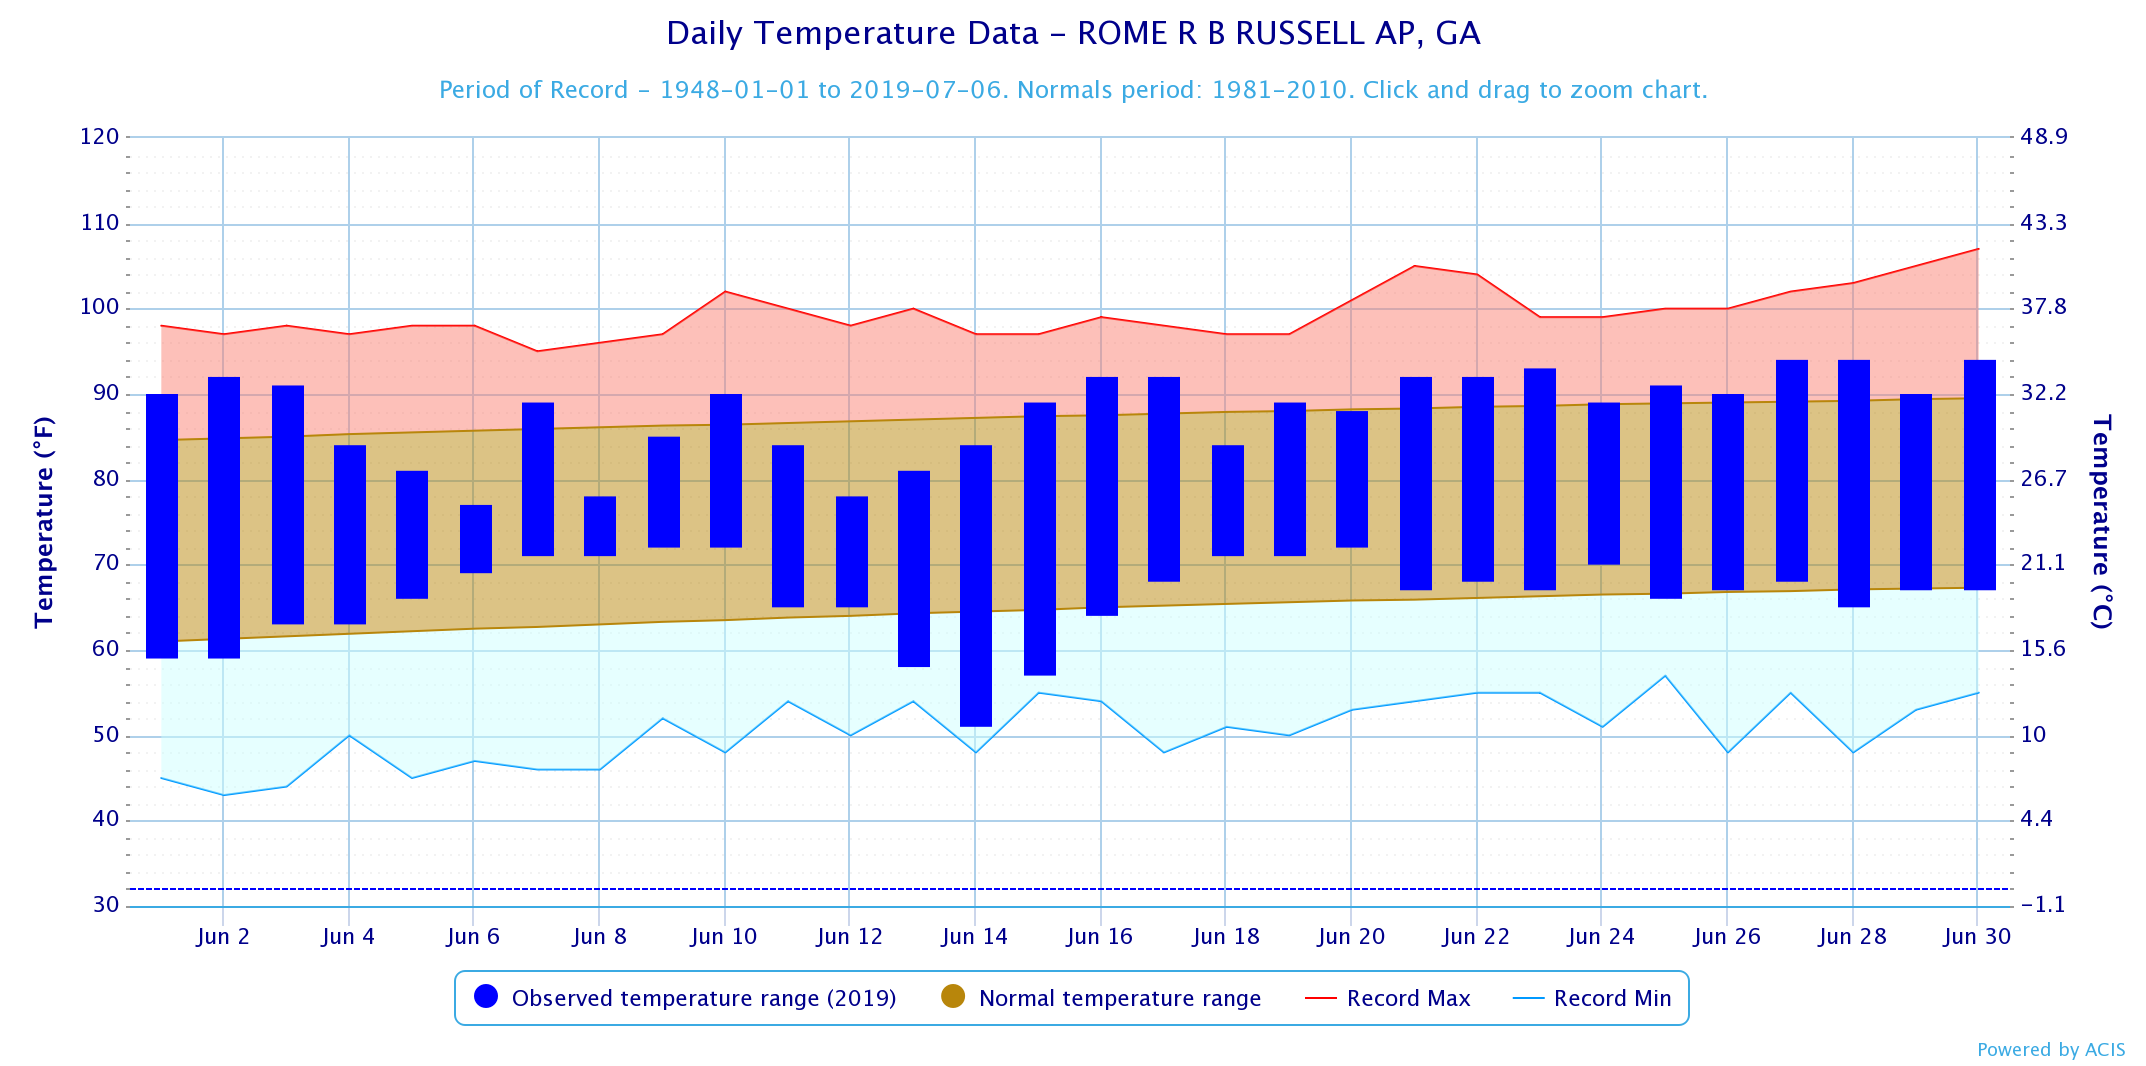
Rome |
94 (6/27,6/28,6/30) |
51 (6/14) |
* Set record for day
June Avg. Temperature (°F) and Rankings
* Click on site name below to view a graph with additional data
|
Site |
Avg. Temp. and Current Ranking |
Normal |
Dep. from Normal |
Record |
|
77.0 (64th Warmest) |
77.5 |
-0.5 |
82.1 (1981) |
|
|
77.7 (48th Warmest) |
77.3 |
+0.4 |
82.3 (1952) |
|
|
80.7 (39th Warmest) |
79.8 |
+0.9 |
84.7 (1914) |
|
|
79.9 (43rd Warmest) |
78.9 |
+1.0 |
84.3 (1952) |
|
|
75.2 |
74.8 |
+0.4 |
|
|
|
75.6 |
76.8 |
-1.2 |
|
|
|
76.2 |
76.7 |
-0.5 |
|
|
|
75.1 |
75.6 |
-0.5 |
|
|
|
77.5 |
75.9 |
+1.6 |
|
|
|
76.9 |
75.9 |
+1.0 |
|
Precip. Extremes (in) for June
|
Site |
Highest Daily Amount |
|
Athens |
3.61 (6/8)* |
|
Atlanta |
3.90 (6/8)* |
|
Columbus |
2.20 (6/8)* |
|
Macon |
1.55 (6/18) |
|
Cartersville |
0.95 (6/8)* |
|
DeKalb Peachtree Arpt |
1.36 (6/8)* |
|
Fulton Co. Arpt |
2.74 (6/8)* All-time June Record |
|
Gainesville |
1.97 (6/8)* |
|
Peachtree City |
4.27 (6/8)* All-time June Record |
|
Rome |
1.18 (6/9) |
* Set record for day
June 2019 Precipitation Totals (in) and Rankings
* Click on site name below to view a graph with additional data
|
Site |
Total Precip. and Current Ranking |
Normal |
Dep. from Normal |
Record |
|
7.03 (18th Wettest) |
4.18 |
+2.85 |
13.25 (1994) |
|
|
6.46 (20th Wettest) |
3.95 |
+2.51 |
11.21 (1912) |
|
|
6.42 (14th Wettest) |
3.72 |
+2.70 |
10.83 (1967) |
|
|
4.39 (44th Wettest) |
4.06 |
+0.33 |
12.25 (2013) |
|
|
2.54 |
3.84 |
-1.30 |
|
|
|
4.91 |
4.76 |
+0.15 |
|
|
|
5.00 |
4.13 |
+0.87 |
|
|
|
6.98 |
4.39 |
+2.59 |
|
|
|
8.78 |
3.63 |
+5.15 |
|
|
|
3.59 |
4.10 |
-0.51 |
|
Records Set this June
Athens:
Atlanta:
Columbus:
Macon:
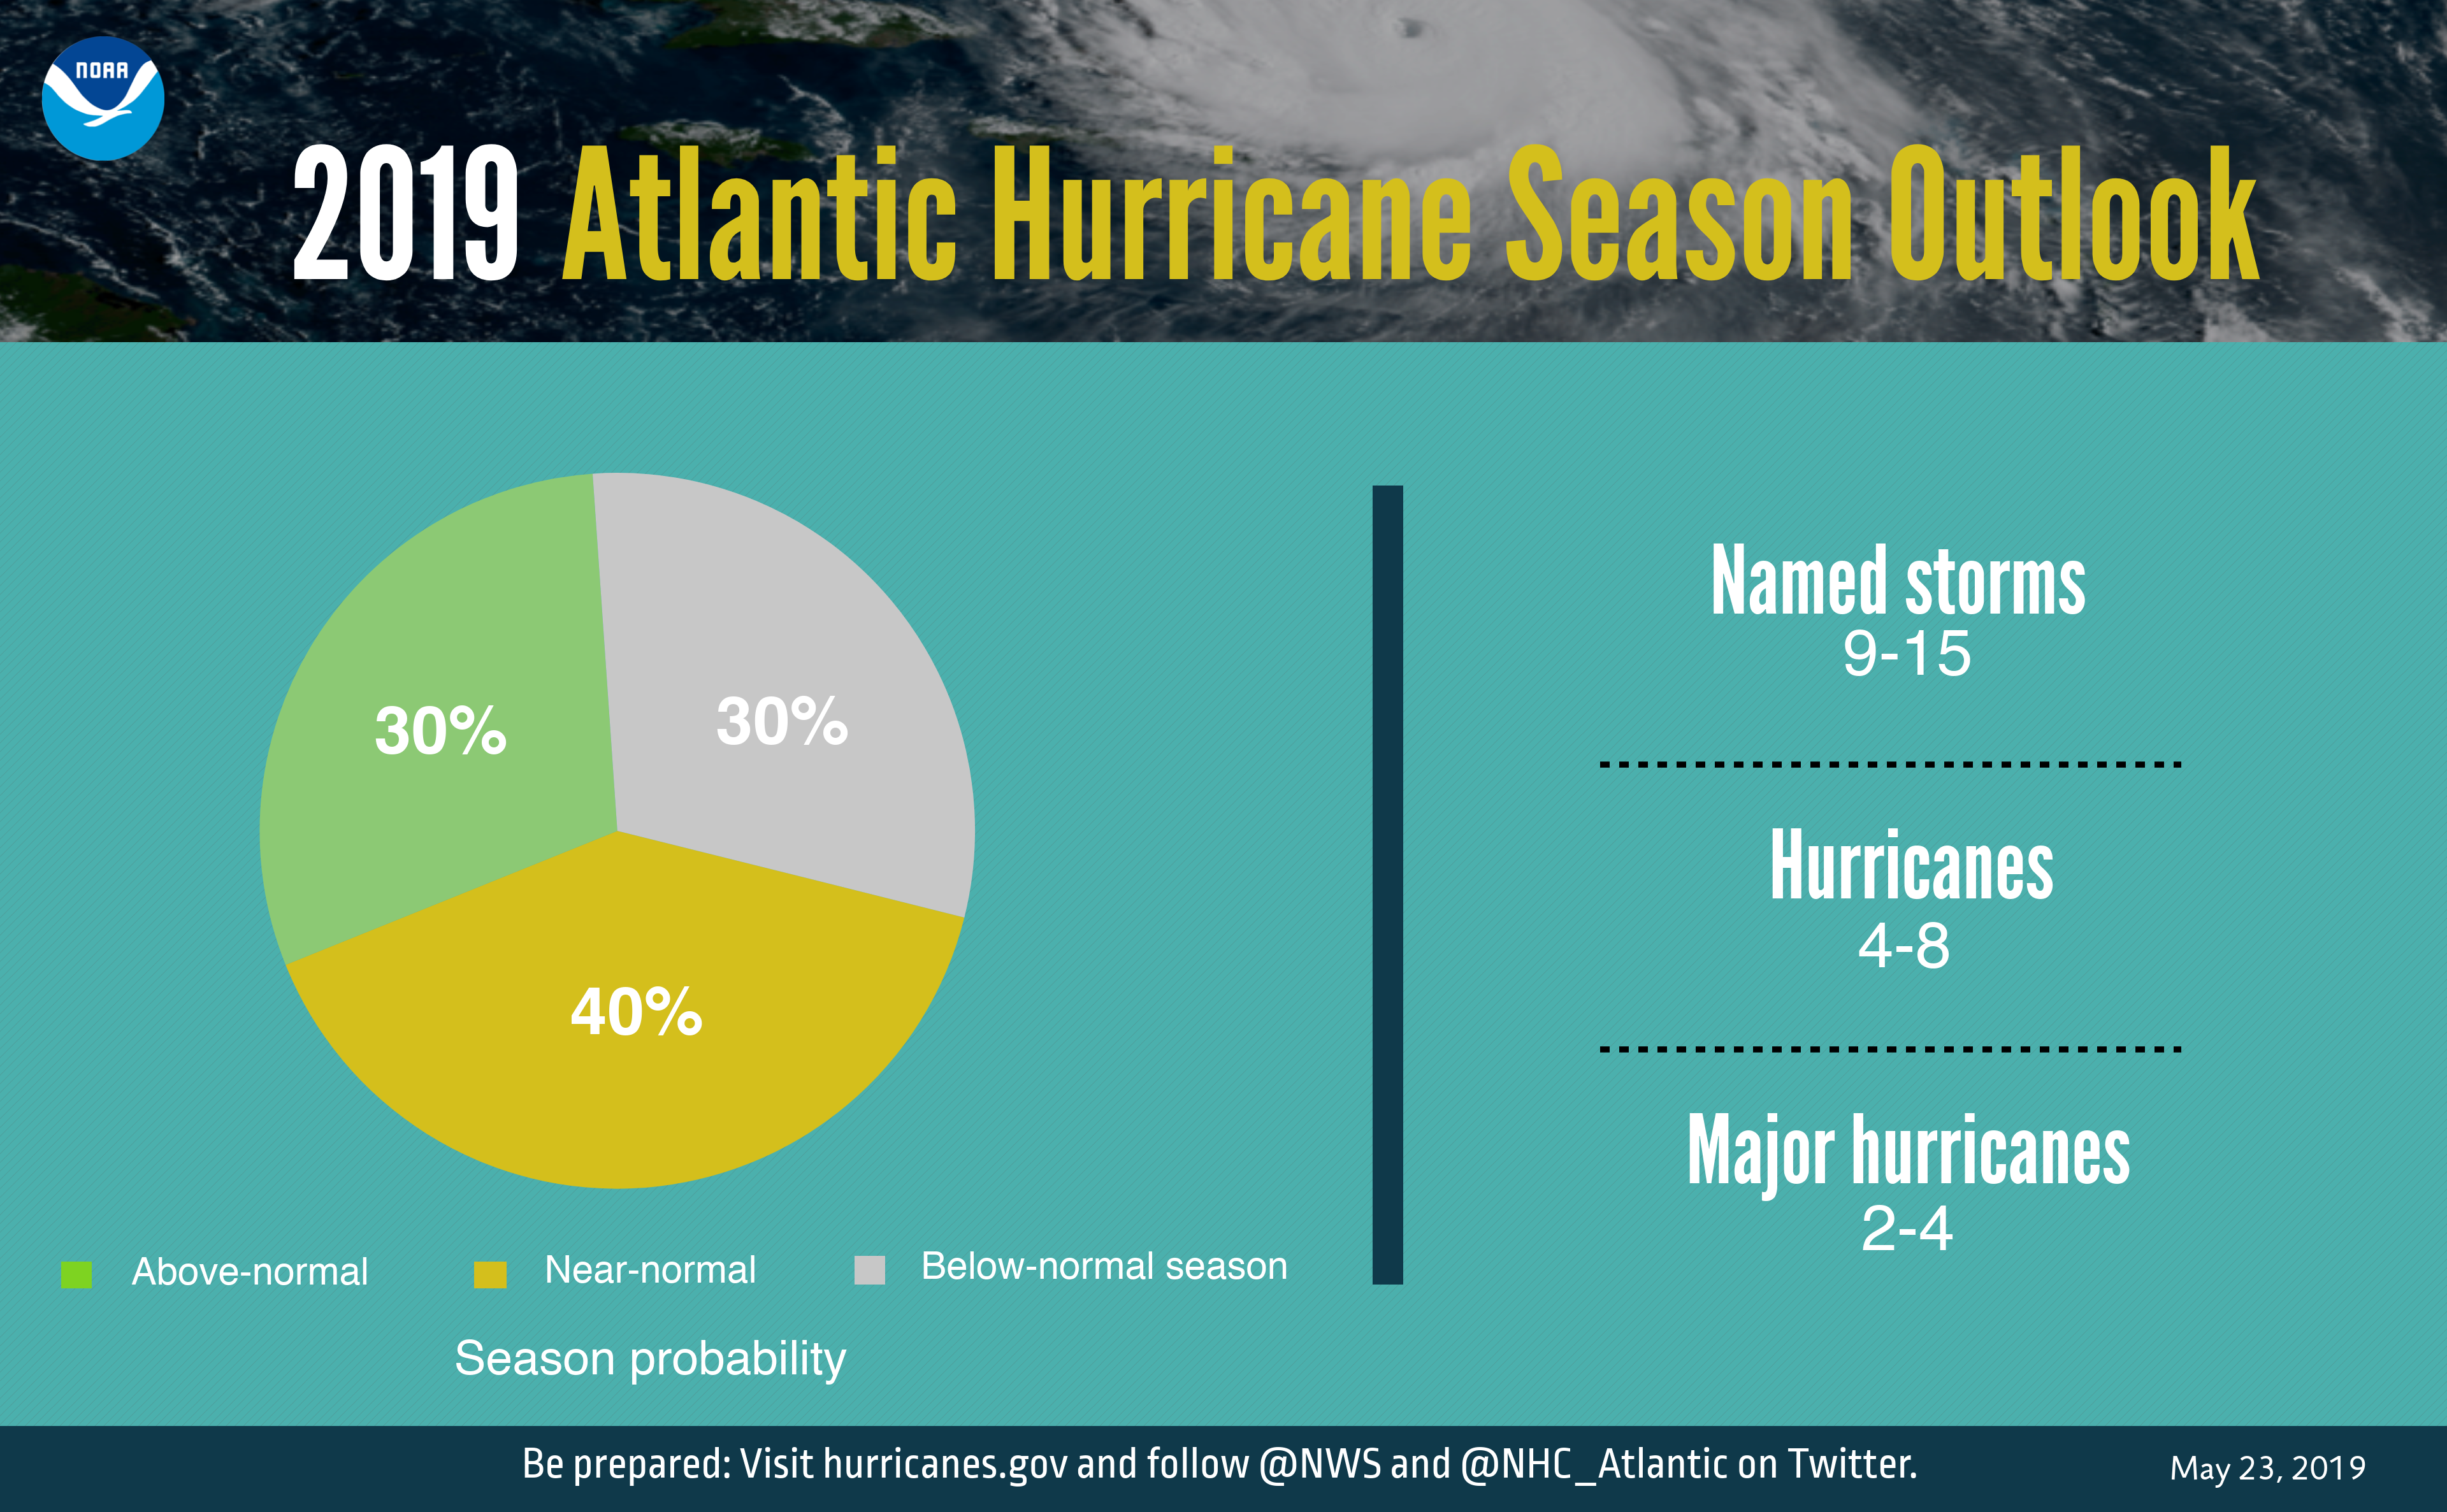
UPDATED (August 8 2019) - NOAA’s 2019 Atlantic Hurricane Season Outlook
Update - NOAA updated the 2019 Atlantic Hurricane Season Outlook was updated and several numbers have increased. The number of named storms predicted was previously 9 to 15 storms and is now 10 to 17 named storms, the number of predicted hurricanes was previously 4 to 8 hurricanes and is now 5 to 9 hurricanes, and the number of predicted major hurricanes has remained at 2 to 4 major hurricanes. For this current hurricane season, NOAA is now predicting an above-normal Atlantic hurricane season. For more information on the outlook click here.
July Outlook
Based on the Climate Prediction Center’s July outlook, all of north and central Georgia has a 40 to 50% chance of above normal temperatures. For precipitation, much of north Georgia has a 40 to 50% chance of below normal precipitation, other portions of north and central Georgia has a 33 to 40% chance of below normal precipitation.
 |
 |
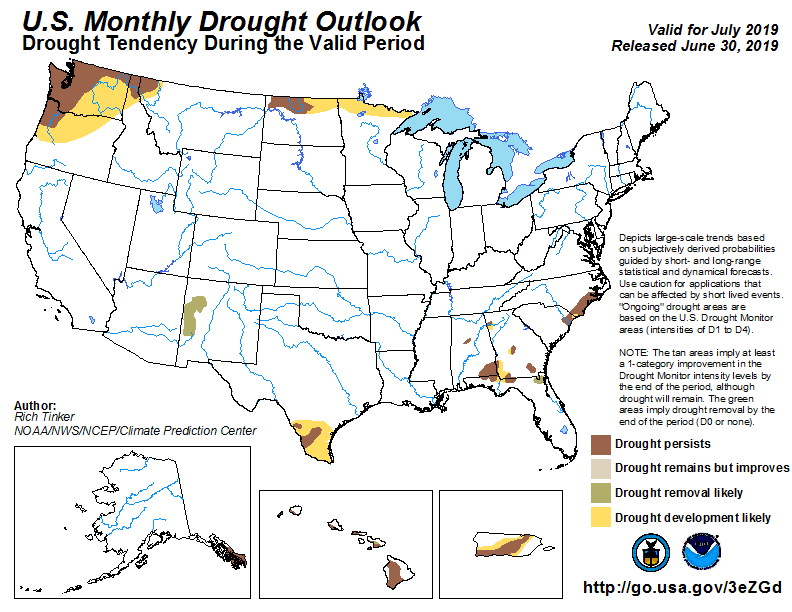
July Drought Outlook
Based on the U.S. Monthly Drought Outlook for June, an overall reduction in drought coverage is expected.
Data prepared by the Atlanta Forecast Office.

