| Previous Month | Next Month |
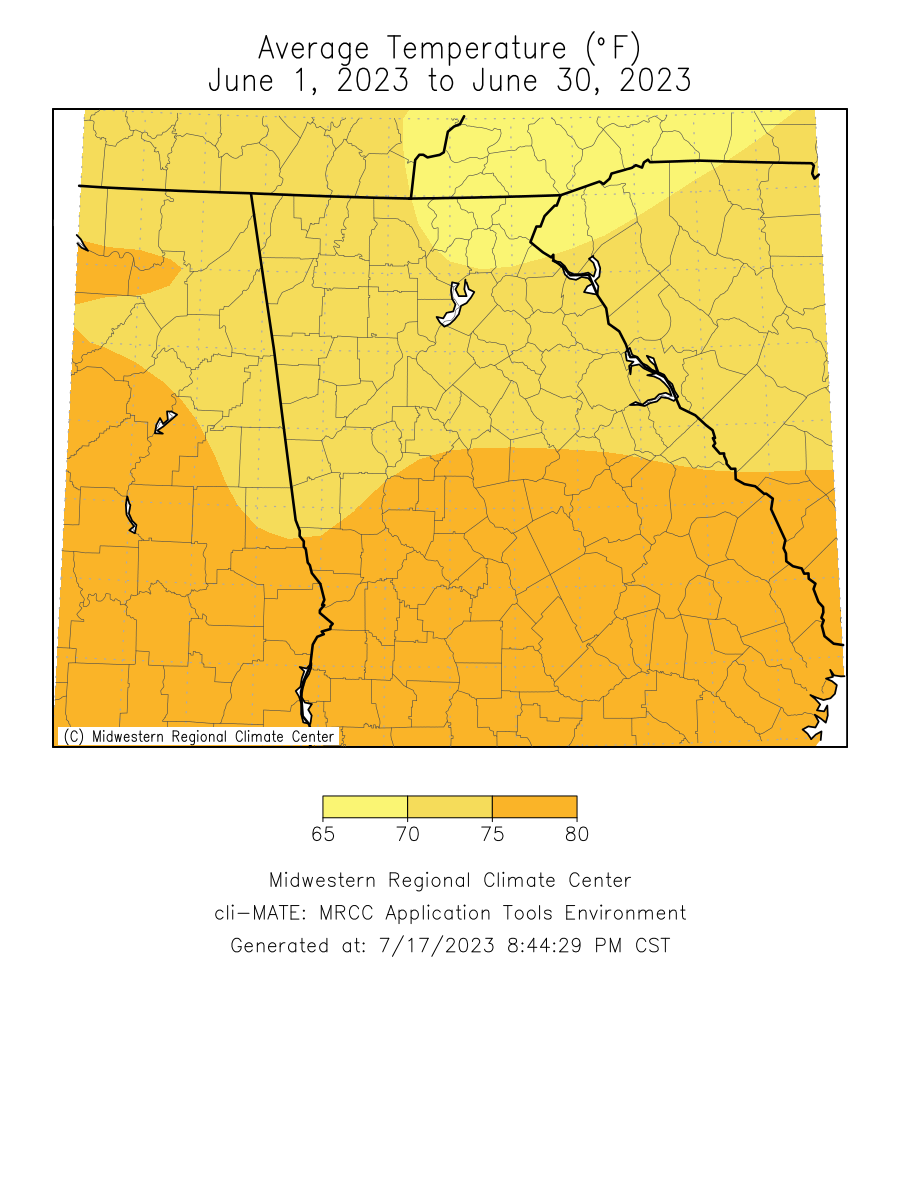
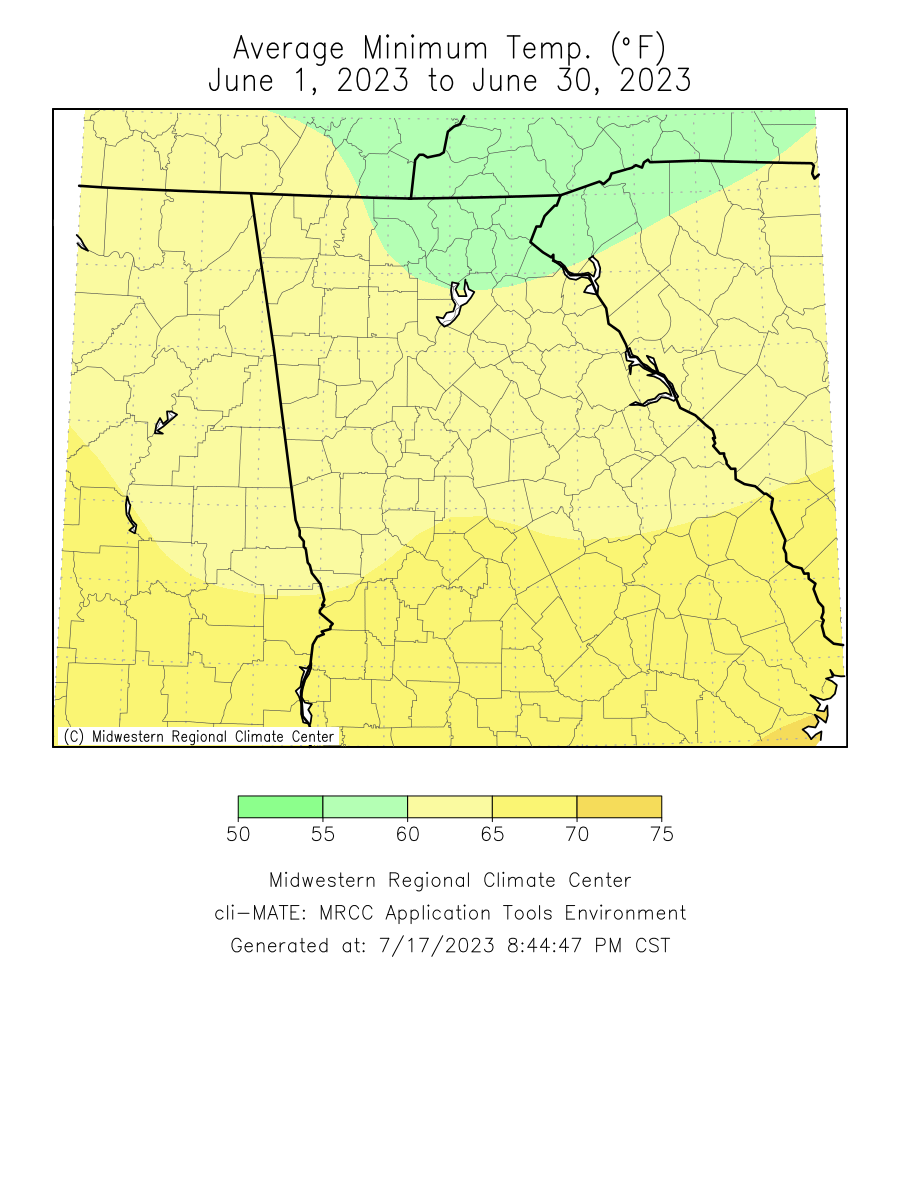
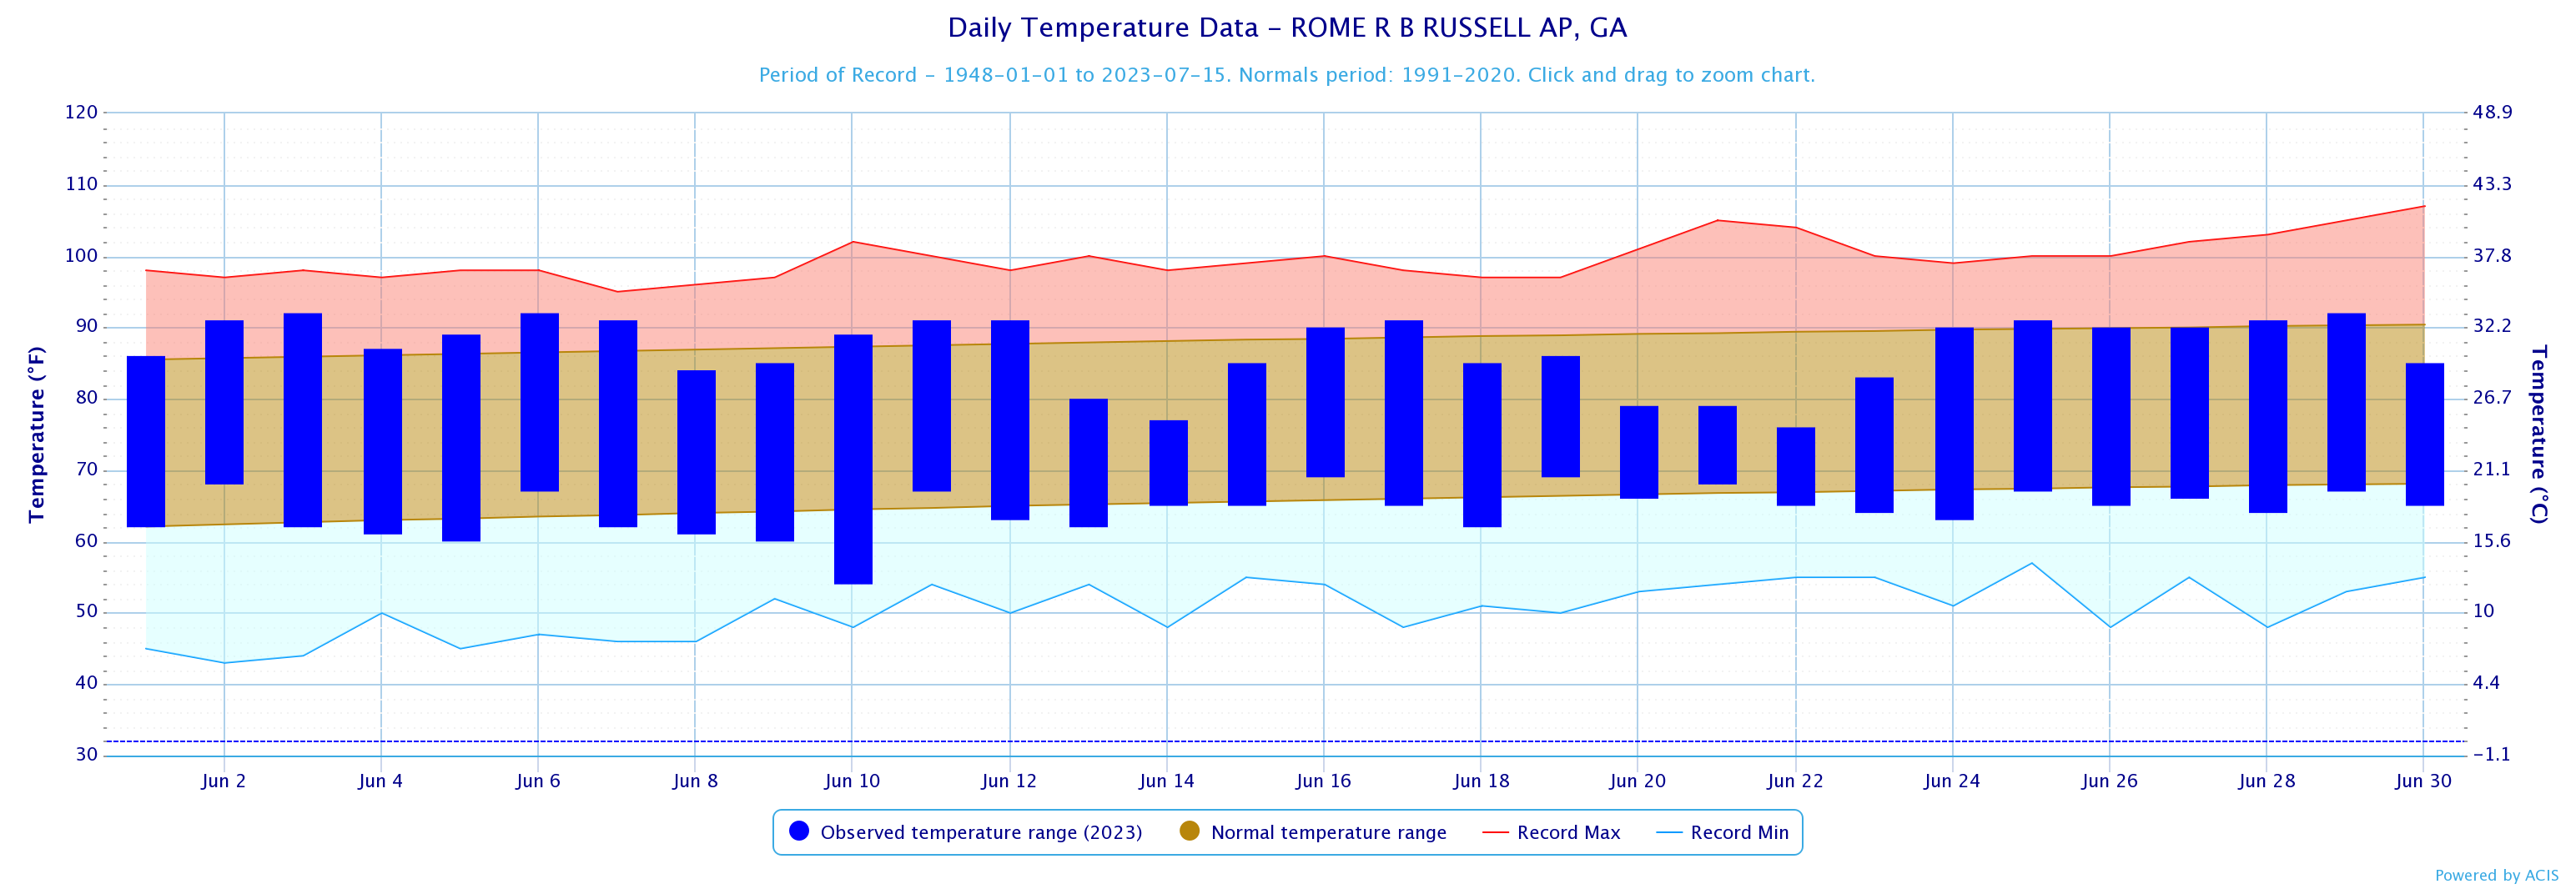
Temperatures through the month of June were around 2 degrees below normal. Precipitation through the month of May was within 3 inches of normal.
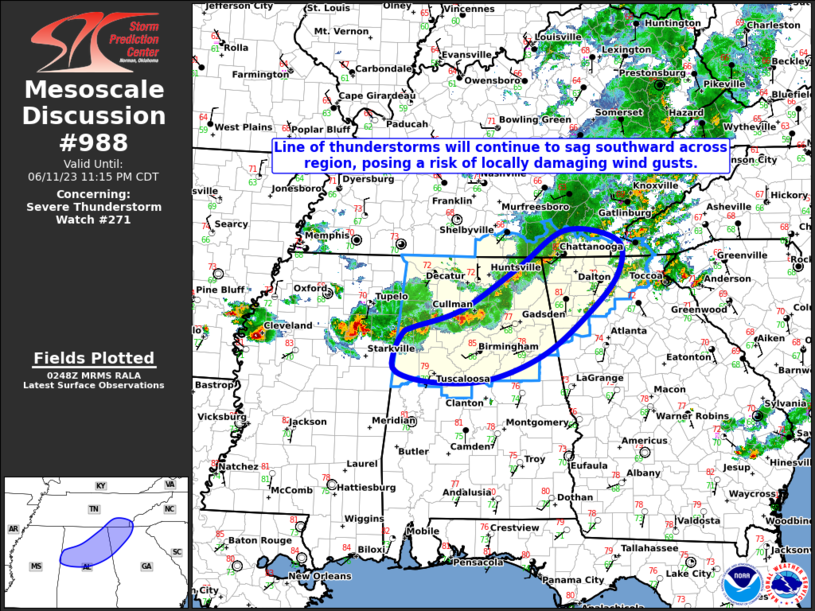
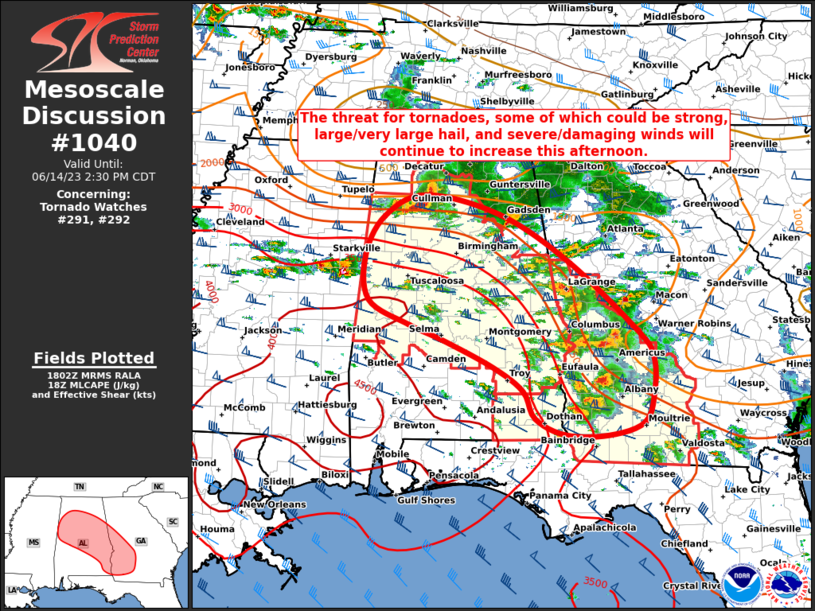
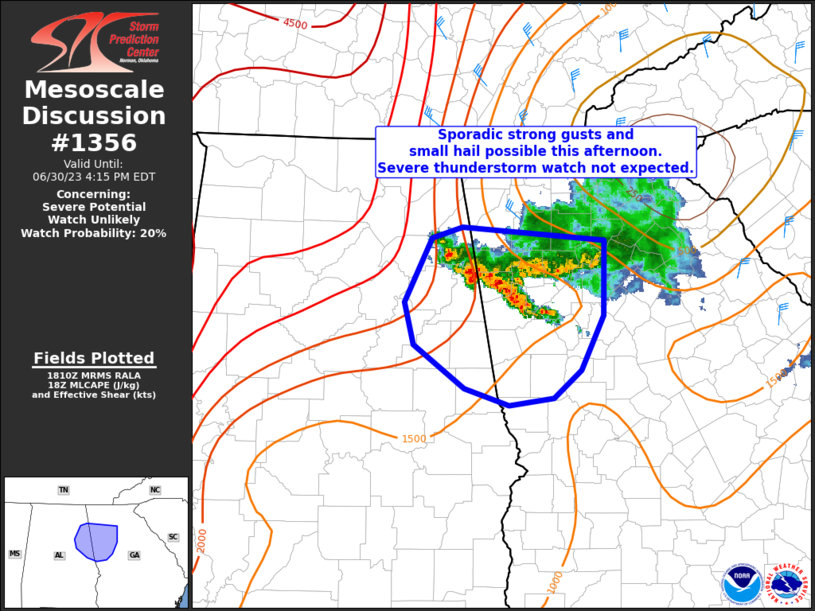
Climate Site Maximum Temperature Max T Date Climate Site Total Precipitation DFN (Departure Climate Site Maximum Daily Precip (in inches) Max P Date *Indicates a daily record was set June 11th Northwest Georgia June 11th: A line of strong to severe thunderstorms pushed down from the northeast out of Tennessee. The environment it entered allowed it to transition from sub-severe to severe with over 2000 J/KG of MLCAPE and a low level jet of 25-30kts. This allowed the line segment to come together to form a strong bowing line that produced winds exceeding 60mph. Numerous trees and powerlines were reported down across the state as the line moved through with the highest concentration being in NW Georgia. June 14th Southwest Georgia June 14th: A rare summertime setup that brought nearly 50kts of deep layer sheer along a front that moved out of the NW into Alabama and Georgia created an environment with 100-200 m2/s2 of effective SRH combined with 2000+ J/KG of MLCAPE and dewpoints in the 70s were more than enough to create an outbreak of supercells with large hail and tornadoes across the southeast. While a majority of the the reports came from south of the CWA there was a report of hail exceeding two inches in Macon as well as plenty of reports of trees and powerlines down. June 25th North and Central Georgia June 25th: A complex MCS with a history of damaging wind gusts moved into northern Georgia on the afternoon of the 25th. Low level lapse rates of 7° C/KM were enough to overcome the weak shear in the area and numerous reports of hail ranging from 1-2 inches came in as the system pushed deeper into Georgia. Damaging winds were also present with a number of reported powerlines and trees down as the leading edge of the main MCS bowed out across north and central Georgia. June 30th North and Western Georgia June 30th: A cluster of thunderstorms gradually increased in intensity across western Georgia over the afternoon. Strong daytime heating combined with dewpoints in the low 70s allowed MLCAPE values to rise to 1000-2000 J/KG. While the shear was minimal for the day, steep low-level lapse rates resulted in strong localized wind gusts that resulted in multiple trees and powerlines down along the Georgia/Alabama border. Based on the Climate Prediction Center's outlook for July, Georgia has a 40% to 50% chance for above normal temperatures. For precipitation, central Georgia has an equal chance for above or below normal precipitation, while northern Georgia has a 33%-40% chance for above normal precipitation. Data prepared by NWS Peachtree City/Atlanta
Overview
Climate Graphics
Records
Events
July Outlook
Below are the overview stats for June 2023 for our 10 climate sites.
June 2023 Climate Averages
Climate Site
June Temp (°F)
Average Temp
Departure from normal
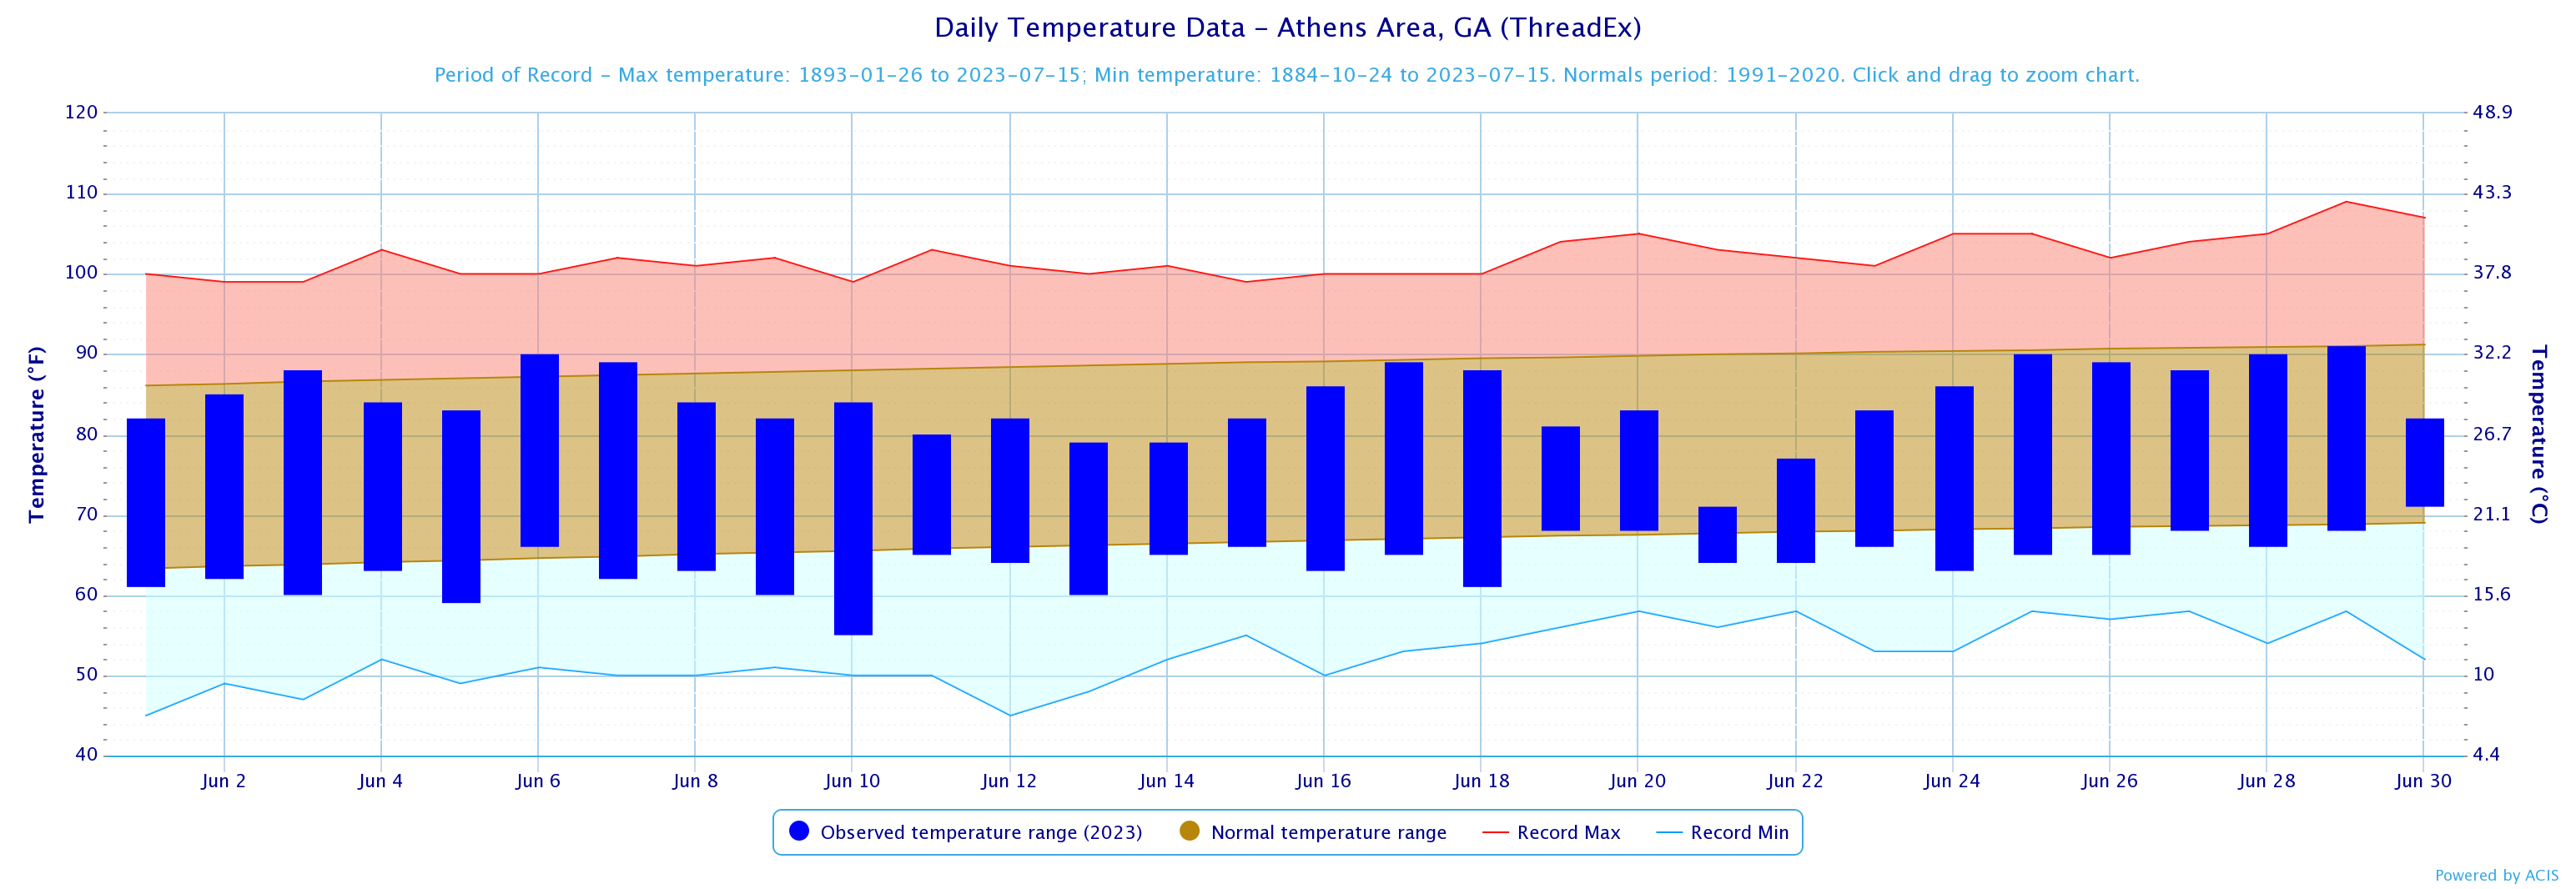
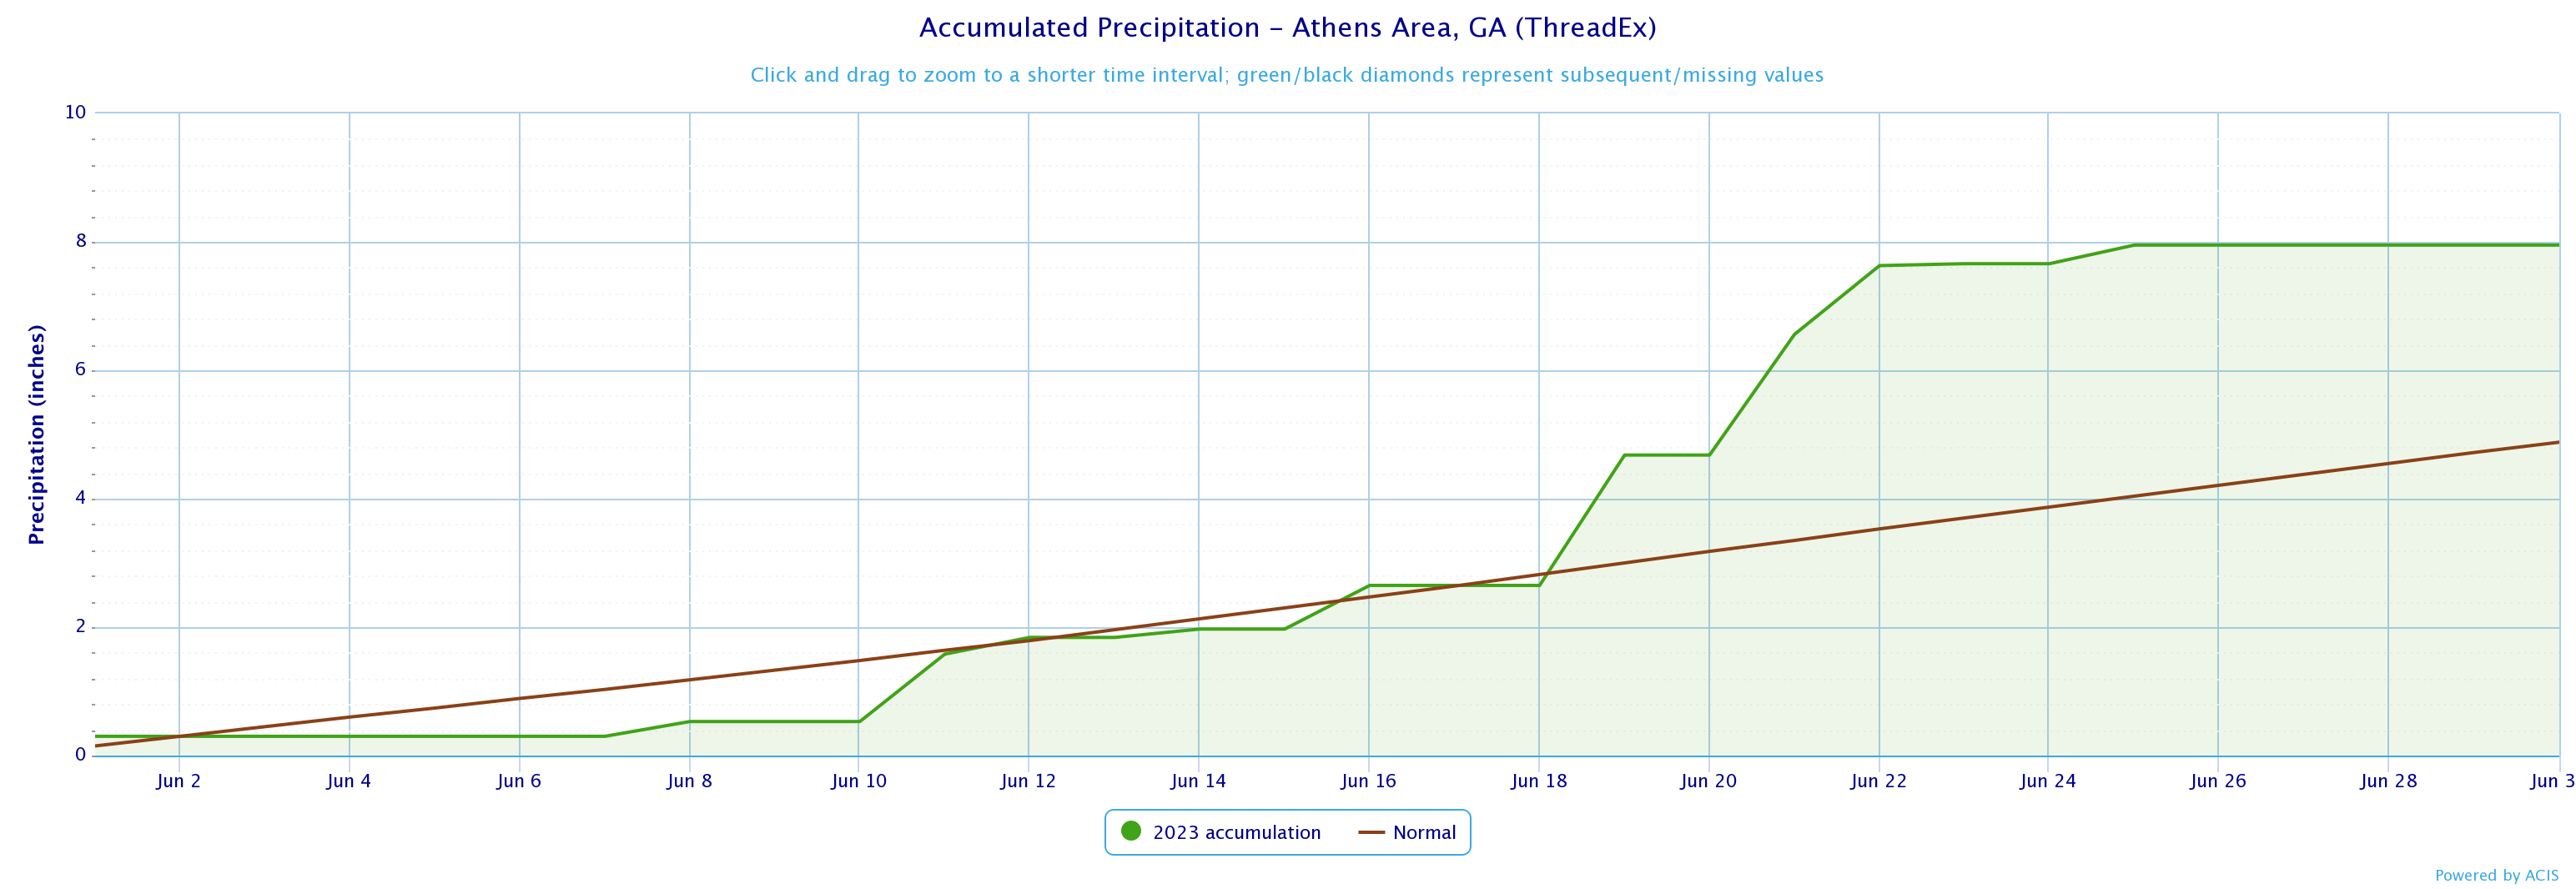
Athens
74.1
77.7
-3.6
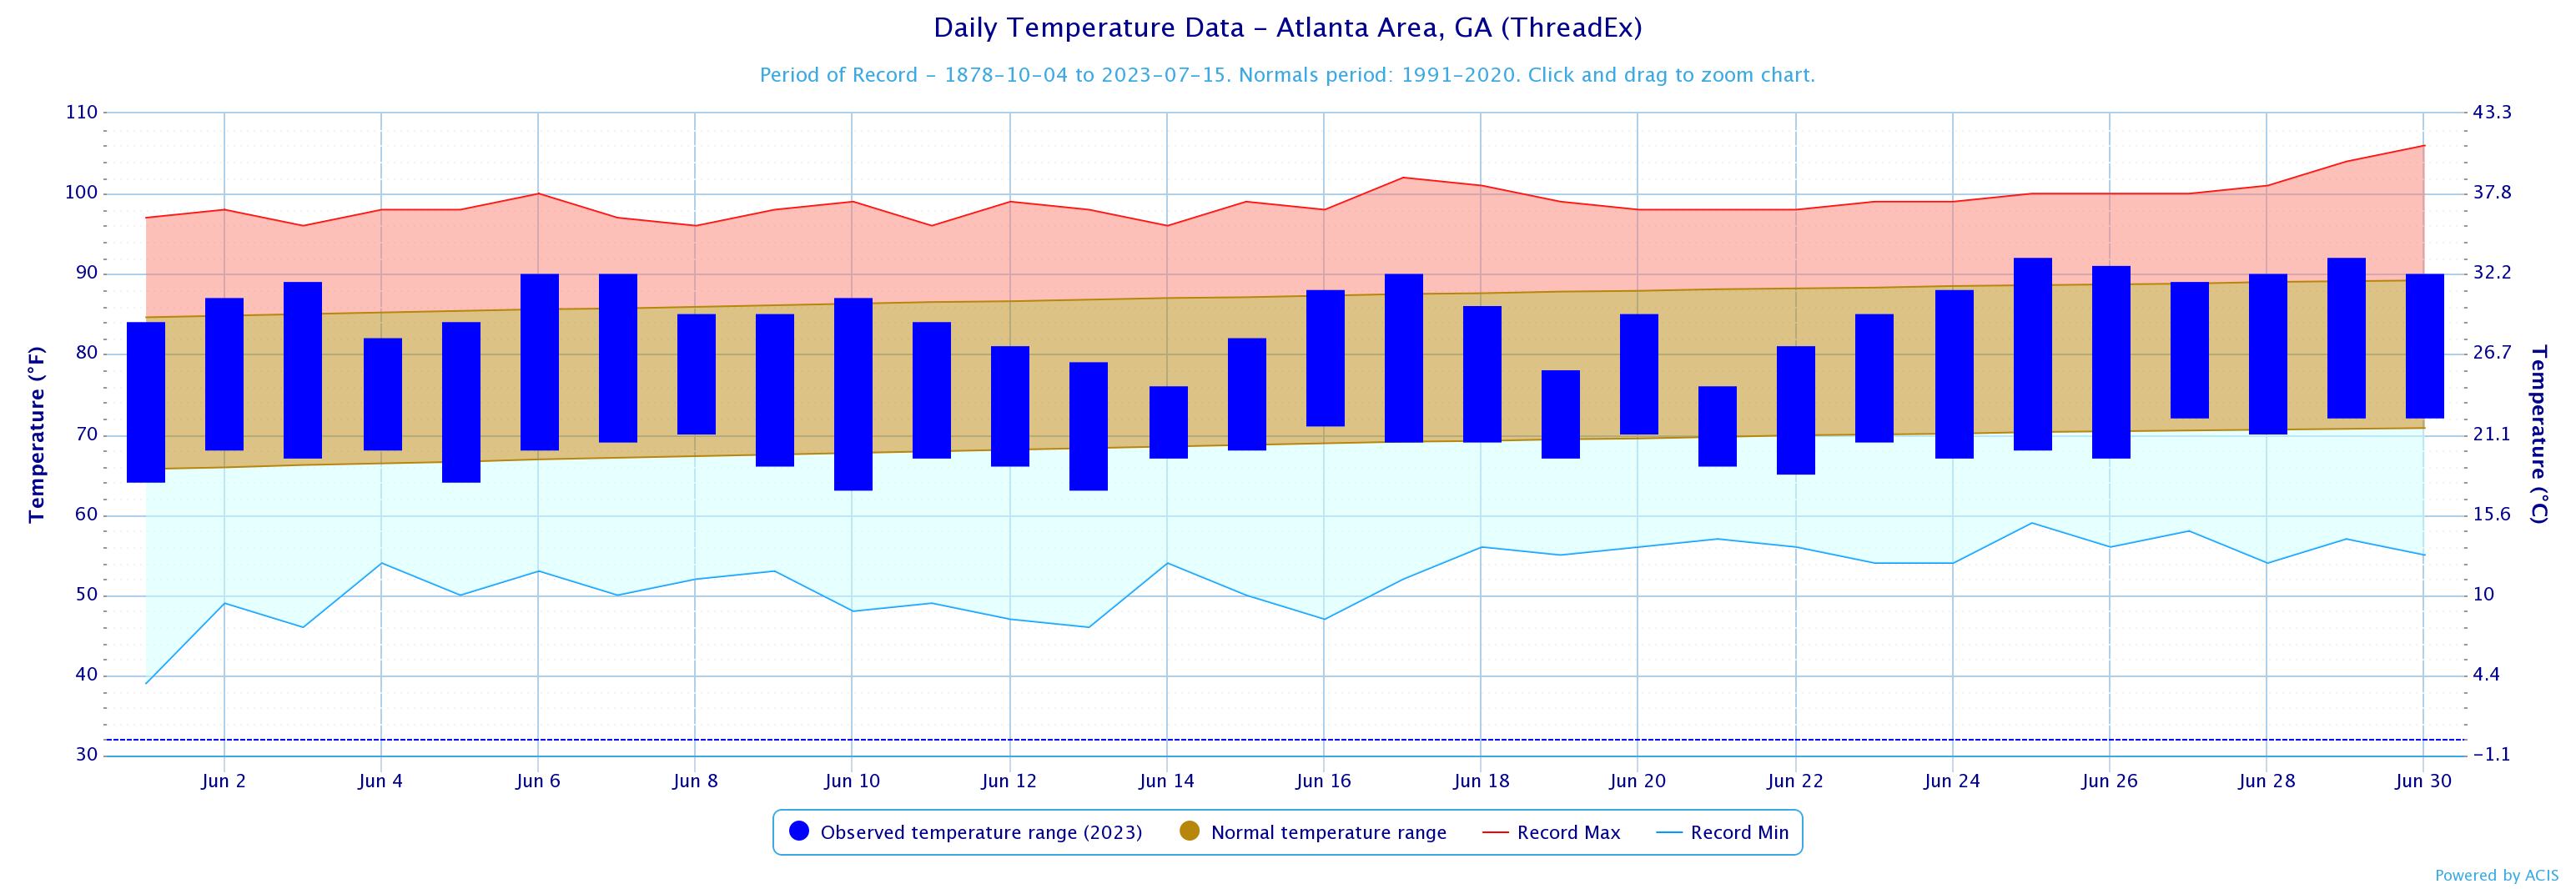
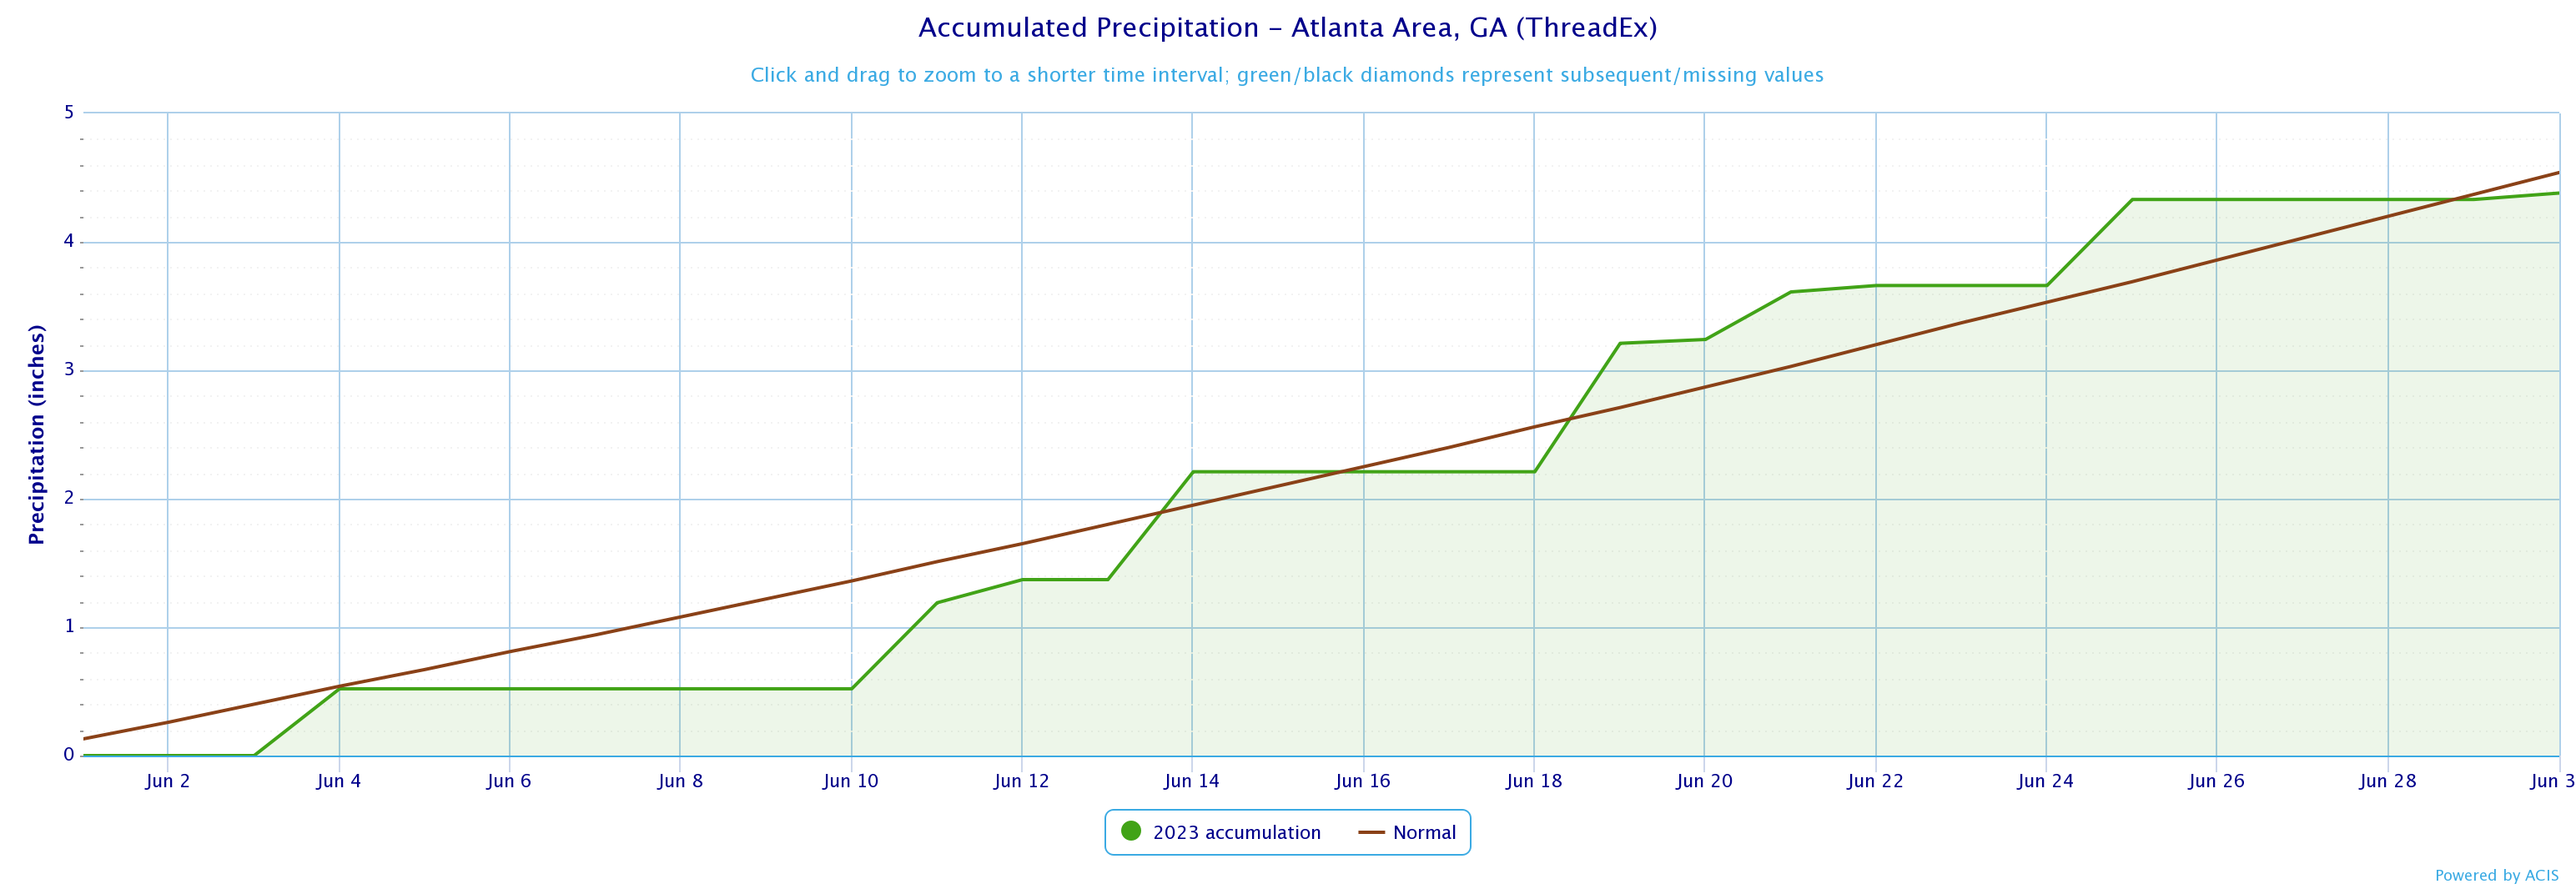
Atlanta
76.6
77.9
-1.3
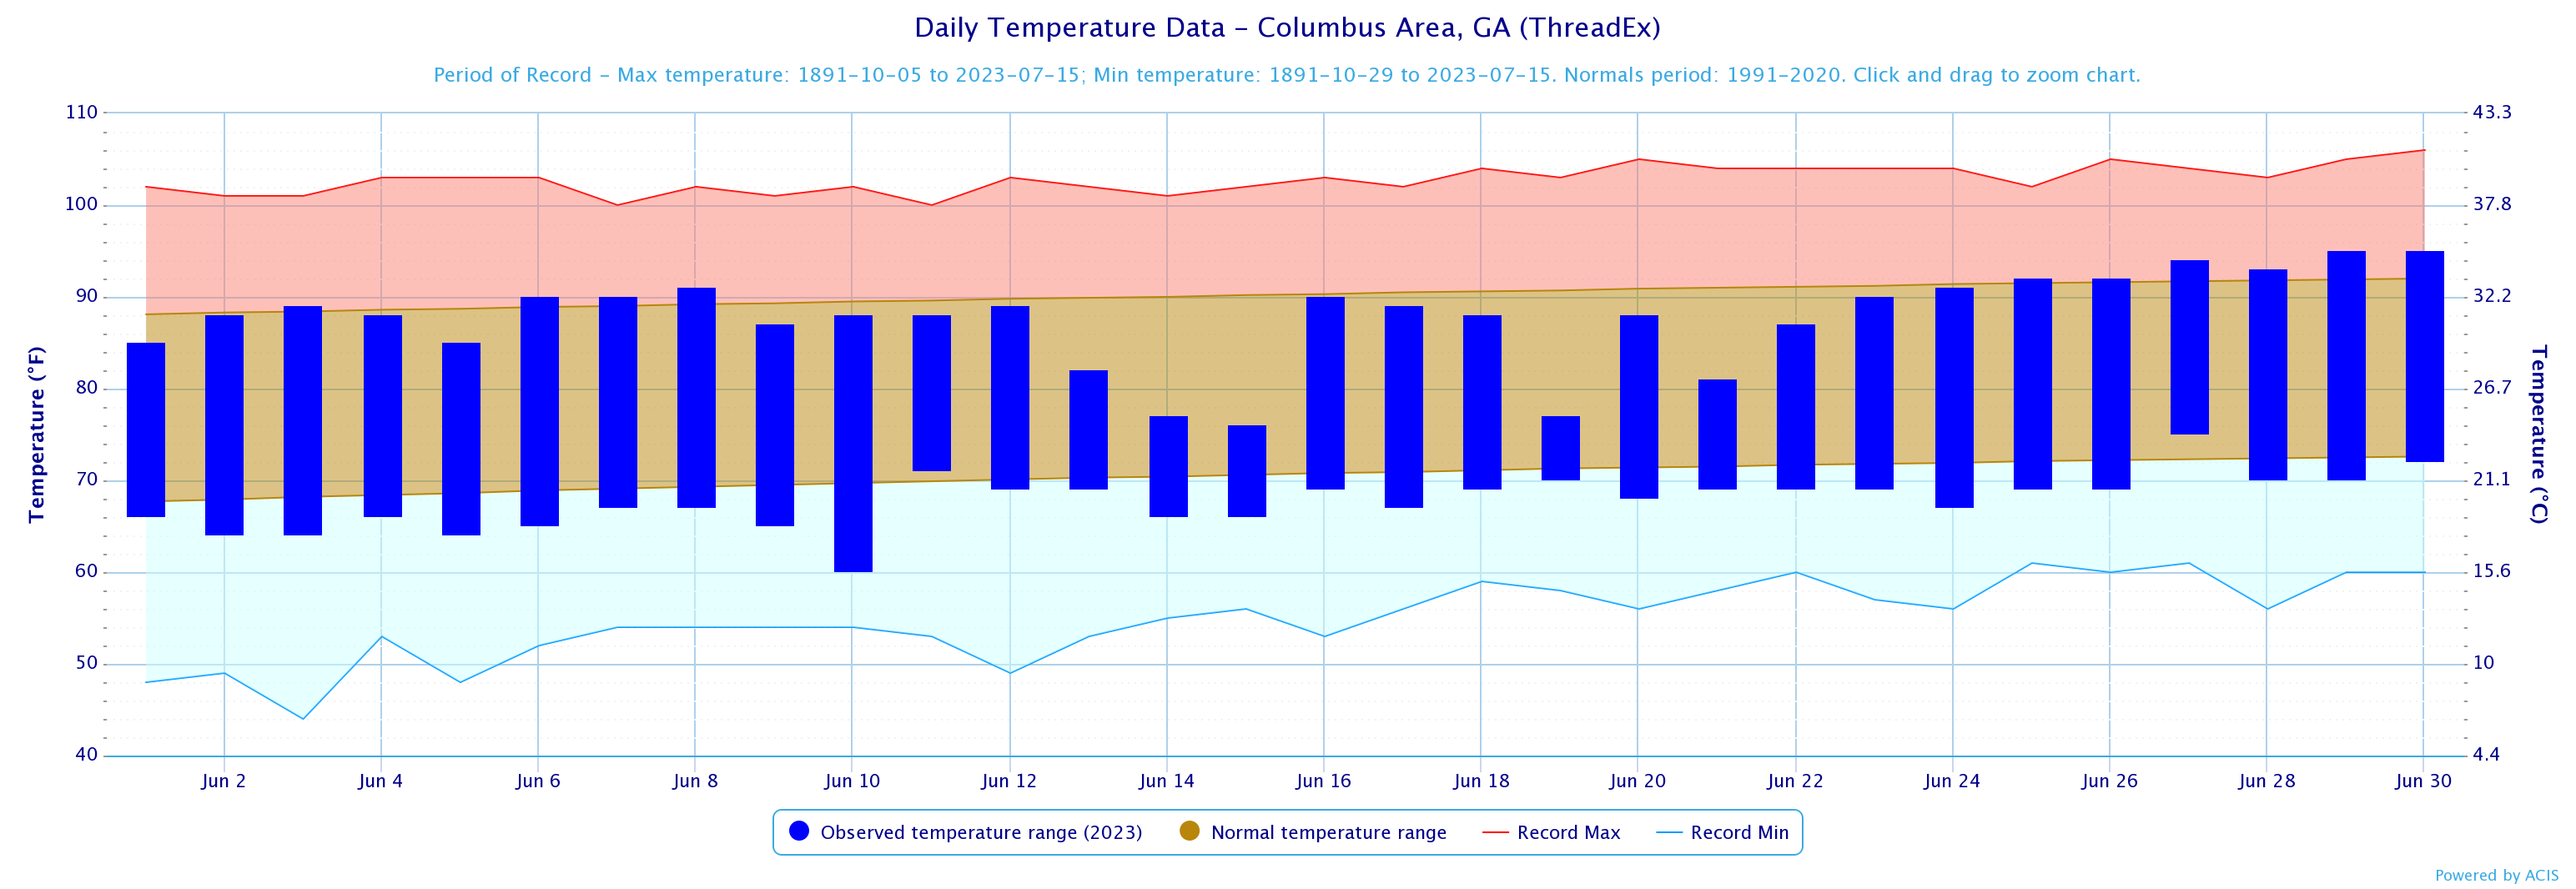
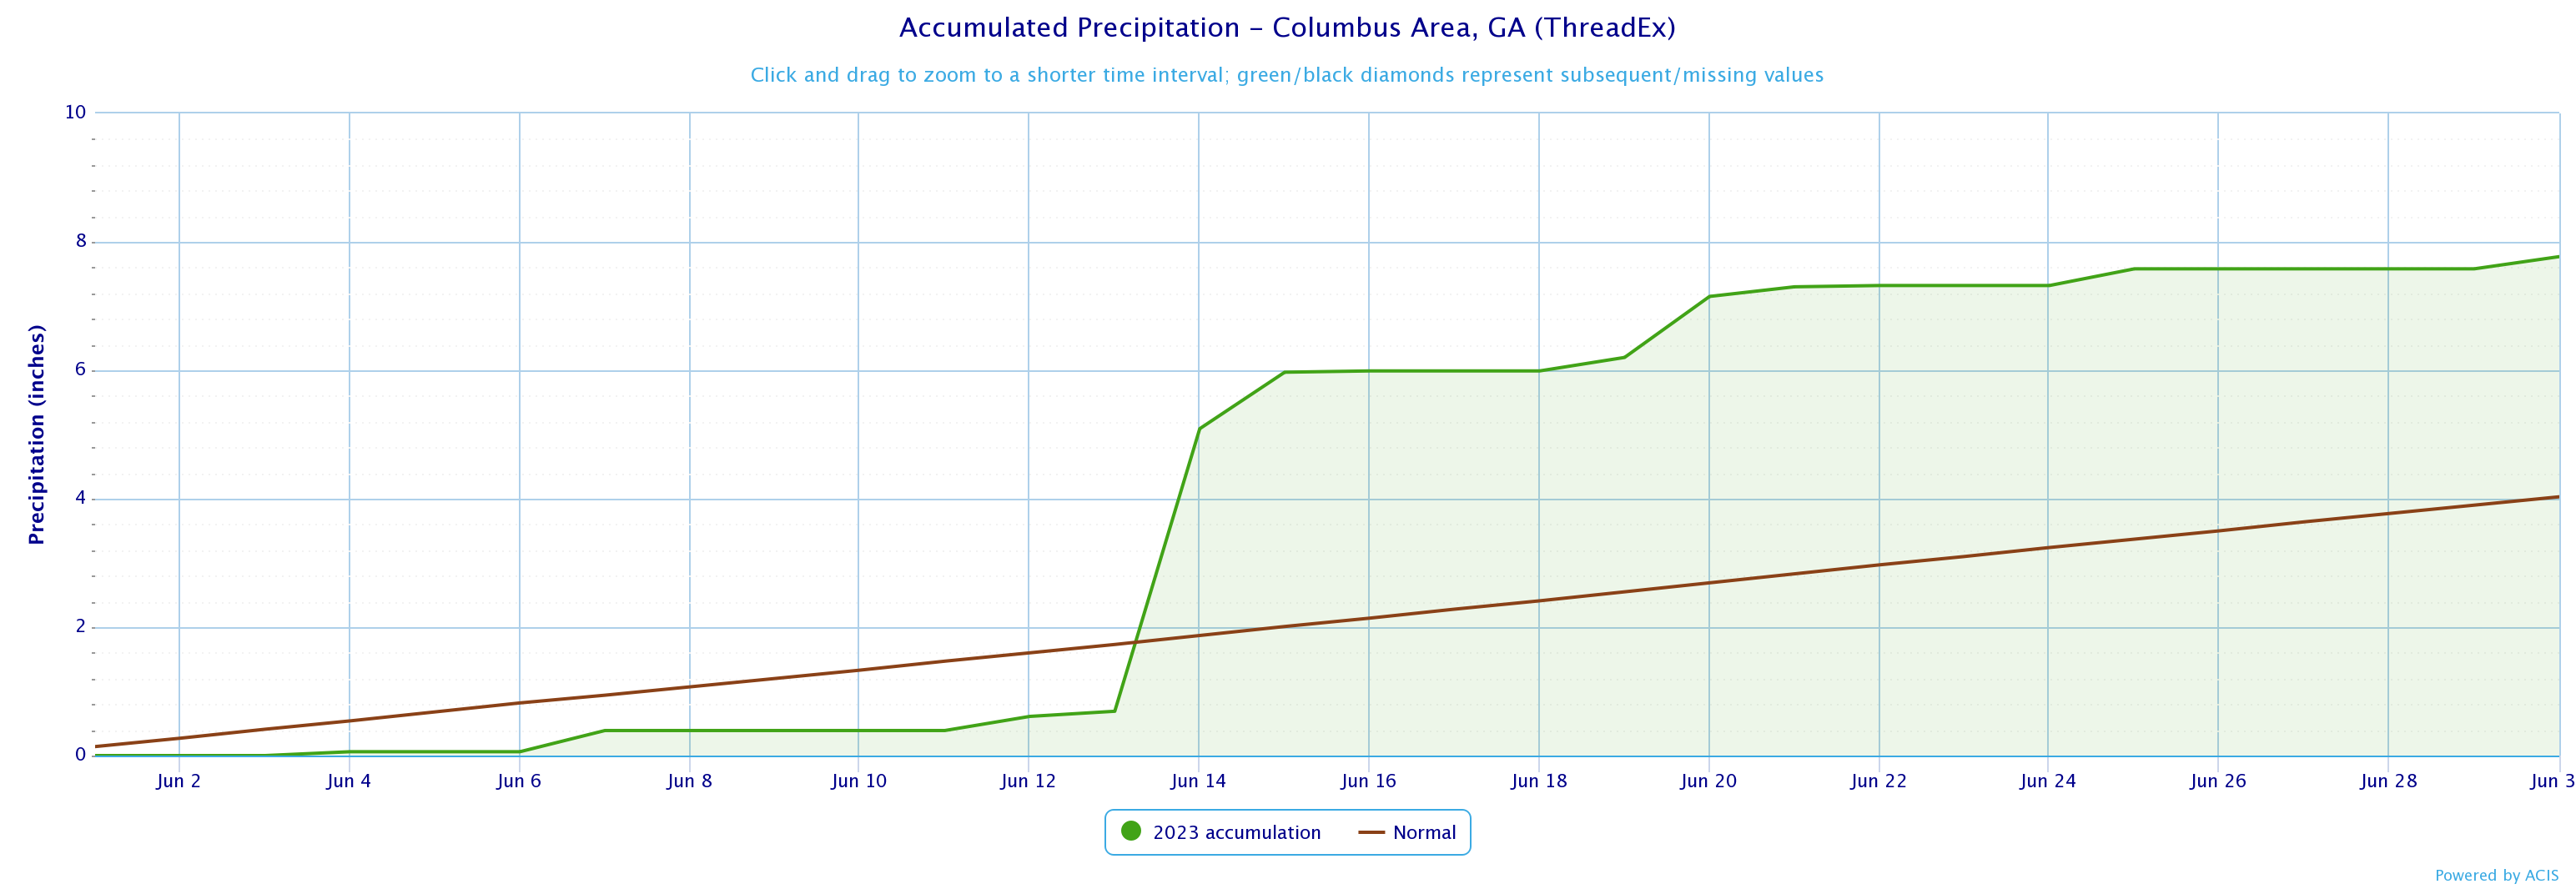
Columbus
77.8
80.5
-2.7
Macon
77.1
79.5
-2.4
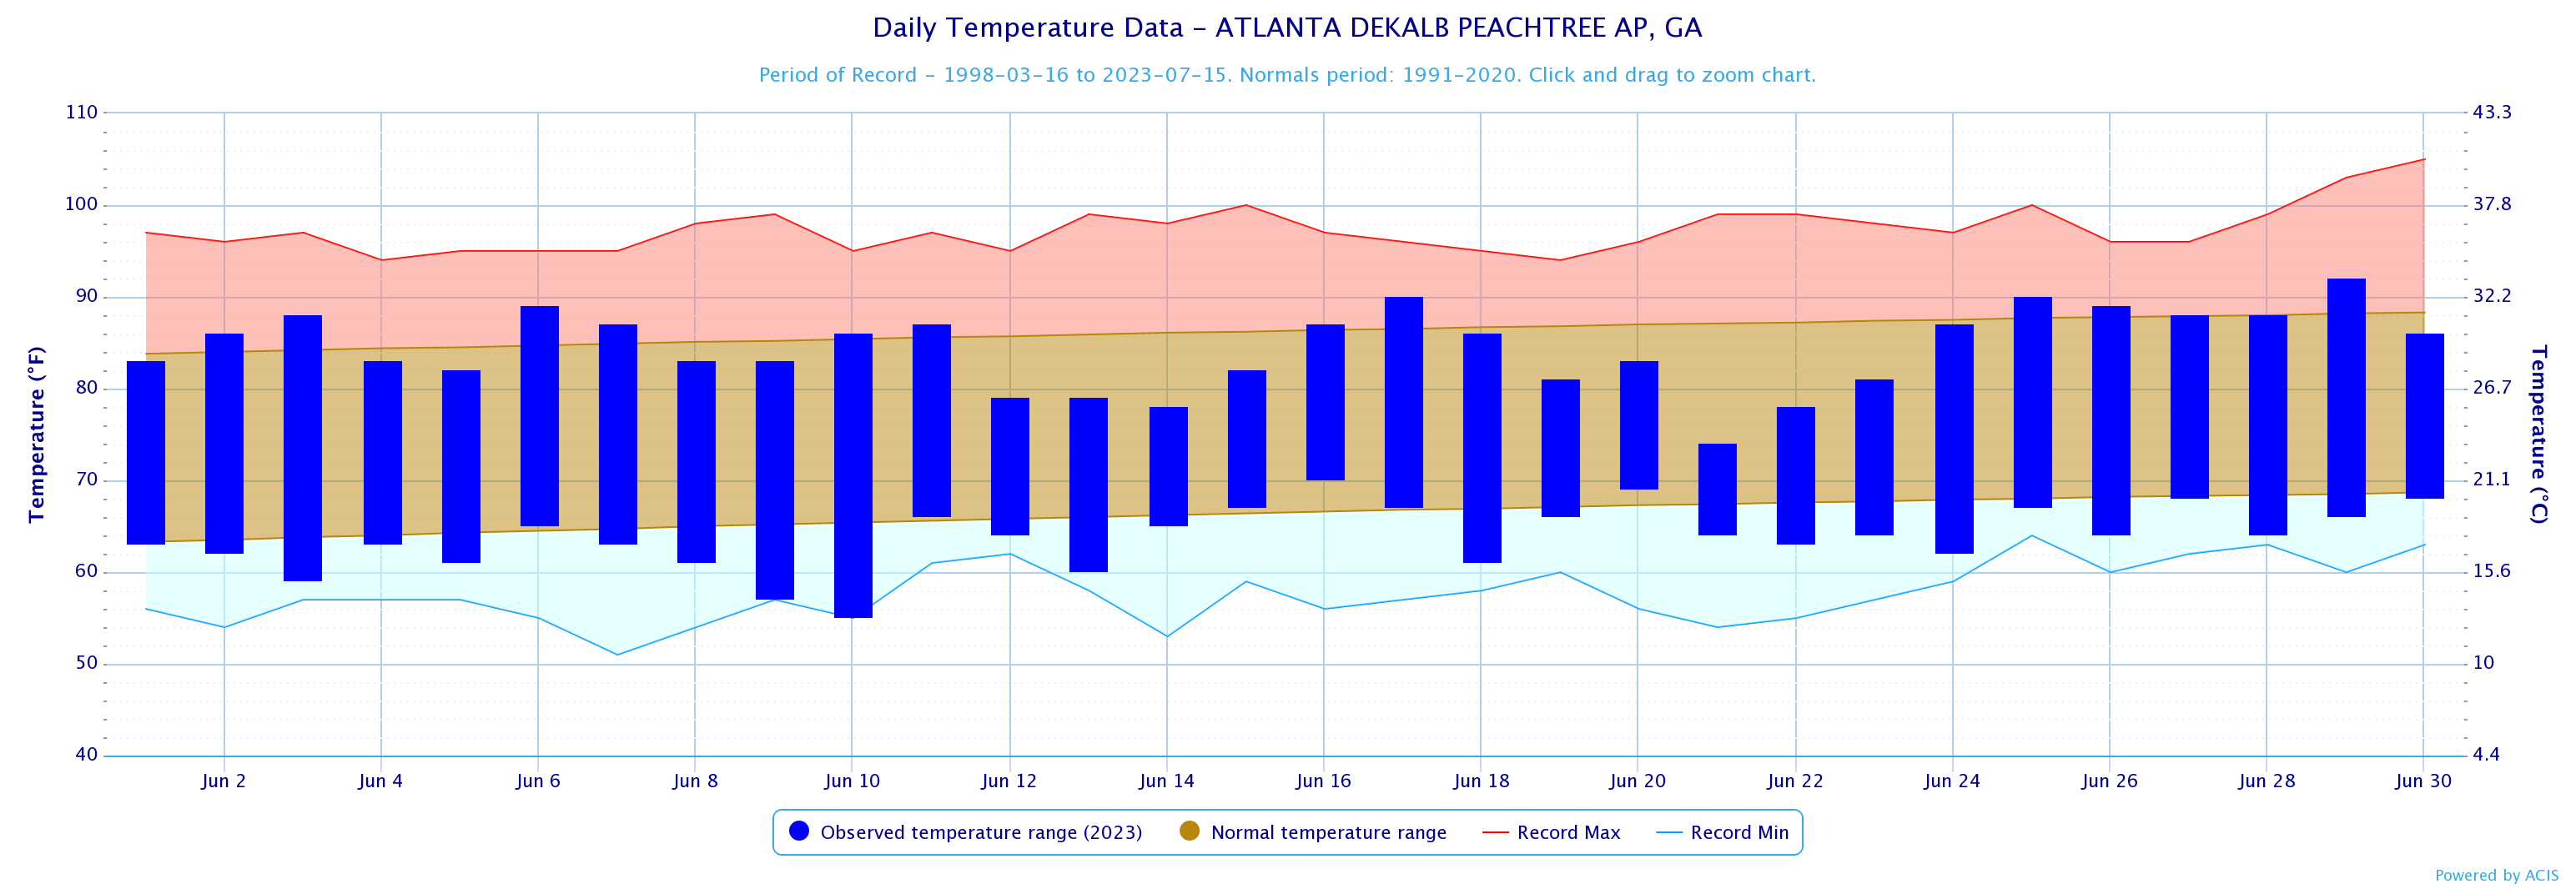
Dekalb Peachtree Arpt
74.2
76.2
-2.0
Fulton Co Arpt
74.4
76.9
-2.5
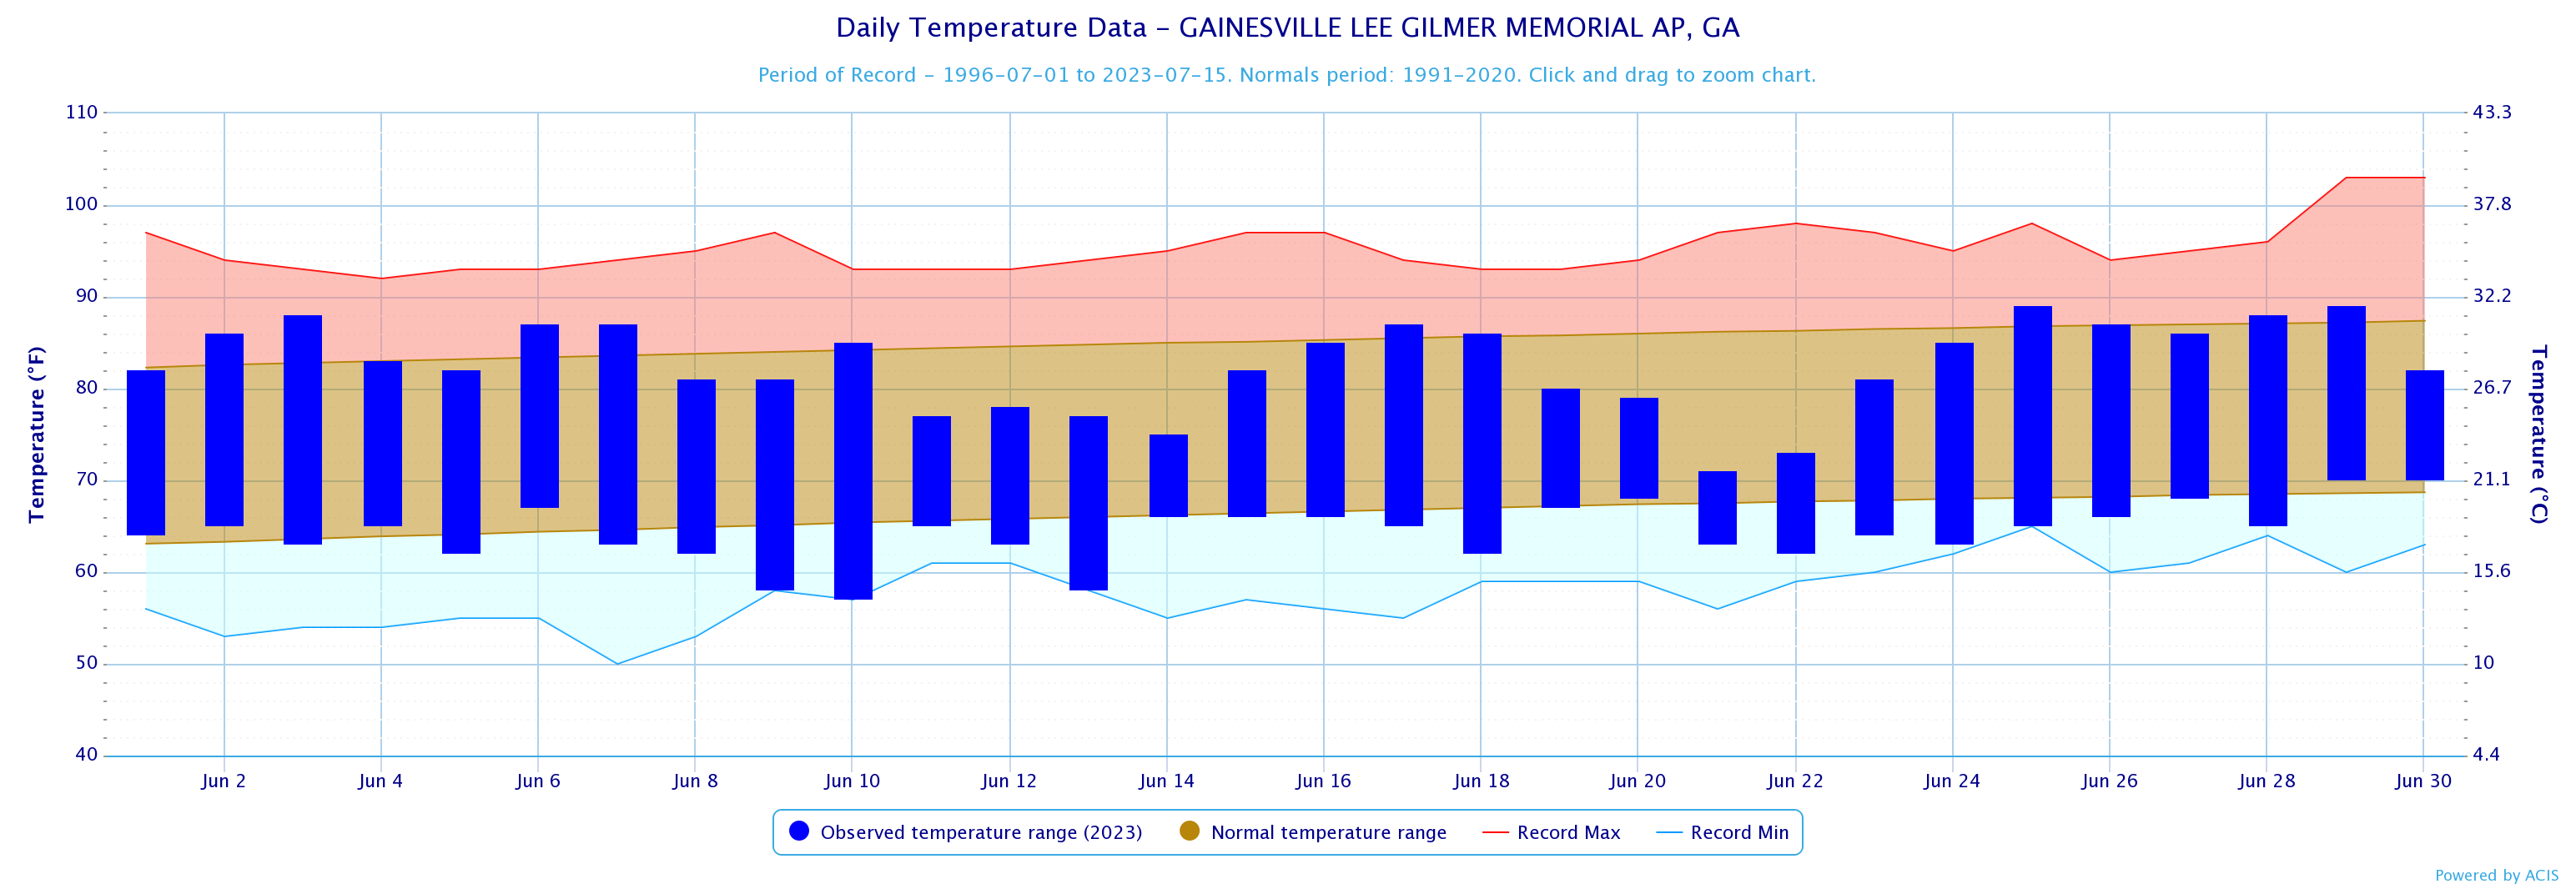
Gainesville
73.5
75.7
-2.2
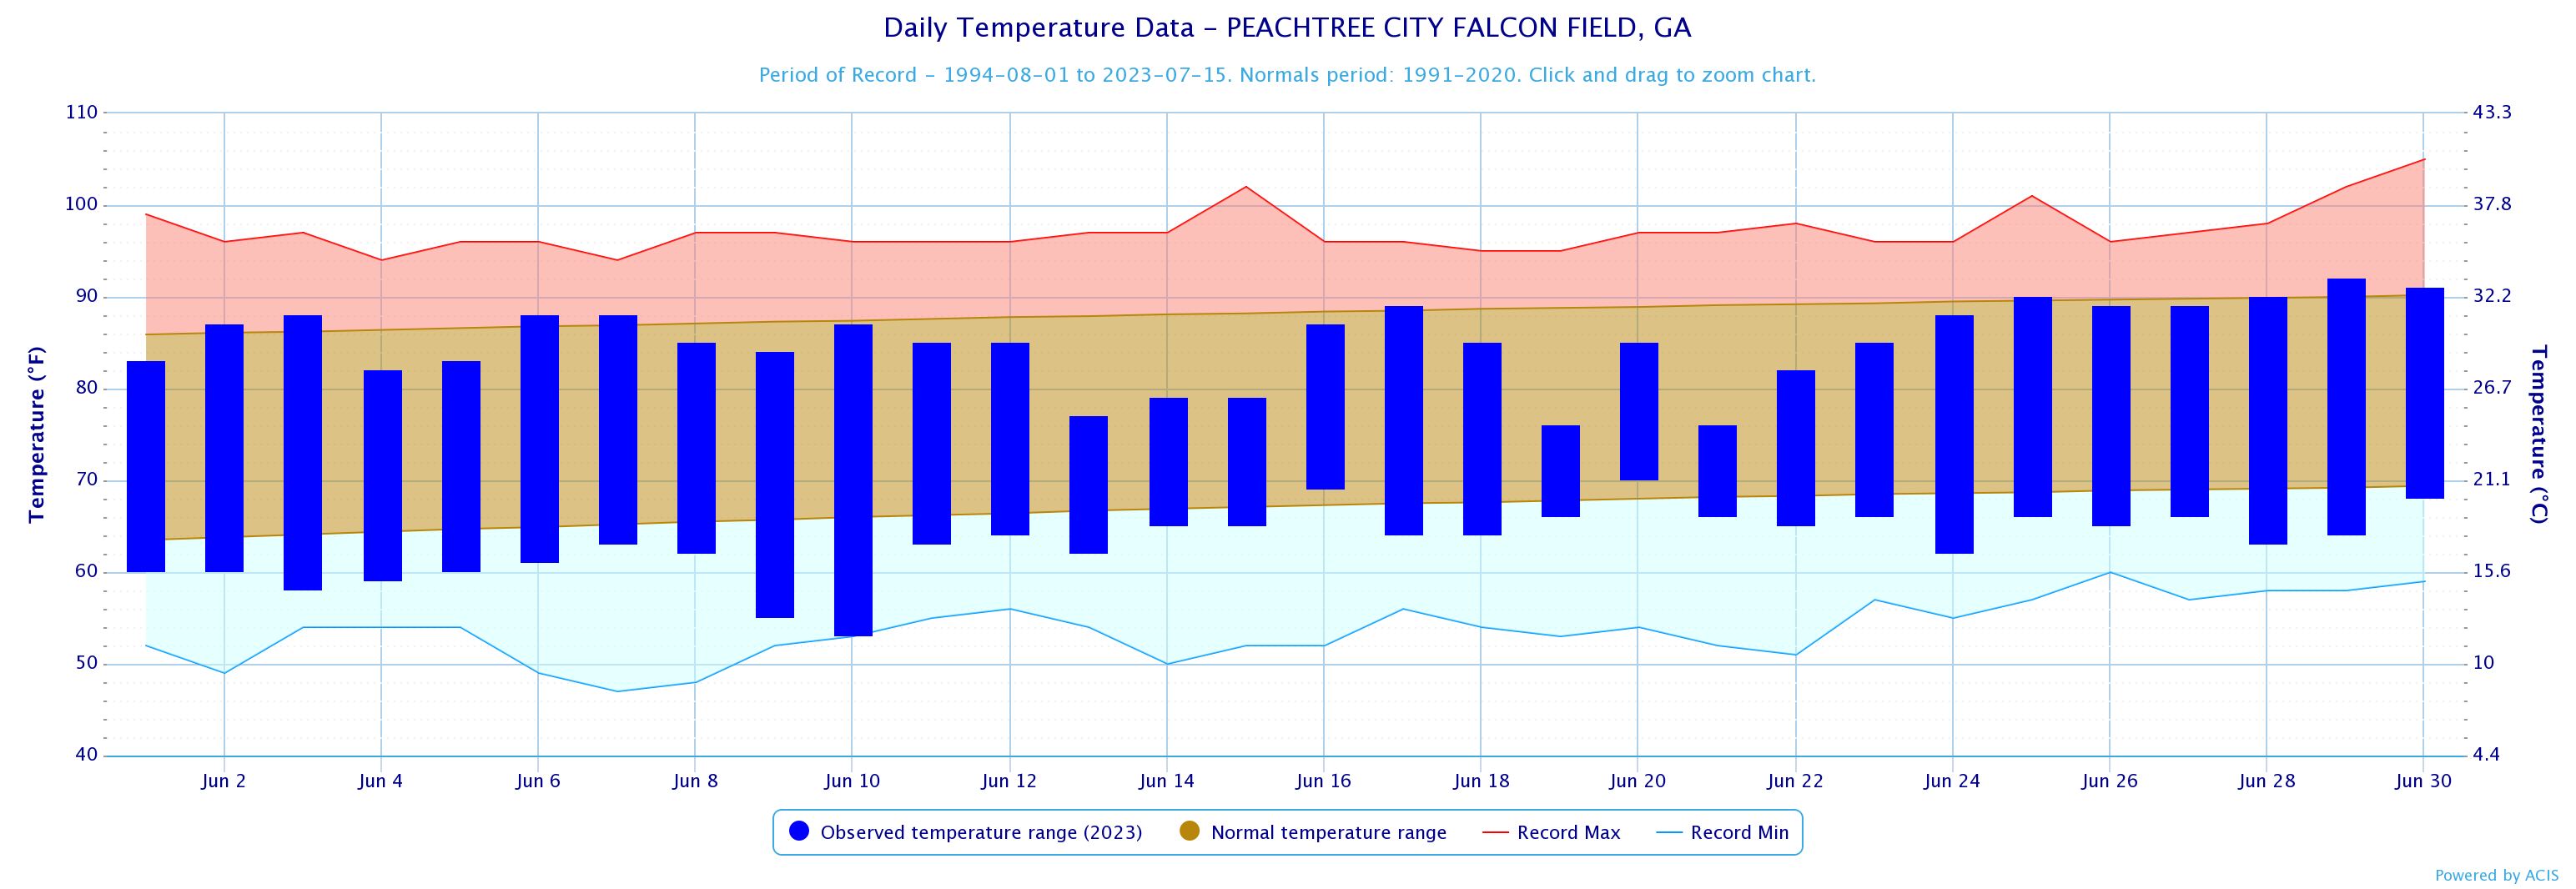
Peachtree City
74.1
77.5
-3.4
Rome
75.5
77.5
-2.0
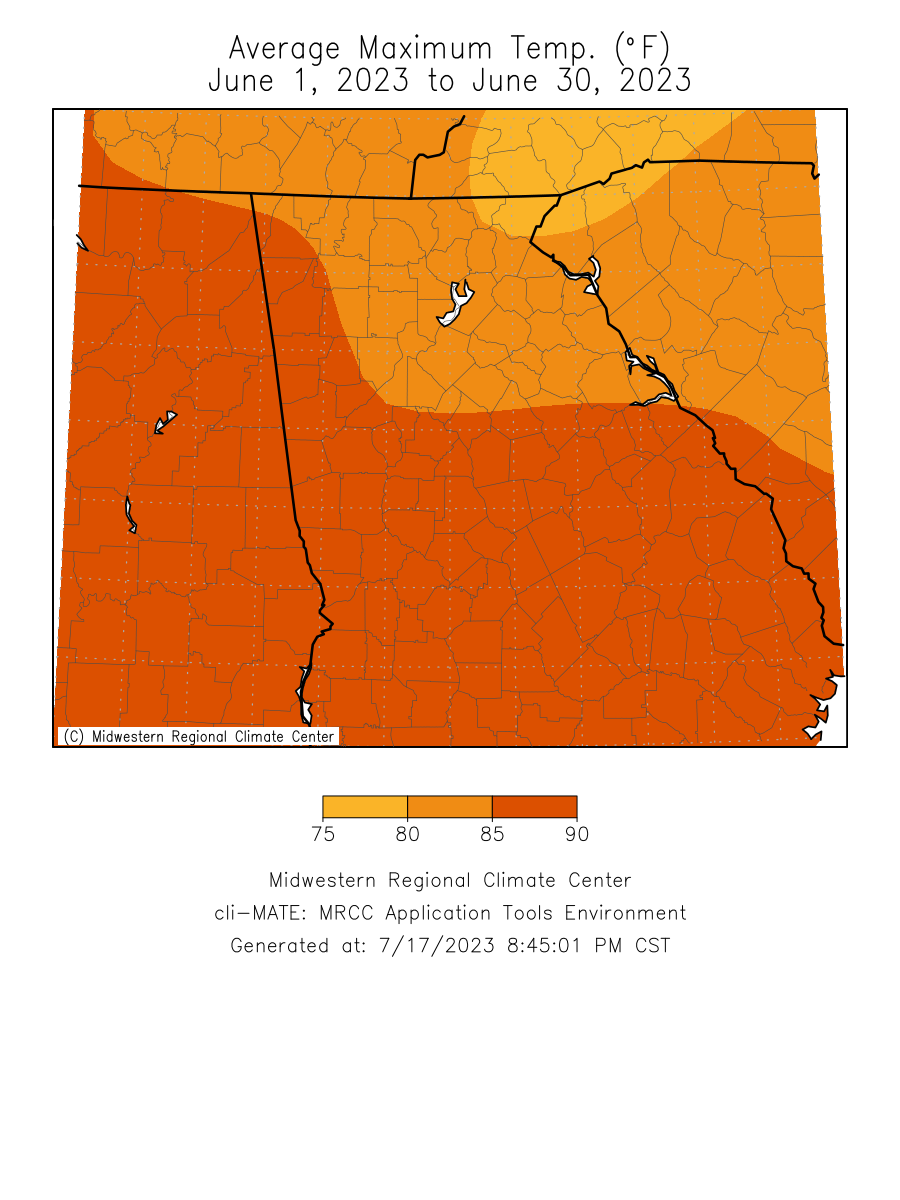
June 2023 Temperature Climate Statistics
Minimum Temperature
Min T Date
Athens
91
6/29
55
6/10
Atlanta
92
6/25, 29
63
6/10, 13
Columbus
95
6/29, 30
60
6/10
Macon
95
6/30
54
6/10
Dekalb Peachtree Arpt
92
6/29
55
6/10
Fulton Co Arpt
92
6/29
54
6/10
Gainesville
89
6/25, 29
57
6/10
Peachtree City
92
6/29
53
6/10
Rome
92
6/3, 6, 29
54
6/10
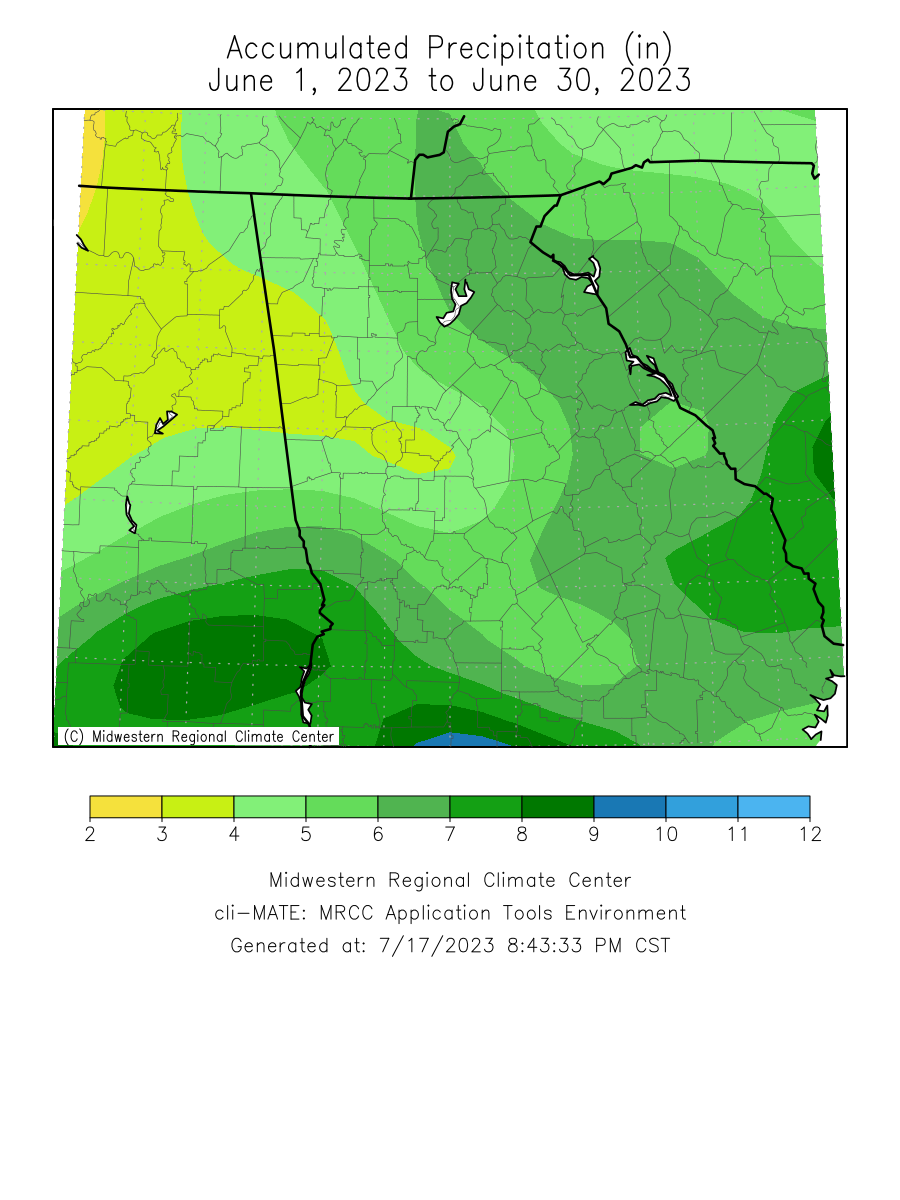
June 2023 Precipitation Climate Statistics
Average Precipitation
From Normal)
Athens
7.95
4.88
3.07
Atlanta
4.38
4.54
-0.16
Columbus
7.77
4.03
3.74
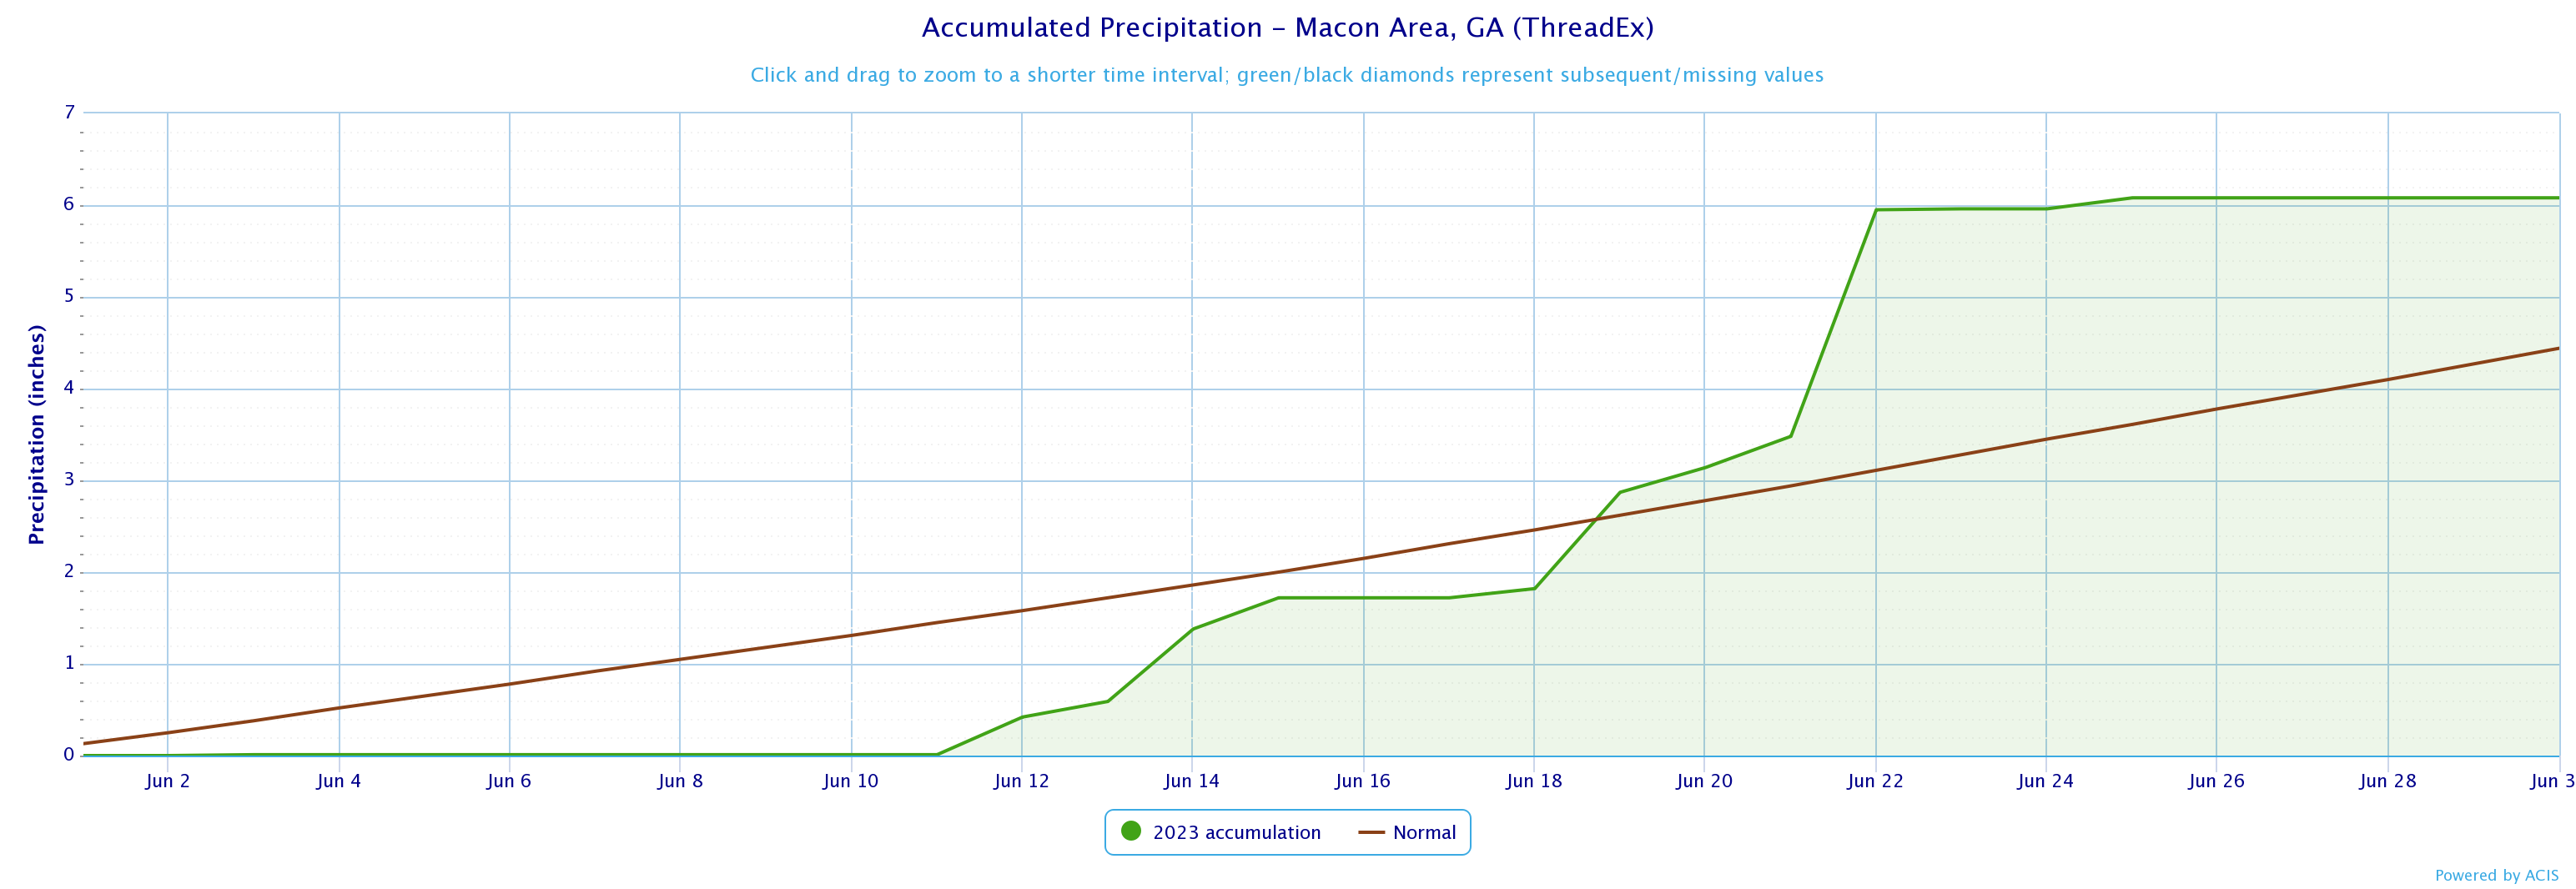
Macon
6.08
4.44
1.64
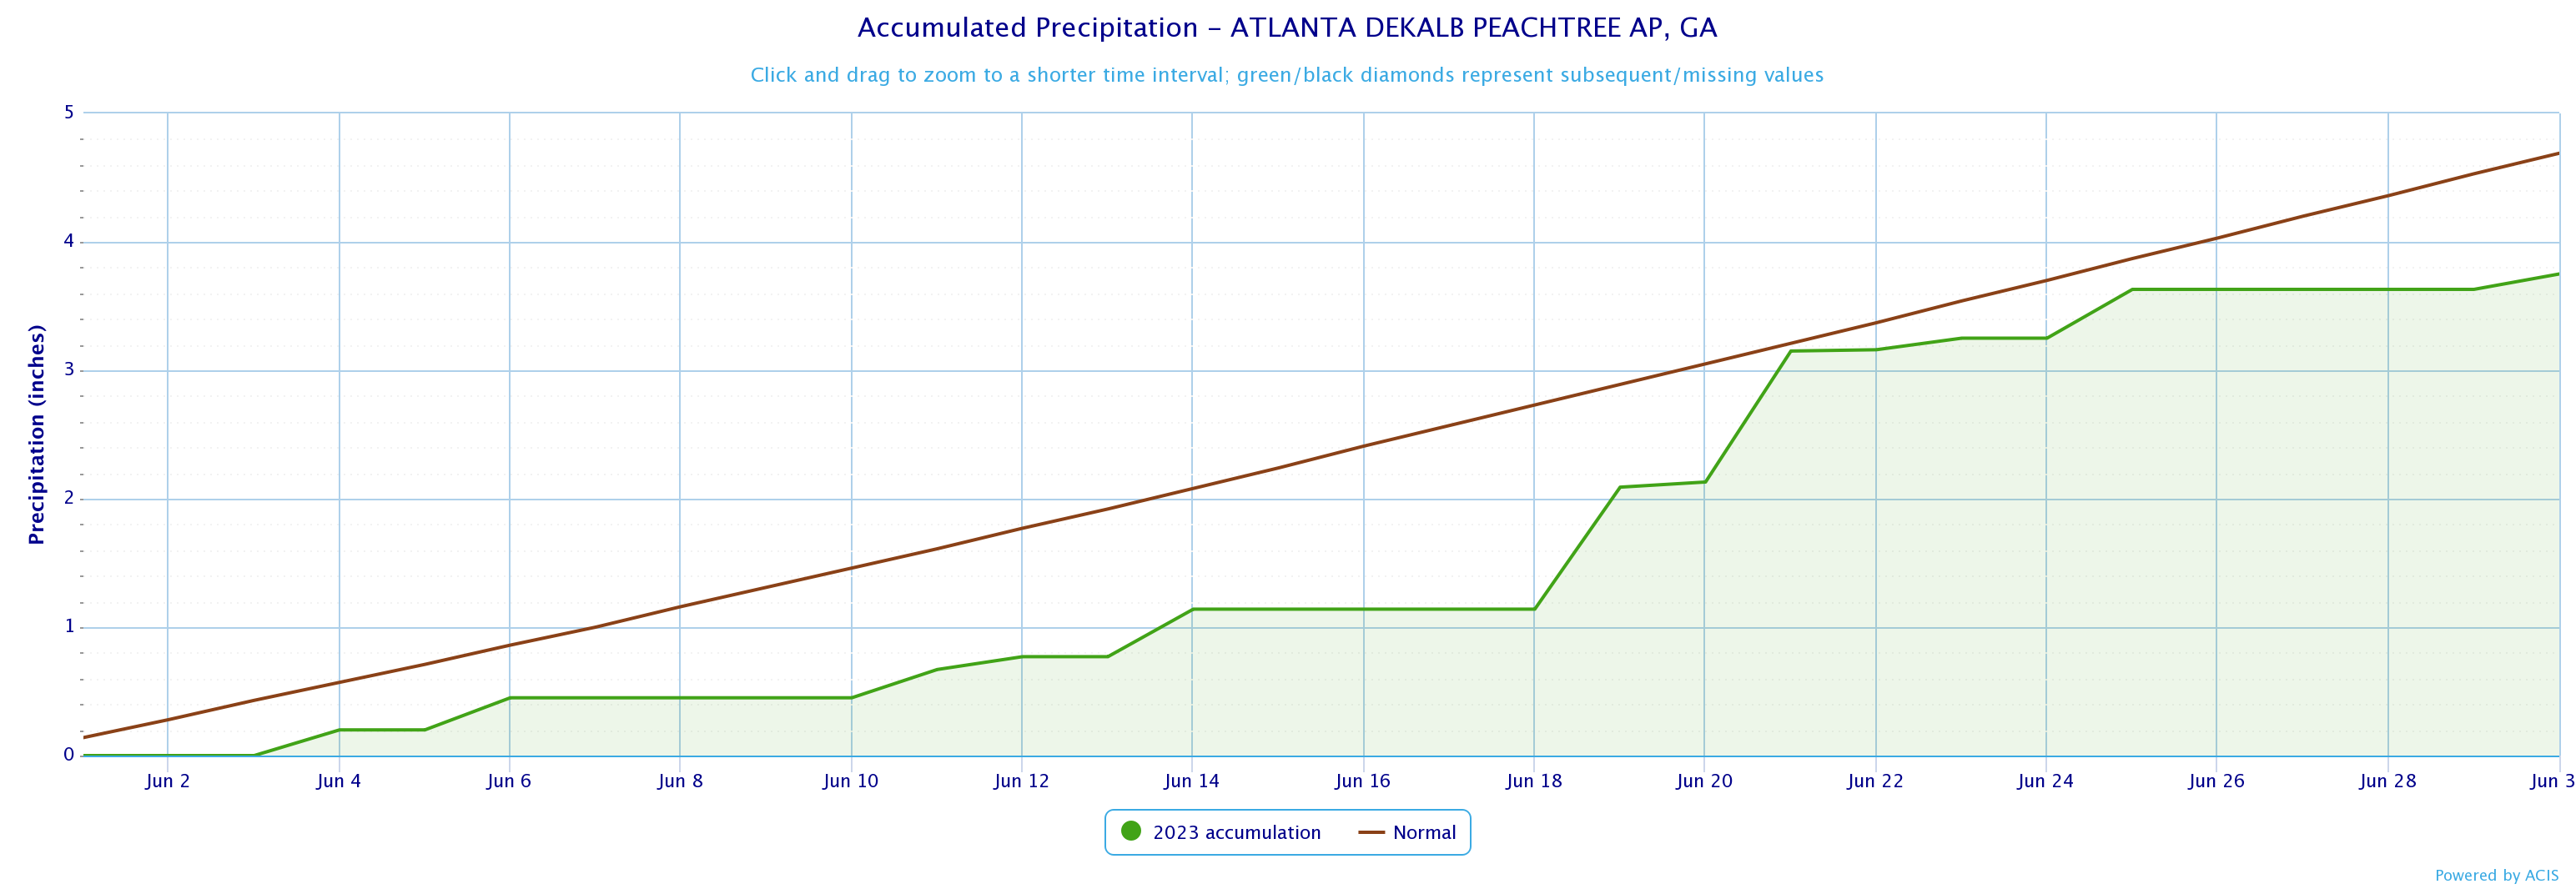
Dekalb Peachtree Arpt
3.75
4.69
-0.94
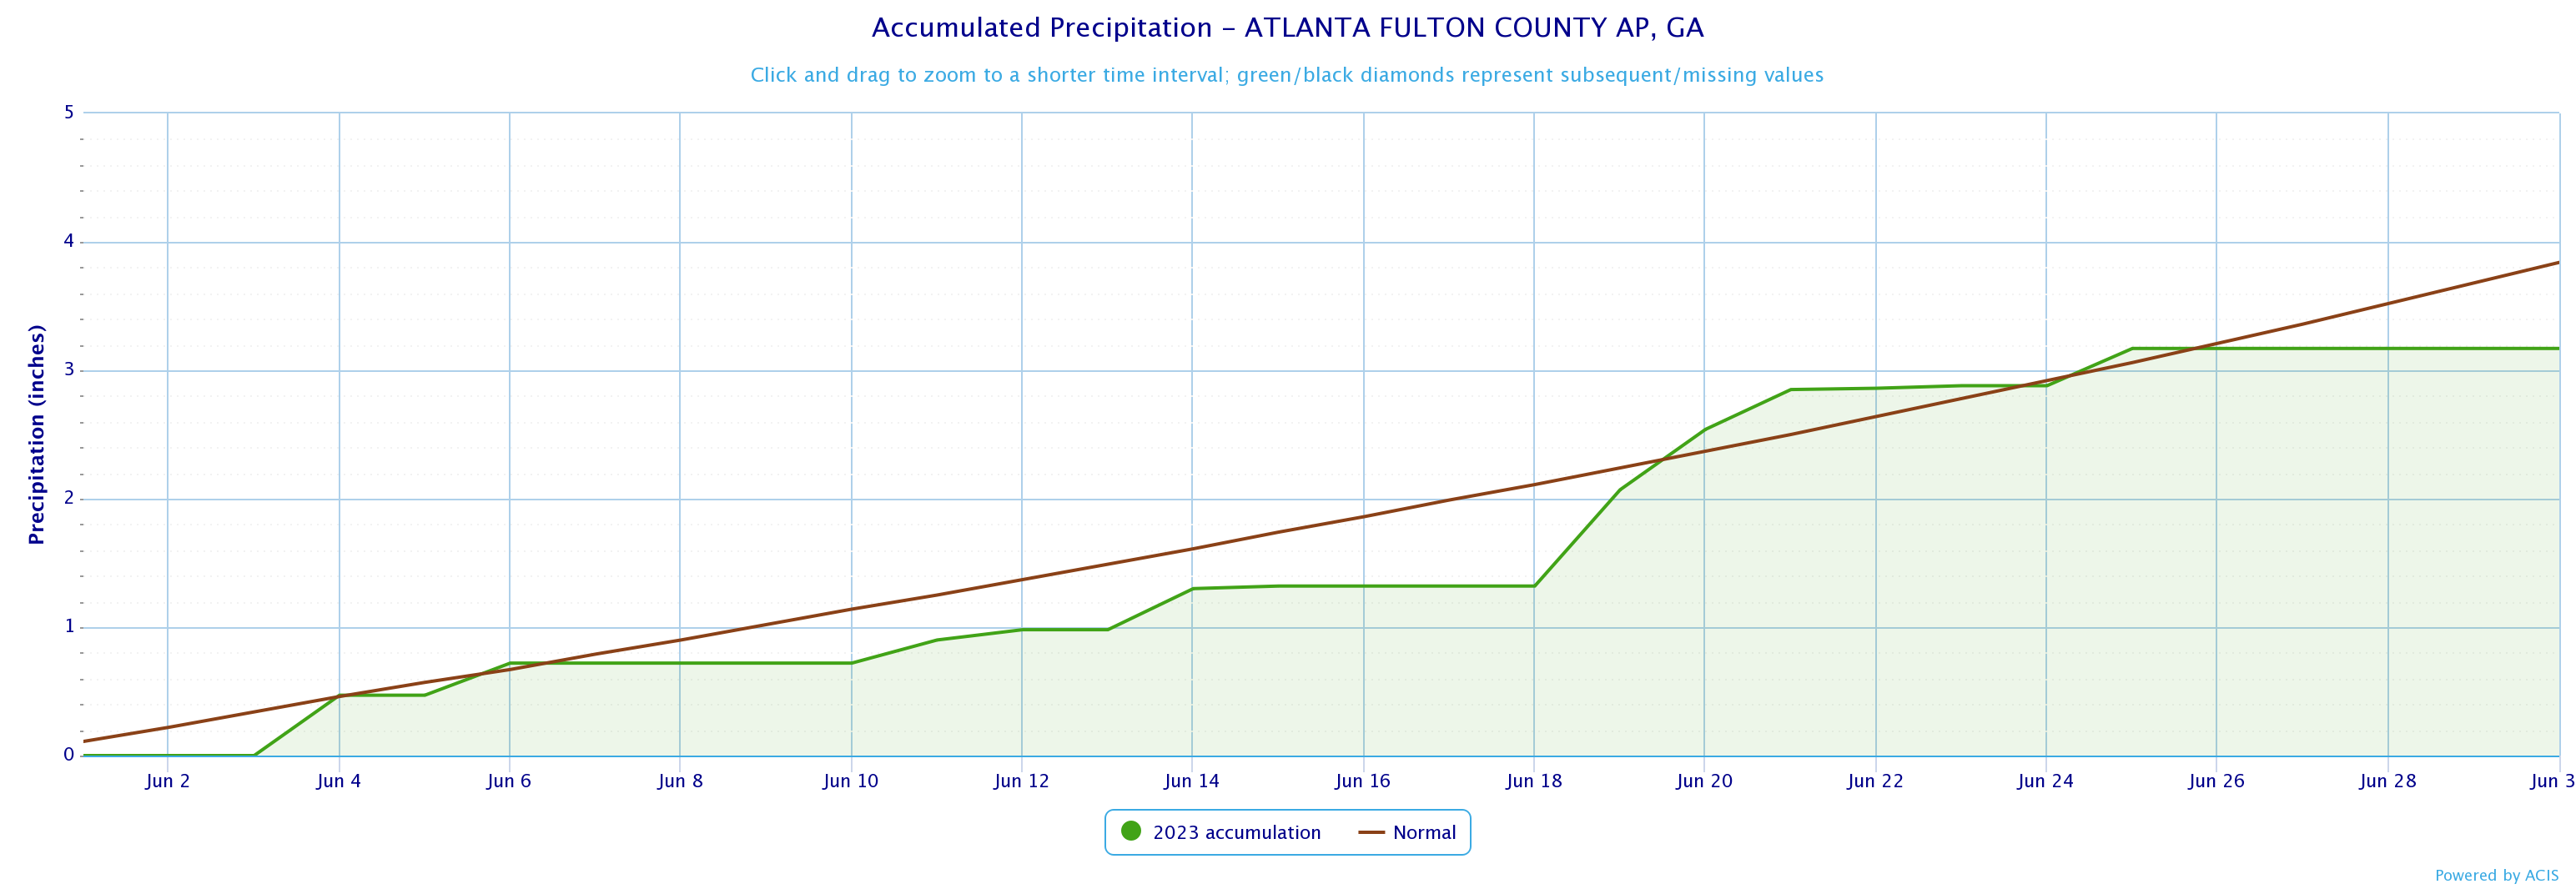
Fulton County Arpt
3.17
3.84
-0.67
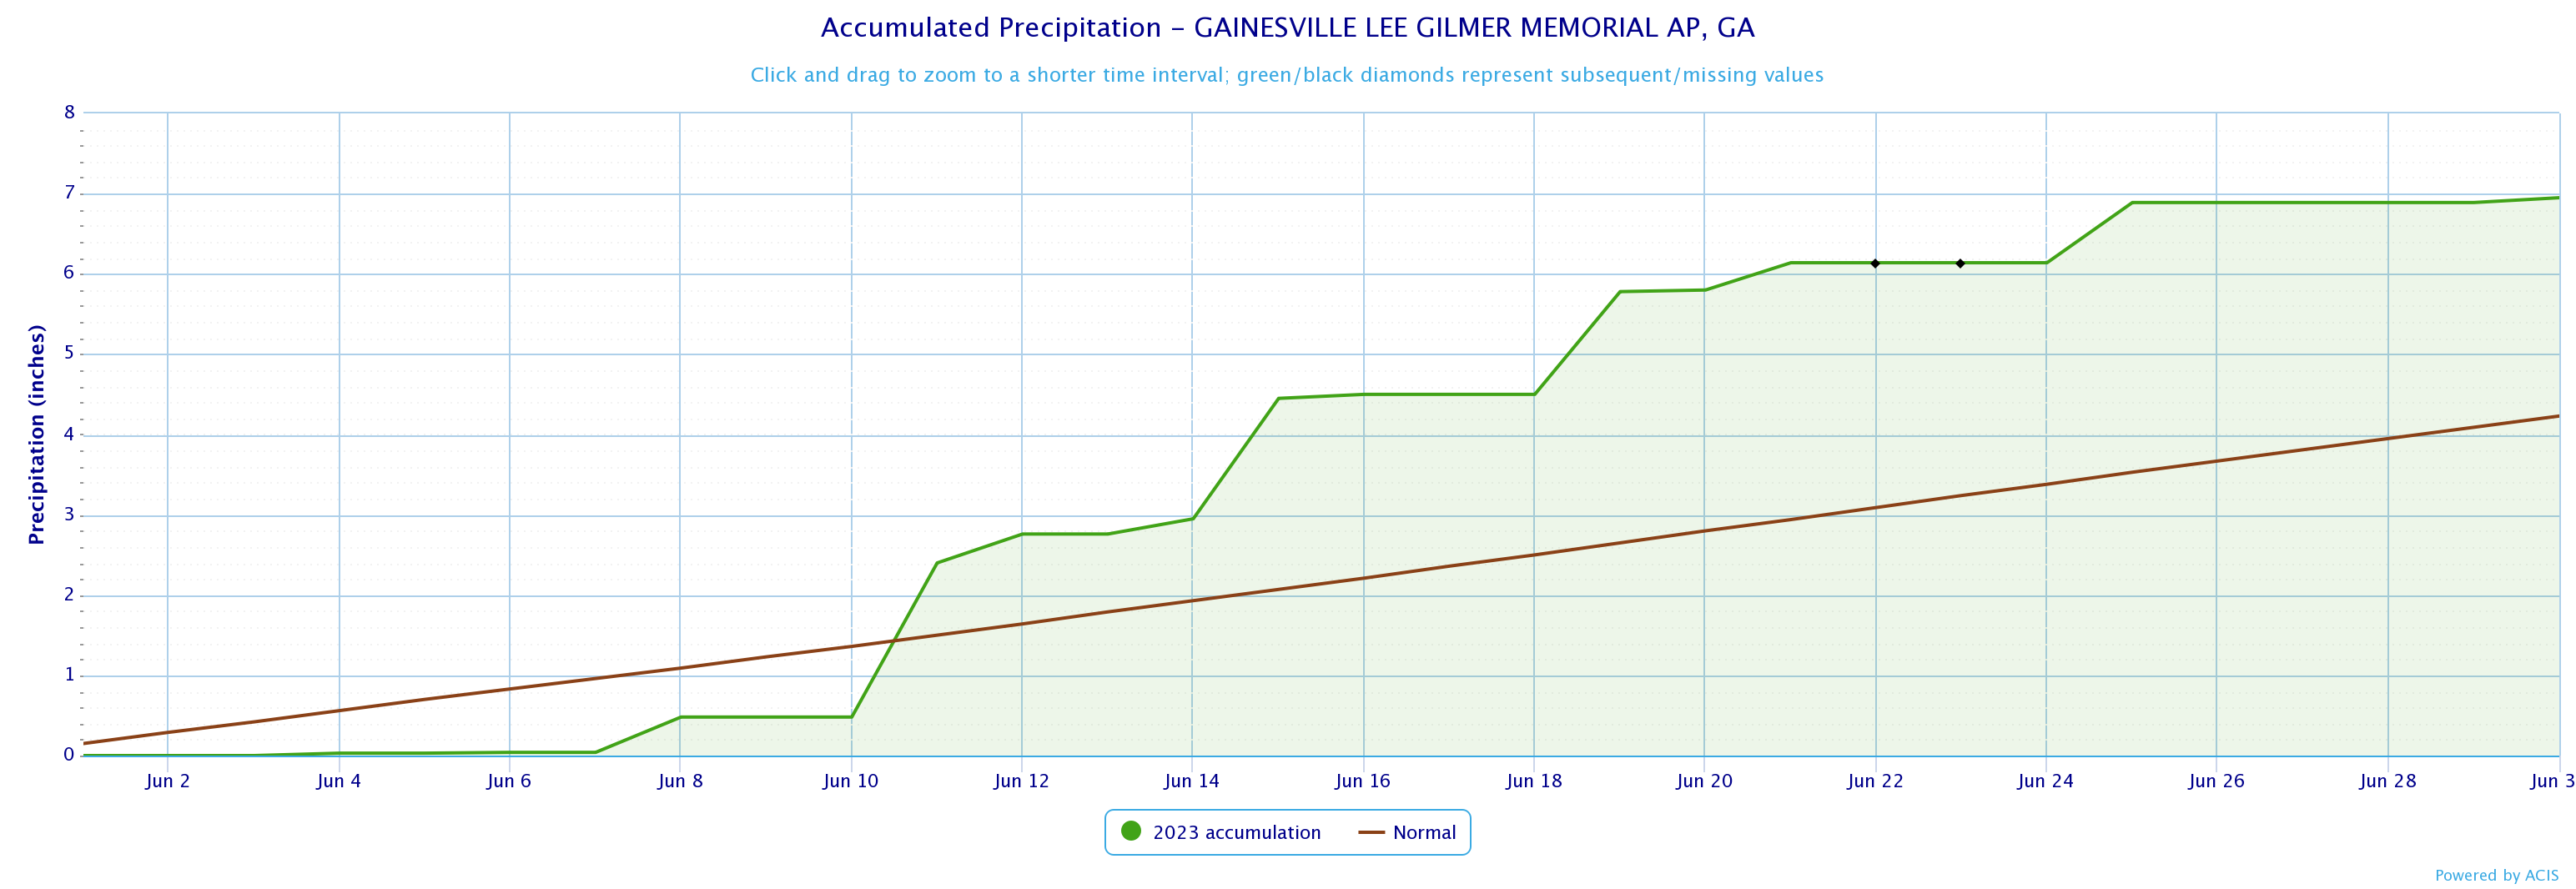
Gainesville
6.95
4.23
2.72
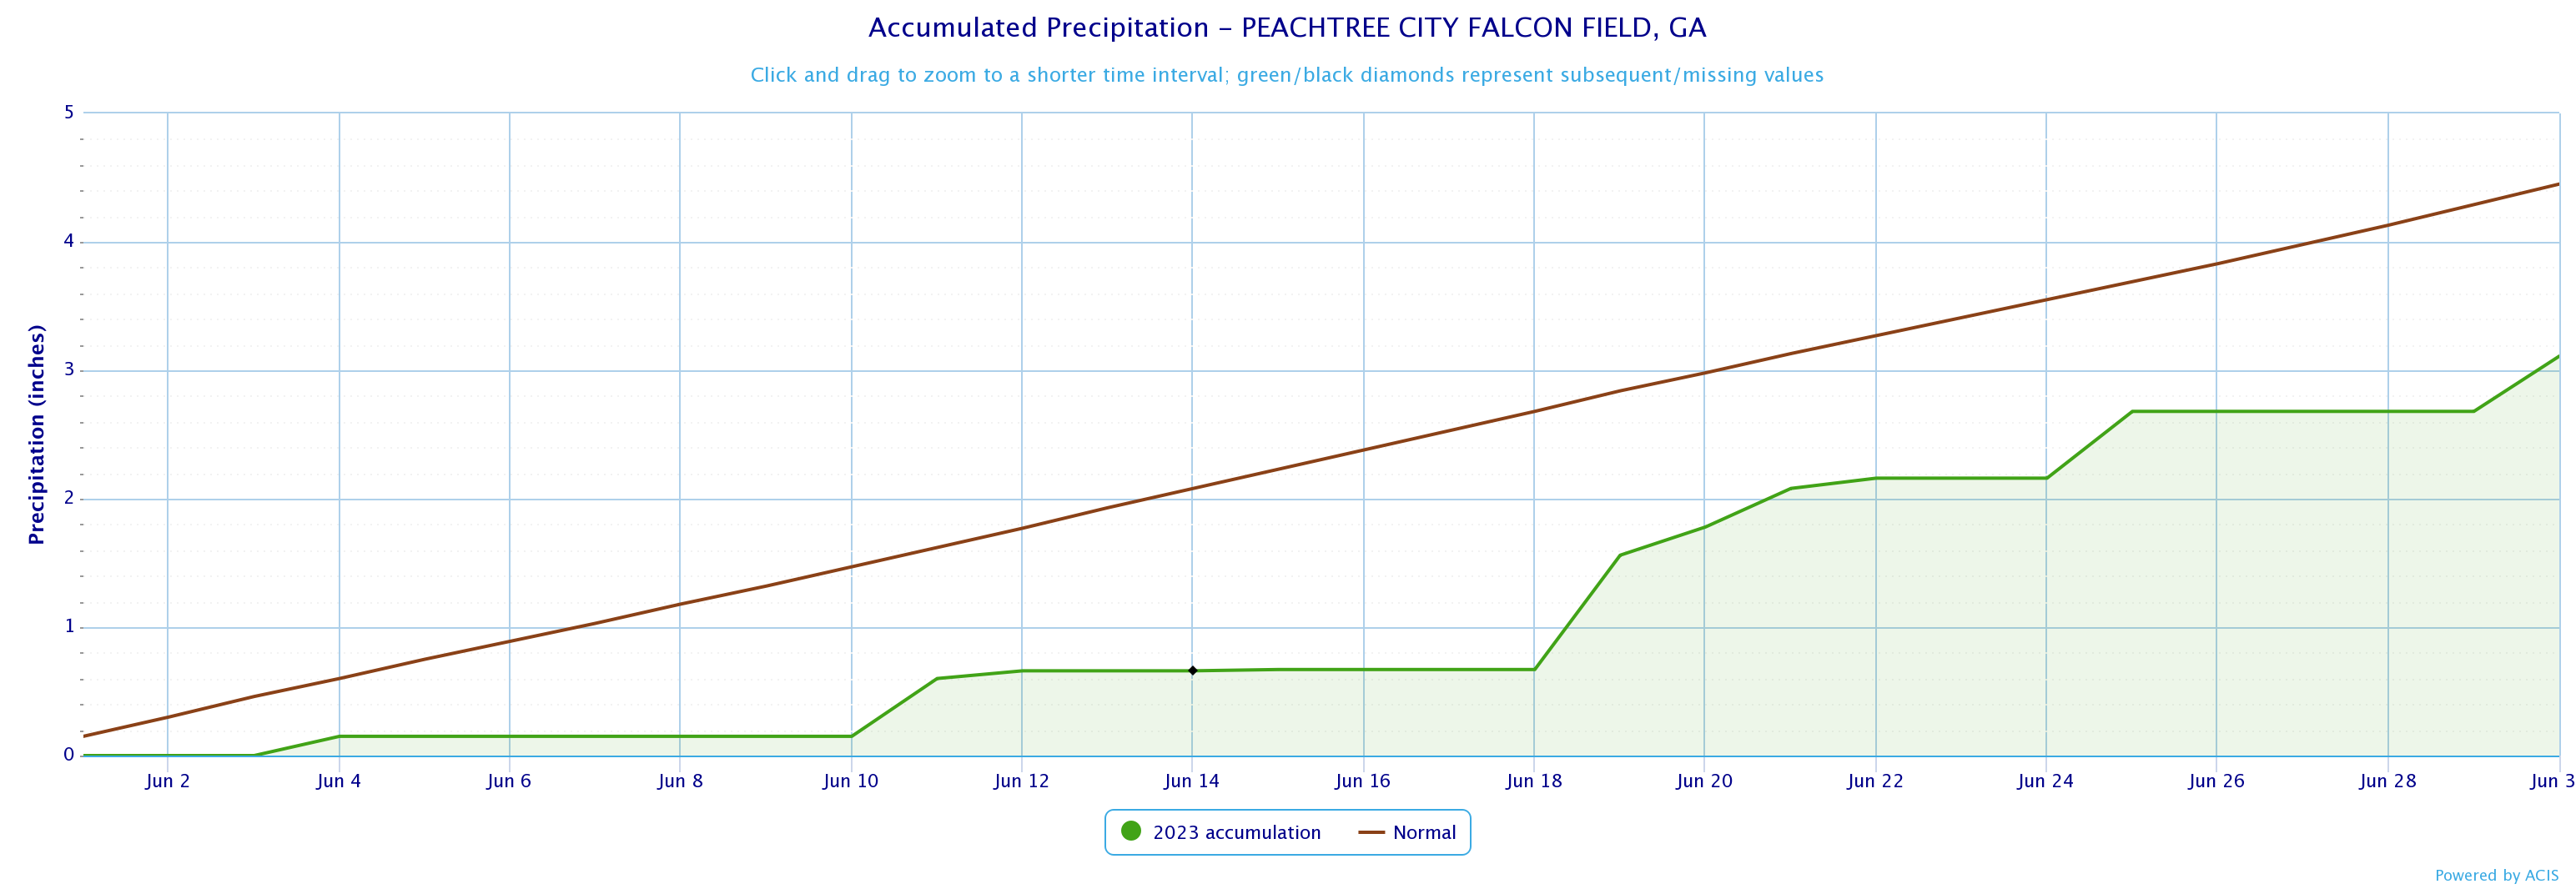
Peachtree City
3.11
4.45
-1.34
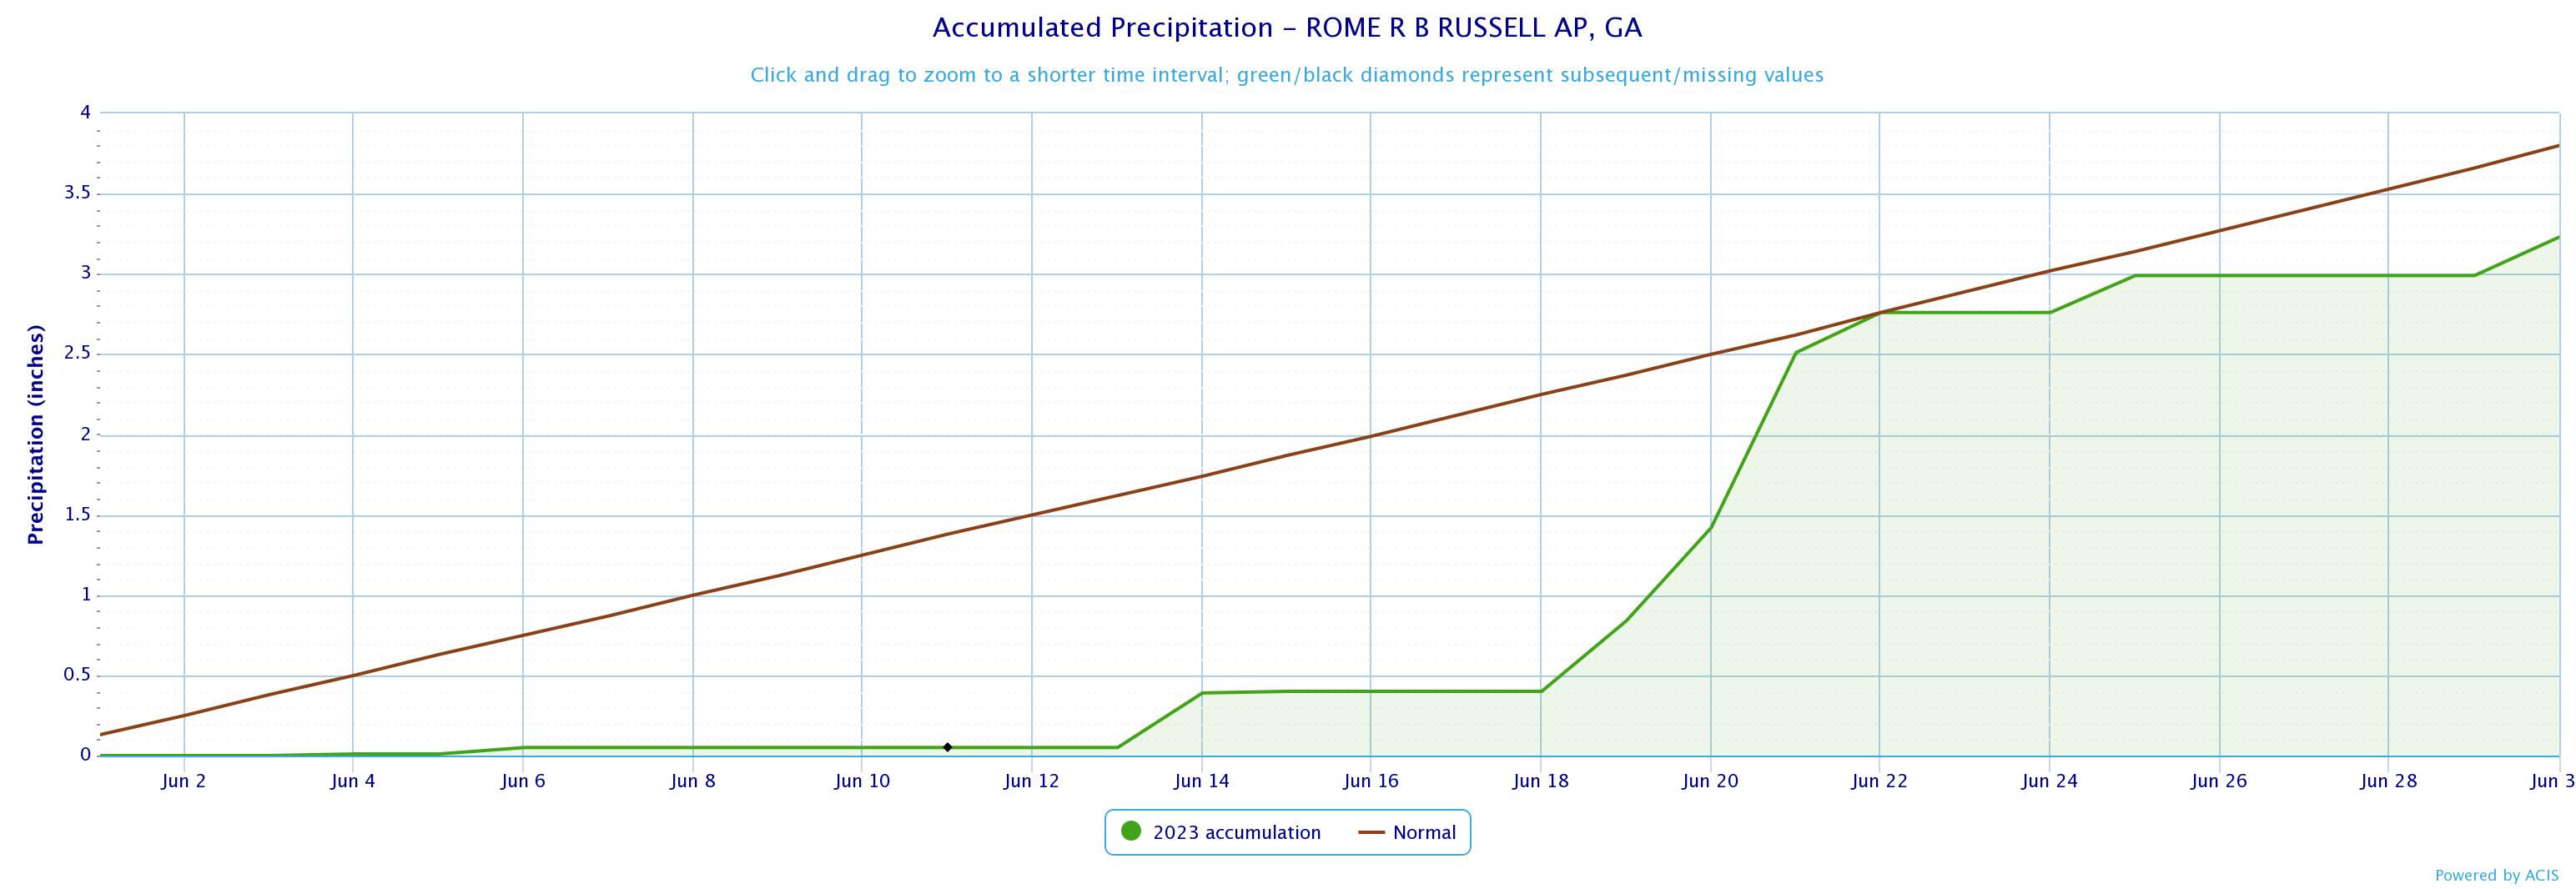
Rome
3.23
3.80
-0.57
June 2023 Precipitation Climate Statistics
Athens
2.03
6/19
Atlanta
1.00
6/19
Columbus
4.40*
6/14
Macon
2.47*
6/22
Dekalb Peachtree Arpt
1.02
6/21
Fulton Co Arpt
0.75
6/19
Gainesville
1.92
6/11
Peachtree City
0.89
6/19
Rome
1.09
6/19
Click the links below to explore the temperature and precipitation data across north and central Georgia for the month of June 2022.
Temperature Maps
Precipitation Maps
Temperature Graphs
Precipitation Graphs

Temperature and precipitation records at our 4 main climate sites are located below.
June 2023 Climate Records
Date
Type
Location
Records set over a 24 hour period
6/14
Daily Rainfall
Columbus
4.40 Inches of rain fell over 24 hours. This breaks the old record of 1.56 inches set in 1966.
6/22
Daily Rainfall
Macon
2.47 Inches of rain fell over 24 hours. This breaks the old record of 1.60 inches set in 1983.
Larger events that occurred across north and central Georgia this past June can be found here.

The July climate outlook is below.
July Outlook